Zip Codes with the Highest Percentage of Population Employed in Food Preparation & Serving in Lake City, FL
RELATED REPORTS & OPTIONS
Food Preparation & Serving
Lake City
Compare Zip Codes
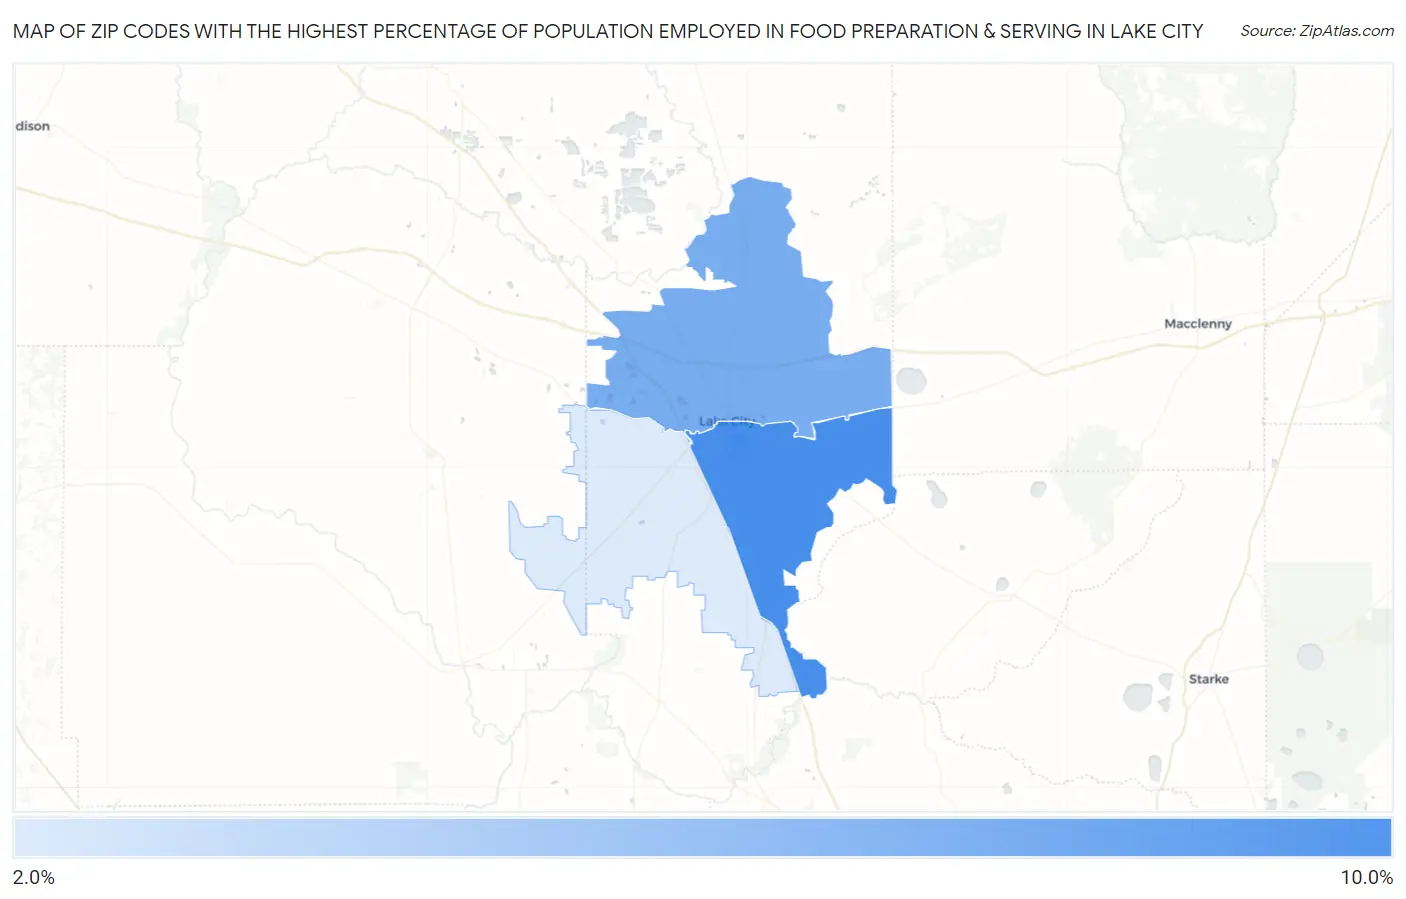
Map of Zip Codes with the Highest Percentage of Population Employed in Food Preparation & Serving in Lake City
2.6%
8.5%
Zip Codes with the Highest Percentage of Population Employed in Food Preparation & Serving in Lake City, FL
| Zip Code | % Employed | vs State | vs National | |
| 1. | 32025 | 8.5% | 6.1%(+2.37)#163 | 5.3%(+3.17)#4,110 |
| 2. | 32055 | 6.5% | 6.1%(+0.413)#387 | 5.3%(+1.22)#7,860 |
| 3. | 32024 | 2.6% | 6.1%(-3.53)#850 | 5.3%(-2.73)#22,947 |
1
Common Questions
What are the Top Zip Codes with the Highest Percentage of Population Employed in Food Preparation & Serving in Lake City, FL?
Top Zip Codes with the Highest Percentage of Population Employed in Food Preparation & Serving in Lake City, FL are:
What zip code has the Highest Percentage of Population Employed in Food Preparation & Serving in Lake City, FL?
32025 has the Highest Percentage of Population Employed in Food Preparation & Serving in Lake City, FL with 8.5%.
What is the Percentage of Population Employed in Food Preparation & Serving in Lake City, FL?
Percentage of Population Employed in Food Preparation & Serving in Lake City is 7.1%.
What is the Percentage of Population Employed in Food Preparation & Serving in Florida?
Percentage of Population Employed in Food Preparation & Serving in Florida is 6.1%.
What is the Percentage of Population Employed in Food Preparation & Serving in the United States?
Percentage of Population Employed in Food Preparation & Serving in the United States is 5.3%.