Zip Codes with the Highest Percentage of Population Employed in Security & Protection in Jacksonville, FL
RELATED REPORTS & OPTIONS
Security & Protection
Jacksonville
Compare Zip Codes
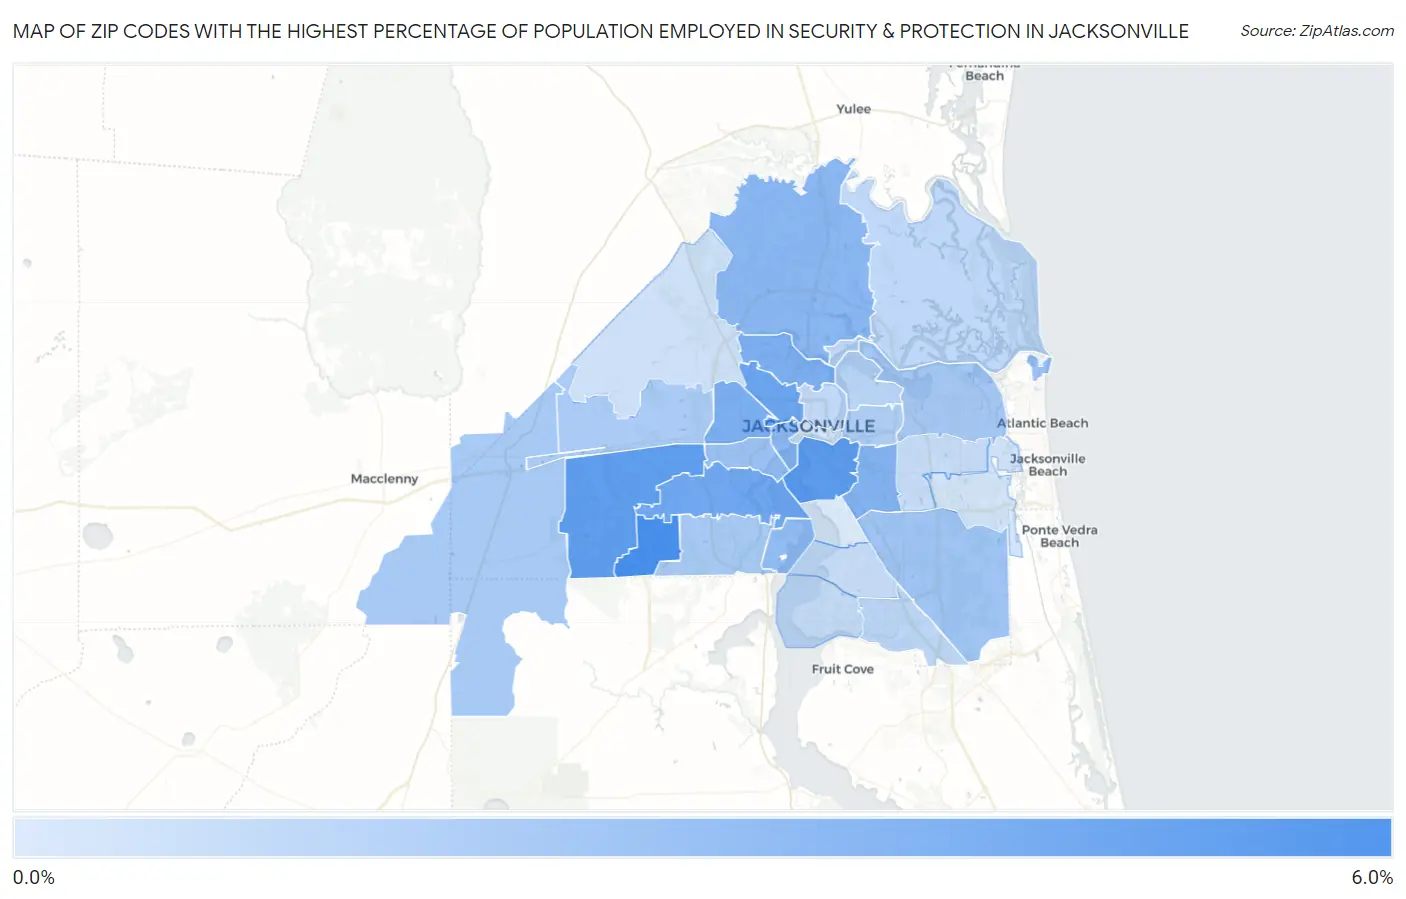
Map of Zip Codes with the Highest Percentage of Population Employed in Security & Protection in Jacksonville
0.69%
5.0%
Zip Codes with the Highest Percentage of Population Employed in Security & Protection in Jacksonville, FL
| Zip Code | % Employed | vs State | vs National | |
| 1. | 32222 | 5.0% | 2.4%(+2.59)#101 | 2.1%(+2.86)#2,918 |
| 2. | 32207 | 4.4% | 2.4%(+2.02)#129 | 2.1%(+2.29)#3,719 |
| 3. | 32221 | 4.2% | 2.4%(+1.81)#143 | 2.1%(+2.08)#4,066 |
| 4. | 32209 | 3.9% | 2.4%(+1.49)#167 | 2.1%(+1.76)#4,672 |
| 5. | 32210 | 3.8% | 2.4%(+1.36)#178 | 2.1%(+1.63)#4,945 |
| 6. | 32254 | 3.5% | 2.4%(+1.03)#205 | 2.1%(+1.31)#5,792 |
| 7. | 32208 | 3.4% | 2.4%(+0.945)#214 | 2.1%(+1.22)#6,038 |
| 8. | 32216 | 3.2% | 2.4%(+0.817)#231 | 2.1%(+1.09)#6,440 |
| 9. | 32218 | 3.1% | 2.4%(+0.664)#251 | 2.1%(+0.935)#6,941 |
| 10. | 32204 | 3.0% | 2.4%(+0.629)#257 | 2.1%(+0.900)#7,049 |
| 11. | 32212 | 2.8% | 2.4%(+0.339)#316 | 2.1%(+0.610)#8,282 |
| 12. | 32227 | 2.6% | 2.4%(+0.150)#354 | 2.1%(+0.422)#9,156 |
| 13. | 32205 | 2.5% | 2.4%(+0.114)#363 | 2.1%(+0.385)#9,334 |
| 14. | 32256 | 2.4% | 2.4%(-0.054)#415 | 2.1%(+0.218)#10,251 |
| 15. | 32225 | 2.2% | 2.4%(-0.183)#447 | 2.1%(+0.089)#11,032 |
| 16. | 32244 | 2.2% | 2.4%(-0.212)#455 | 2.1%(+0.059)#11,209 |
| 17. | 32234 | 2.2% | 2.4%(-0.215)#457 | 2.1%(+0.056)#11,229 |
| 18. | 32220 | 2.1% | 2.4%(-0.293)#490 | 2.1%(-0.022)#11,726 |
| 19. | 32211 | 1.9% | 2.4%(-0.497)#539 | 2.1%(-0.225)#13,059 |
| 20. | 32277 | 1.7% | 2.4%(-0.729)#621 | 2.1%(-0.458)#14,754 |
| 21. | 32258 | 1.6% | 2.4%(-0.844)#653 | 2.1%(-0.573)#15,600 |
| 22. | 32226 | 1.6% | 2.4%(-0.860)#657 | 2.1%(-0.589)#15,724 |
| 23. | 32206 | 1.5% | 2.4%(-0.938)#682 | 2.1%(-0.667)#16,346 |
| 24. | 32223 | 1.4% | 2.4%(-1.06)#717 | 2.1%(-0.787)#17,245 |
| 25. | 32257 | 1.3% | 2.4%(-1.12)#736 | 2.1%(-0.847)#17,716 |
| 26. | 32246 | 1.3% | 2.4%(-1.14)#742 | 2.1%(-0.865)#17,879 |
| 27. | 32219 | 1.1% | 2.4%(-1.37)#800 | 2.1%(-1.10)#19,663 |
| 28. | 32202 | 0.96% | 2.4%(-1.46)#817 | 2.1%(-1.19)#20,398 |
| 29. | 32224 | 0.95% | 2.4%(-1.47)#818 | 2.1%(-1.20)#20,445 |
| 30. | 32217 | 0.69% | 2.4%(-1.73)#856 | 2.1%(-1.46)#22,183 |
1
Common Questions
What are the Top 10 Zip Codes with the Highest Percentage of Population Employed in Security & Protection in Jacksonville, FL?
Top 10 Zip Codes with the Highest Percentage of Population Employed in Security & Protection in Jacksonville, FL are:
What zip code has the Highest Percentage of Population Employed in Security & Protection in Jacksonville, FL?
32222 has the Highest Percentage of Population Employed in Security & Protection in Jacksonville, FL with 5.0%.
What is the Percentage of Population Employed in Security & Protection in Jacksonville, FL?
Percentage of Population Employed in Security & Protection in Jacksonville is 2.4%.
What is the Percentage of Population Employed in Security & Protection in Florida?
Percentage of Population Employed in Security & Protection in Florida is 2.4%.
What is the Percentage of Population Employed in Security & Protection in the United States?
Percentage of Population Employed in Security & Protection in the United States is 2.1%.