Zip Codes with the Highest Percentage of Population Employed in Food Preparation & Serving in Lutz, FL
RELATED REPORTS & OPTIONS
Food Preparation & Serving
Lutz
Compare Zip Codes
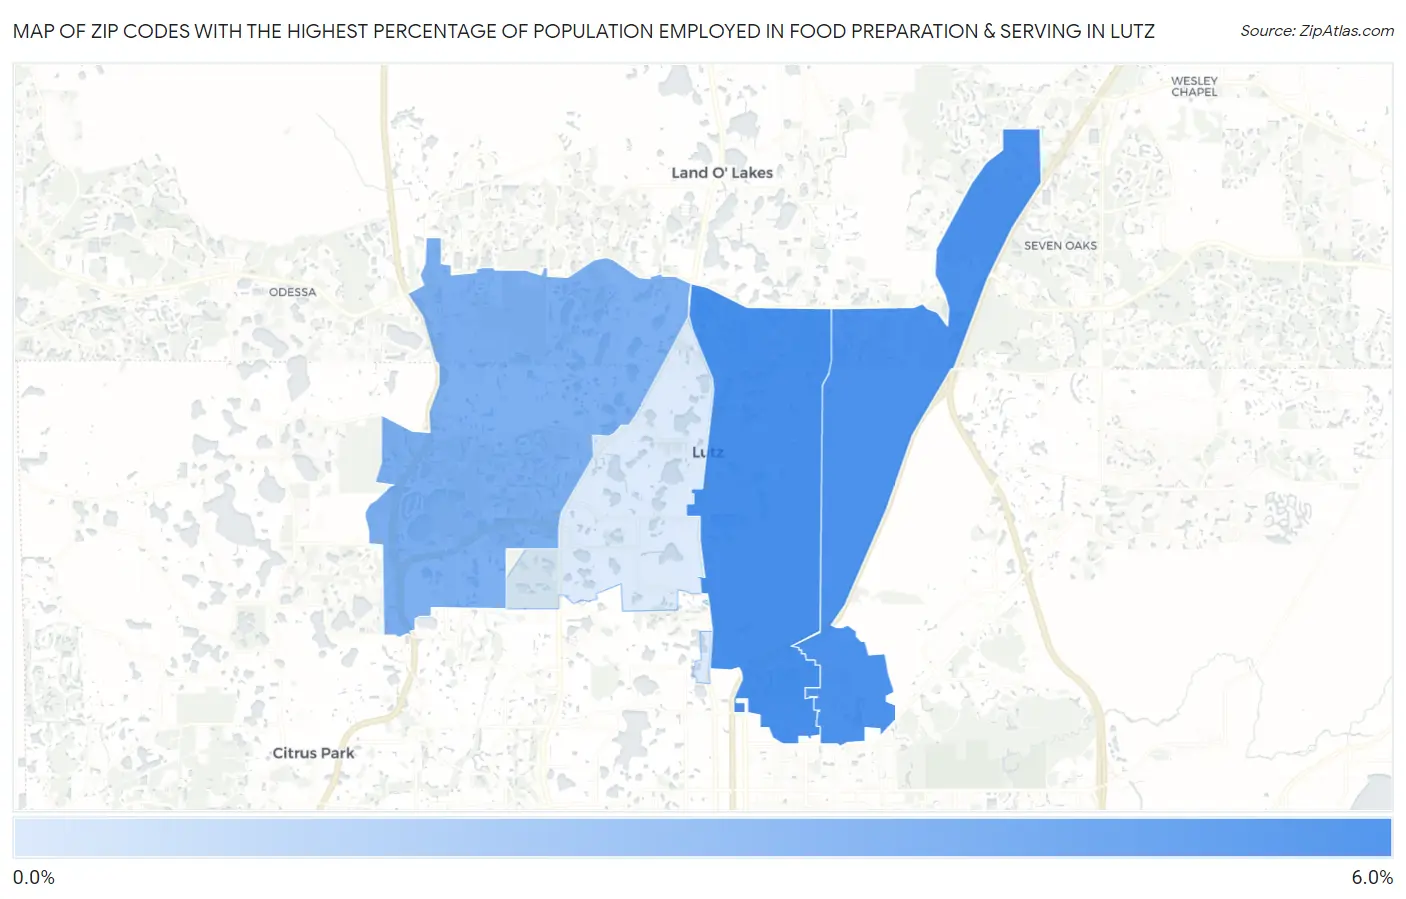
Map of Zip Codes with the Highest Percentage of Population Employed in Food Preparation & Serving in Lutz
0.91%
5.3%
Zip Codes with the Highest Percentage of Population Employed in Food Preparation & Serving in Lutz, FL
| Zip Code | % Employed | vs State | vs National | |
| 1. | 33549 | 5.3% | 6.1%(-0.794)#553 | 5.3%(+0.011)#11,773 |
| 2. | 33559 | 5.2% | 6.1%(-0.897)#569 | 5.3%(-0.093)#12,171 |
| 3. | 33558 | 3.7% | 6.1%(-2.35)#762 | 5.3%(-1.55)#18,176 |
| 4. | 33548 | 0.91% | 6.1%(-5.18)#918 | 5.3%(-4.38)#27,140 |
1
Common Questions
What are the Top 3 Zip Codes with the Highest Percentage of Population Employed in Food Preparation & Serving in Lutz, FL?
Top 3 Zip Codes with the Highest Percentage of Population Employed in Food Preparation & Serving in Lutz, FL are:
What zip code has the Highest Percentage of Population Employed in Food Preparation & Serving in Lutz, FL?
33549 has the Highest Percentage of Population Employed in Food Preparation & Serving in Lutz, FL with 5.3%.
What is the Percentage of Population Employed in Food Preparation & Serving in Lutz, FL?
Percentage of Population Employed in Food Preparation & Serving in Lutz is 3.6%.
What is the Percentage of Population Employed in Food Preparation & Serving in Florida?
Percentage of Population Employed in Food Preparation & Serving in Florida is 6.1%.
What is the Percentage of Population Employed in Food Preparation & Serving in the United States?
Percentage of Population Employed in Food Preparation & Serving in the United States is 5.3%.