Zip Codes with the Highest Percentage of Population Employed in Food Preparation & Serving in Homestead, FL
RELATED REPORTS & OPTIONS
Food Preparation & Serving
Homestead
Compare Zip Codes
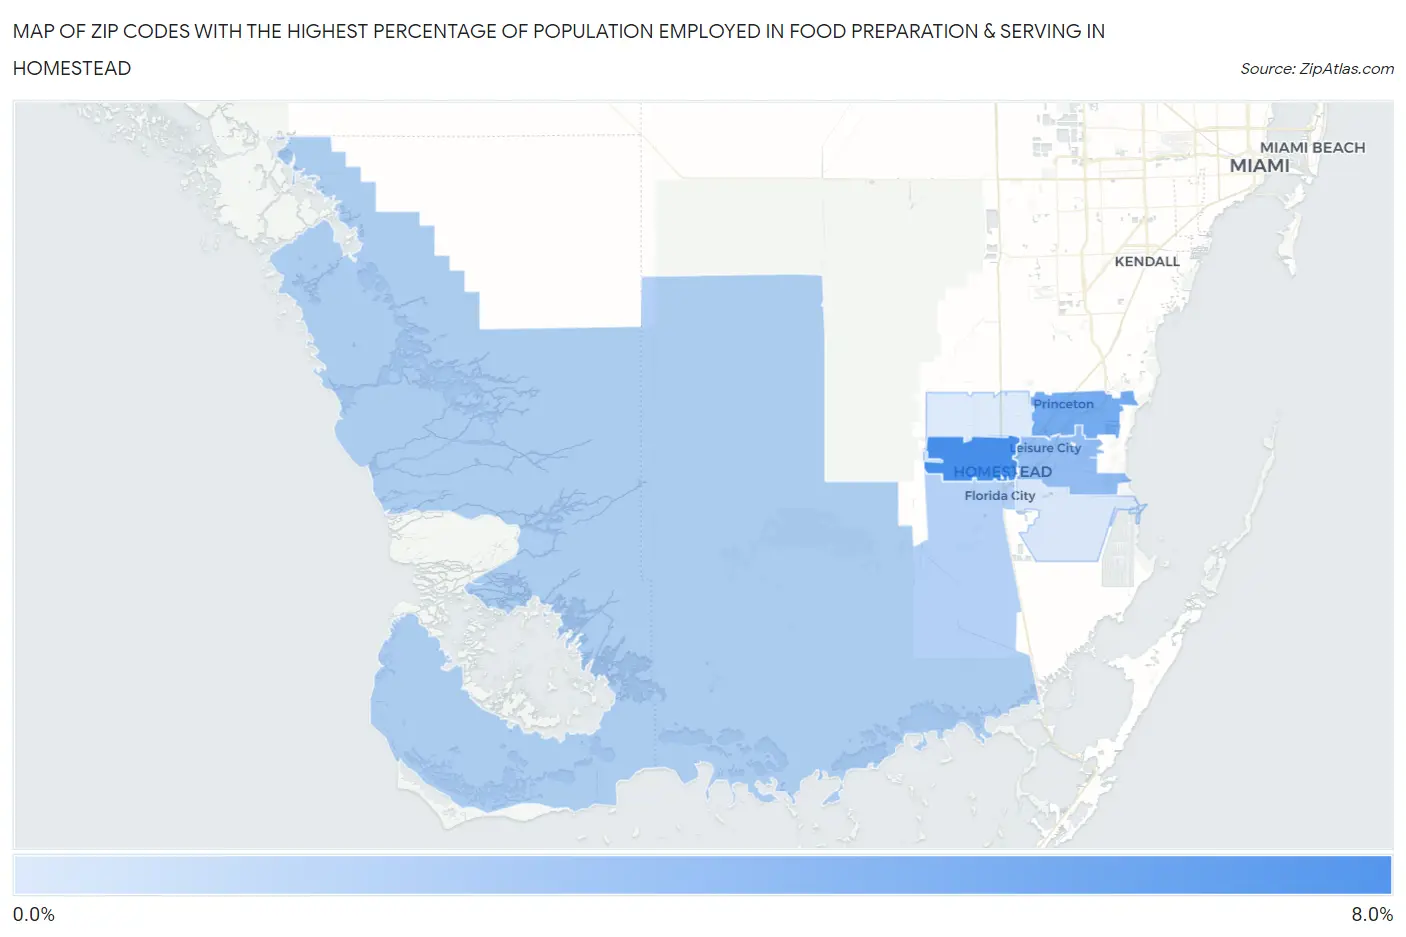
Map of Zip Codes with the Highest Percentage of Population Employed in Food Preparation & Serving in Homestead
1.6%
6.2%
Zip Codes with the Highest Percentage of Population Employed in Food Preparation & Serving in Homestead, FL
| Zip Code | % Employed | vs State | vs National | |
| 1. | 33030 | 6.2% | 6.1%(+0.107)#426 | 5.3%(+0.911)#8,736 |
| 2. | 33032 | 4.8% | 6.1%(-1.34)#638 | 5.3%(-0.531)#13,938 |
| 3. | 33033 | 3.8% | 6.1%(-2.29)#754 | 5.3%(-1.49)#17,949 |
| 4. | 33034 | 2.8% | 6.1%(-3.24)#831 | 5.3%(-2.44)#21,859 |
| 5. | 33035 | 1.7% | 6.1%(-4.36)#899 | 5.3%(-3.56)#25,463 |
| 6. | 33031 | 1.6% | 6.1%(-4.53)#907 | 5.3%(-3.73)#25,859 |
1
Common Questions
What are the Top 5 Zip Codes with the Highest Percentage of Population Employed in Food Preparation & Serving in Homestead, FL?
Top 5 Zip Codes with the Highest Percentage of Population Employed in Food Preparation & Serving in Homestead, FL are:
What zip code has the Highest Percentage of Population Employed in Food Preparation & Serving in Homestead, FL?
33030 has the Highest Percentage of Population Employed in Food Preparation & Serving in Homestead, FL with 6.2%.
What is the Percentage of Population Employed in Food Preparation & Serving in Homestead, FL?
Percentage of Population Employed in Food Preparation & Serving in Homestead is 4.6%.
What is the Percentage of Population Employed in Food Preparation & Serving in Florida?
Percentage of Population Employed in Food Preparation & Serving in Florida is 6.1%.
What is the Percentage of Population Employed in Food Preparation & Serving in the United States?
Percentage of Population Employed in Food Preparation & Serving in the United States is 5.3%.