Zip Codes with the Highest Percentage of Population Employed in Food Preparation & Serving in Bradenton, FL
RELATED REPORTS & OPTIONS
Food Preparation & Serving
Bradenton
Compare Zip Codes
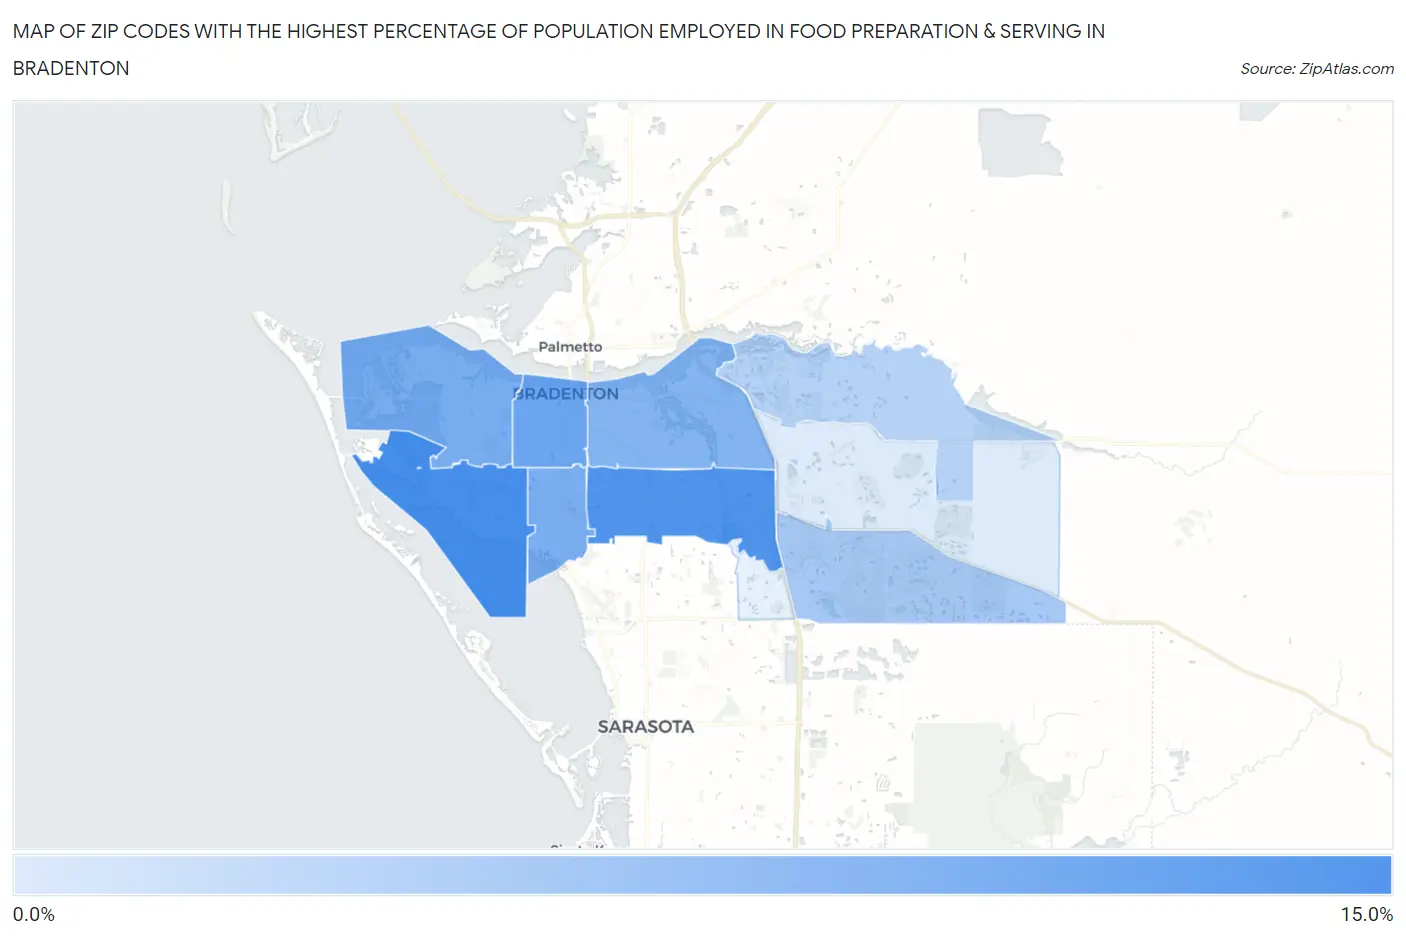
Map of Zip Codes with the Highest Percentage of Population Employed in Food Preparation & Serving in Bradenton
2.2%
10.6%
Zip Codes with the Highest Percentage of Population Employed in Food Preparation & Serving in Bradenton, FL
| Zip Code | % Employed | vs State | vs National | |
| 1. | 34210 | 10.6% | 6.1%(+4.49)#69 | 5.3%(+5.30)#2,277 |
| 2. | 34203 | 10.2% | 6.1%(+4.14)#81 | 5.3%(+4.94)#2,464 |
| 3. | 34205 | 8.4% | 6.1%(+2.31)#165 | 5.3%(+3.11)#4,174 |
| 4. | 34209 | 7.8% | 6.1%(+1.68)#221 | 5.3%(+2.48)#5,110 |
| 5. | 34207 | 7.7% | 6.1%(+1.63)#230 | 5.3%(+2.44)#5,179 |
| 6. | 34208 | 7.1% | 6.1%(+1.04)#300 | 5.3%(+1.84)#6,282 |
| 7. | 34202 | 5.2% | 6.1%(-0.871)#565 | 5.3%(-0.067)#12,069 |
| 8. | 34212 | 4.3% | 6.1%(-1.77)#680 | 5.3%(-0.968)#15,805 |
| 9. | 34211 | 2.2% | 6.1%(-3.92)#881 | 5.3%(-3.12)#24,193 |
1
Common Questions
What are the Top 5 Zip Codes with the Highest Percentage of Population Employed in Food Preparation & Serving in Bradenton, FL?
Top 5 Zip Codes with the Highest Percentage of Population Employed in Food Preparation & Serving in Bradenton, FL are:
What zip code has the Highest Percentage of Population Employed in Food Preparation & Serving in Bradenton, FL?
34210 has the Highest Percentage of Population Employed in Food Preparation & Serving in Bradenton, FL with 10.6%.
What is the Percentage of Population Employed in Food Preparation & Serving in Bradenton, FL?
Percentage of Population Employed in Food Preparation & Serving in Bradenton is 8.2%.
What is the Percentage of Population Employed in Food Preparation & Serving in Florida?
Percentage of Population Employed in Food Preparation & Serving in Florida is 6.1%.
What is the Percentage of Population Employed in Food Preparation & Serving in the United States?
Percentage of Population Employed in Food Preparation & Serving in the United States is 5.3%.