Zip Codes with the Highest Percentage of Population Employed in Food Preparation & Serving in North Port, FL
RELATED REPORTS & OPTIONS
Food Preparation & Serving
North Port
Compare Zip Codes
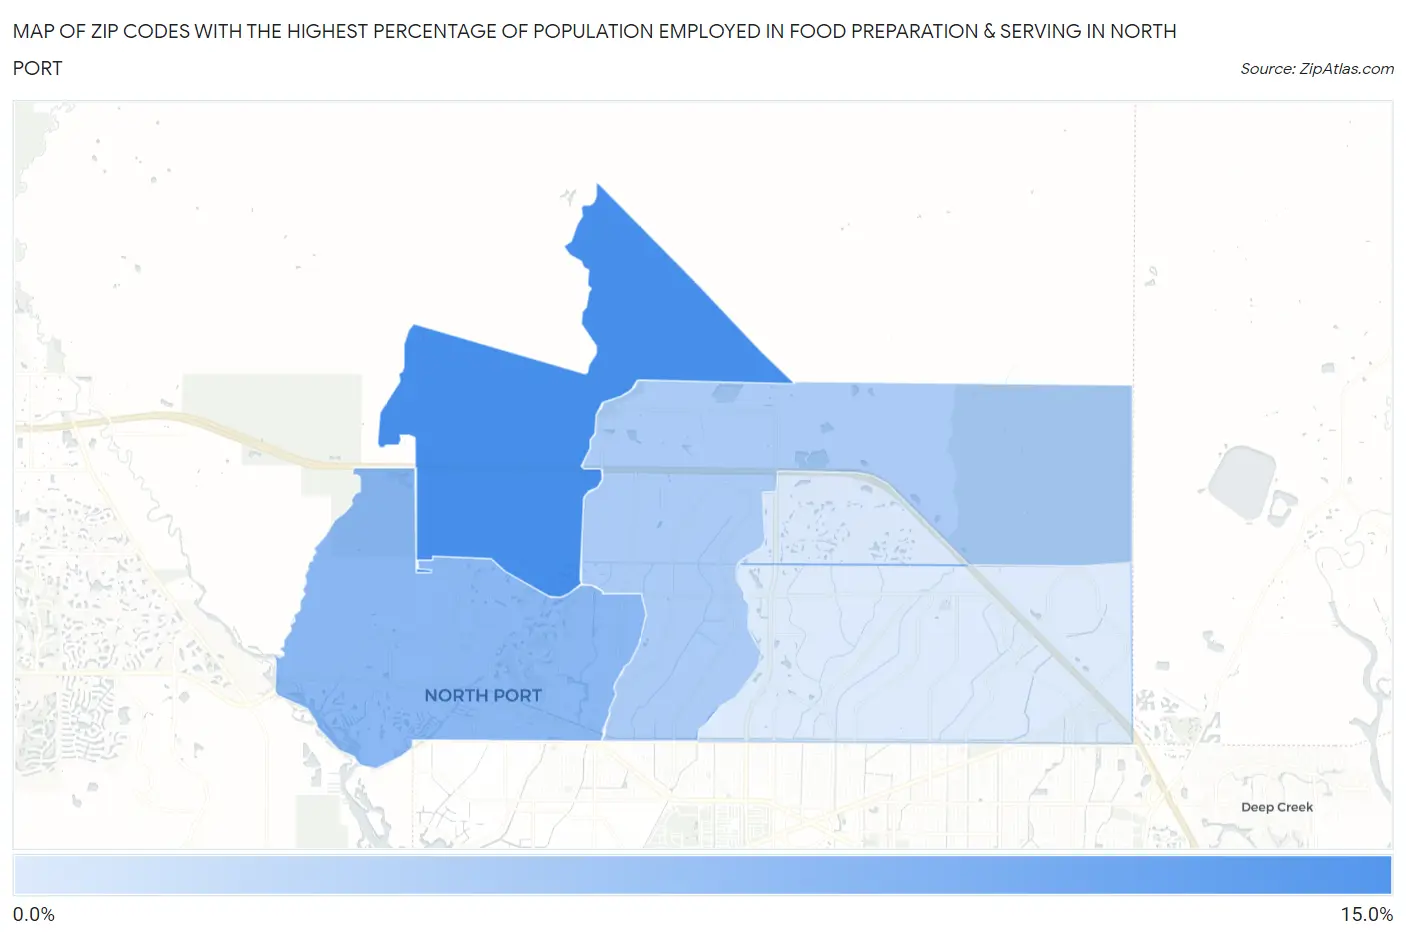
Map of Zip Codes with the Highest Percentage of Population Employed in Food Preparation & Serving in North Port
3.7%
13.3%
Zip Codes with the Highest Percentage of Population Employed in Food Preparation & Serving in North Port, FL
| Zip Code | % Employed | vs State | vs National | |
| 1. | 34291 | 13.3% | 6.1%(+7.23)#29 | 5.3%(+8.04)#1,315 |
| 2. | 34287 | 8.9% | 6.1%(+2.81)#141 | 5.3%(+3.61)#3,619 |
| 3. | 34286 | 6.8% | 6.1%(+0.750)#336 | 5.3%(+1.55)#6,961 |
| 4. | 34289 | 3.9% | 6.1%(-2.18)#736 | 5.3%(-1.38)#17,499 |
| 5. | 34288 | 3.7% | 6.1%(-2.43)#772 | 5.3%(-1.62)#18,513 |
1
Common Questions
What are the Top 3 Zip Codes with the Highest Percentage of Population Employed in Food Preparation & Serving in North Port, FL?
Top 3 Zip Codes with the Highest Percentage of Population Employed in Food Preparation & Serving in North Port, FL are:
What zip code has the Highest Percentage of Population Employed in Food Preparation & Serving in North Port, FL?
34291 has the Highest Percentage of Population Employed in Food Preparation & Serving in North Port, FL with 13.3%.
What is the Percentage of Population Employed in Food Preparation & Serving in North Port, FL?
Percentage of Population Employed in Food Preparation & Serving in North Port is 7.1%.
What is the Percentage of Population Employed in Food Preparation & Serving in Florida?
Percentage of Population Employed in Food Preparation & Serving in Florida is 6.1%.
What is the Percentage of Population Employed in Food Preparation & Serving in the United States?
Percentage of Population Employed in Food Preparation & Serving in the United States is 5.3%.