Zip Codes with the Highest Percentage of Population Employed in Food Preparation & Serving in Fort Pierce, FL
RELATED REPORTS & OPTIONS
Food Preparation & Serving
Fort Pierce
Compare Zip Codes
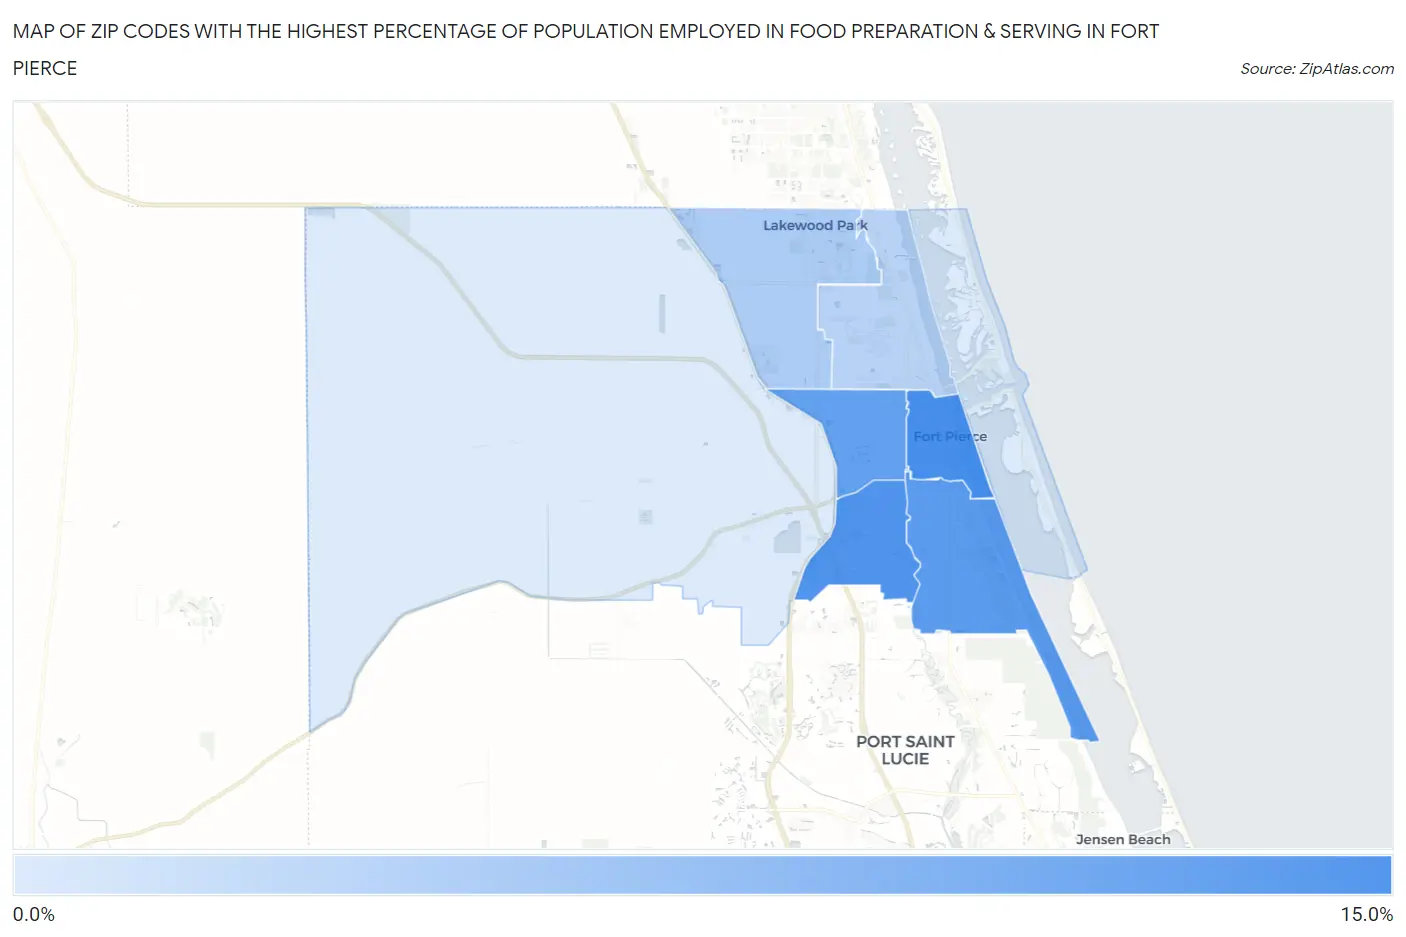
Map of Zip Codes with the Highest Percentage of Population Employed in Food Preparation & Serving in Fort Pierce
2.4%
10.5%
Zip Codes with the Highest Percentage of Population Employed in Food Preparation & Serving in Fort Pierce, FL
| Zip Code | % Employed | vs State | vs National | |
| 1. | 34950 | 10.5% | 6.1%(+4.37)#75 | 5.3%(+5.17)#2,348 |
| 2. | 34981 | 9.9% | 6.1%(+3.85)#90 | 5.3%(+4.65)#2,678 |
| 3. | 34982 | 9.4% | 6.1%(+3.31)#115 | 5.3%(+4.11)#3,141 |
| 4. | 34947 | 8.9% | 6.1%(+2.81)#142 | 5.3%(+3.61)#3,622 |
| 5. | 34951 | 5.0% | 6.1%(-1.10)#604 | 5.3%(-0.295)#12,995 |
| 6. | 34946 | 4.3% | 6.1%(-1.78)#682 | 5.3%(-0.975)#15,837 |
| 7. | 34945 | 2.5% | 6.1%(-3.61)#858 | 5.3%(-2.81)#23,235 |
| 8. | 34949 | 2.4% | 6.1%(-3.67)#863 | 5.3%(-2.87)#23,412 |
1
Common Questions
What are the Top 5 Zip Codes with the Highest Percentage of Population Employed in Food Preparation & Serving in Fort Pierce, FL?
Top 5 Zip Codes with the Highest Percentage of Population Employed in Food Preparation & Serving in Fort Pierce, FL are:
What zip code has the Highest Percentage of Population Employed in Food Preparation & Serving in Fort Pierce, FL?
34950 has the Highest Percentage of Population Employed in Food Preparation & Serving in Fort Pierce, FL with 10.5%.
What is the Percentage of Population Employed in Food Preparation & Serving in Fort Pierce, FL?
Percentage of Population Employed in Food Preparation & Serving in Fort Pierce is 8.0%.
What is the Percentage of Population Employed in Food Preparation & Serving in Florida?
Percentage of Population Employed in Food Preparation & Serving in Florida is 6.1%.
What is the Percentage of Population Employed in Food Preparation & Serving in the United States?
Percentage of Population Employed in Food Preparation & Serving in the United States is 5.3%.