Zip Codes with the Highest Percentage of Population Employed in Food Preparation & Serving in Edgewater, FL
RELATED REPORTS & OPTIONS
Food Preparation & Serving
Edgewater
Compare Zip Codes
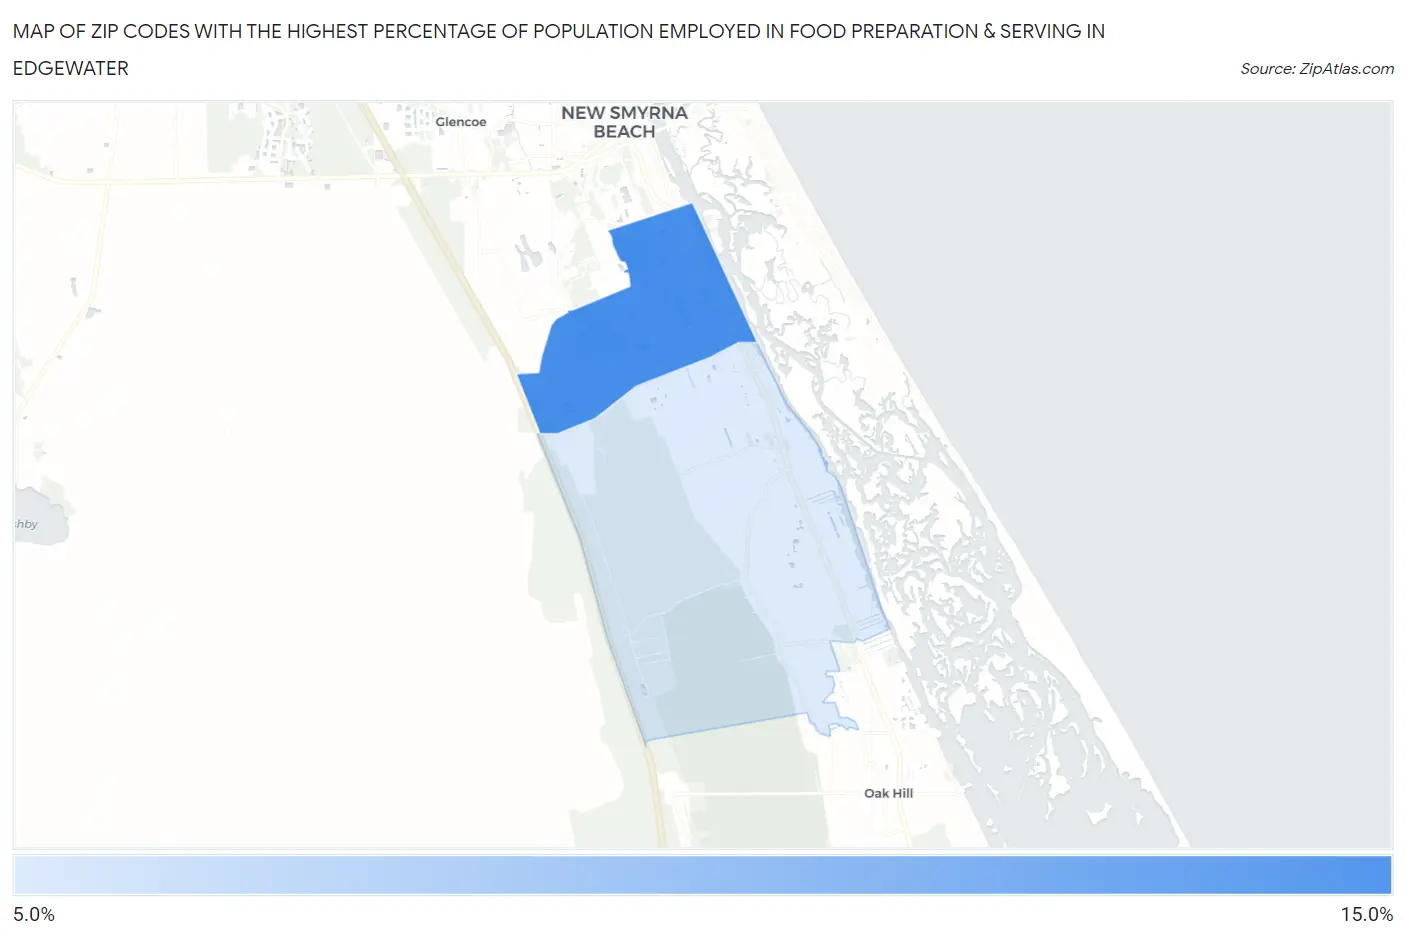
Map of Zip Codes with the Highest Percentage of Population Employed in Food Preparation & Serving in Edgewater
7.5%
10.3%
Zip Codes with the Highest Percentage of Population Employed in Food Preparation & Serving in Edgewater, FL
| Zip Code | % Employed | vs State | vs National | |
| 1. | 32132 | 10.3% | 6.1%(+4.22)#80 | 5.3%(+5.03)#2,416 |
| 2. | 32141 | 7.5% | 6.1%(+1.44)#255 | 5.3%(+2.24)#5,500 |
1
Common Questions
What are the Top Zip Codes with the Highest Percentage of Population Employed in Food Preparation & Serving in Edgewater, FL?
Top Zip Codes with the Highest Percentage of Population Employed in Food Preparation & Serving in Edgewater, FL are:
What zip code has the Highest Percentage of Population Employed in Food Preparation & Serving in Edgewater, FL?
32132 has the Highest Percentage of Population Employed in Food Preparation & Serving in Edgewater, FL with 10.3%.
What is the Percentage of Population Employed in Food Preparation & Serving in Edgewater, FL?
Percentage of Population Employed in Food Preparation & Serving in Edgewater is 7.7%.
What is the Percentage of Population Employed in Food Preparation & Serving in Florida?
Percentage of Population Employed in Food Preparation & Serving in Florida is 6.1%.
What is the Percentage of Population Employed in Food Preparation & Serving in the United States?
Percentage of Population Employed in Food Preparation & Serving in the United States is 5.3%.