Zip Codes with the Highest Percentage of Population Employed in Food Preparation & Serving in Tarpon Springs, FL
RELATED REPORTS & OPTIONS
Food Preparation & Serving
Tarpon Springs
Compare Zip Codes
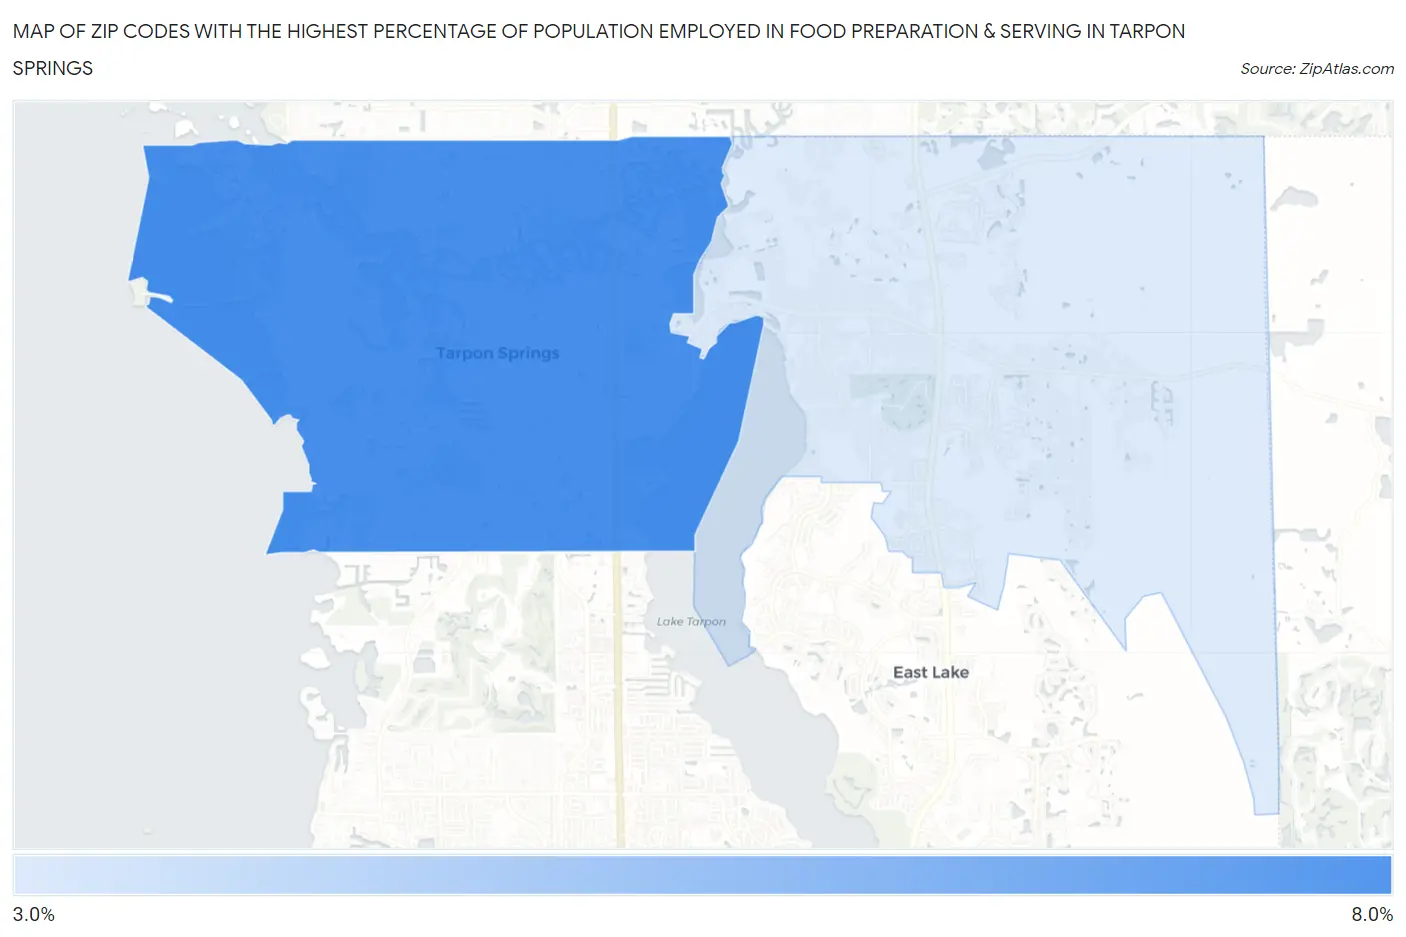
Map of Zip Codes with the Highest Percentage of Population Employed in Food Preparation & Serving in Tarpon Springs
3.3%
6.9%
Zip Codes with the Highest Percentage of Population Employed in Food Preparation & Serving in Tarpon Springs, FL
| Zip Code | % Employed | vs State | vs National | |
| 1. | 34689 | 6.9% | 6.1%(+0.835)#326 | 5.3%(+1.64)#6,759 |
| 2. | 34688 | 3.3% | 6.1%(-2.76)#802 | 5.3%(-1.96)#19,945 |
1
Common Questions
What are the Top Zip Codes with the Highest Percentage of Population Employed in Food Preparation & Serving in Tarpon Springs, FL?
Top Zip Codes with the Highest Percentage of Population Employed in Food Preparation & Serving in Tarpon Springs, FL are:
What zip code has the Highest Percentage of Population Employed in Food Preparation & Serving in Tarpon Springs, FL?
34689 has the Highest Percentage of Population Employed in Food Preparation & Serving in Tarpon Springs, FL with 6.9%.
What is the Percentage of Population Employed in Food Preparation & Serving in Tarpon Springs, FL?
Percentage of Population Employed in Food Preparation & Serving in Tarpon Springs is 6.4%.
What is the Percentage of Population Employed in Food Preparation & Serving in Florida?
Percentage of Population Employed in Food Preparation & Serving in Florida is 6.1%.
What is the Percentage of Population Employed in Food Preparation & Serving in the United States?
Percentage of Population Employed in Food Preparation & Serving in the United States is 5.3%.