Zip Codes with the Highest Percentage of Population Employed in Food Preparation & Serving in Jupiter, FL
RELATED REPORTS & OPTIONS
Food Preparation & Serving
Jupiter
Compare Zip Codes
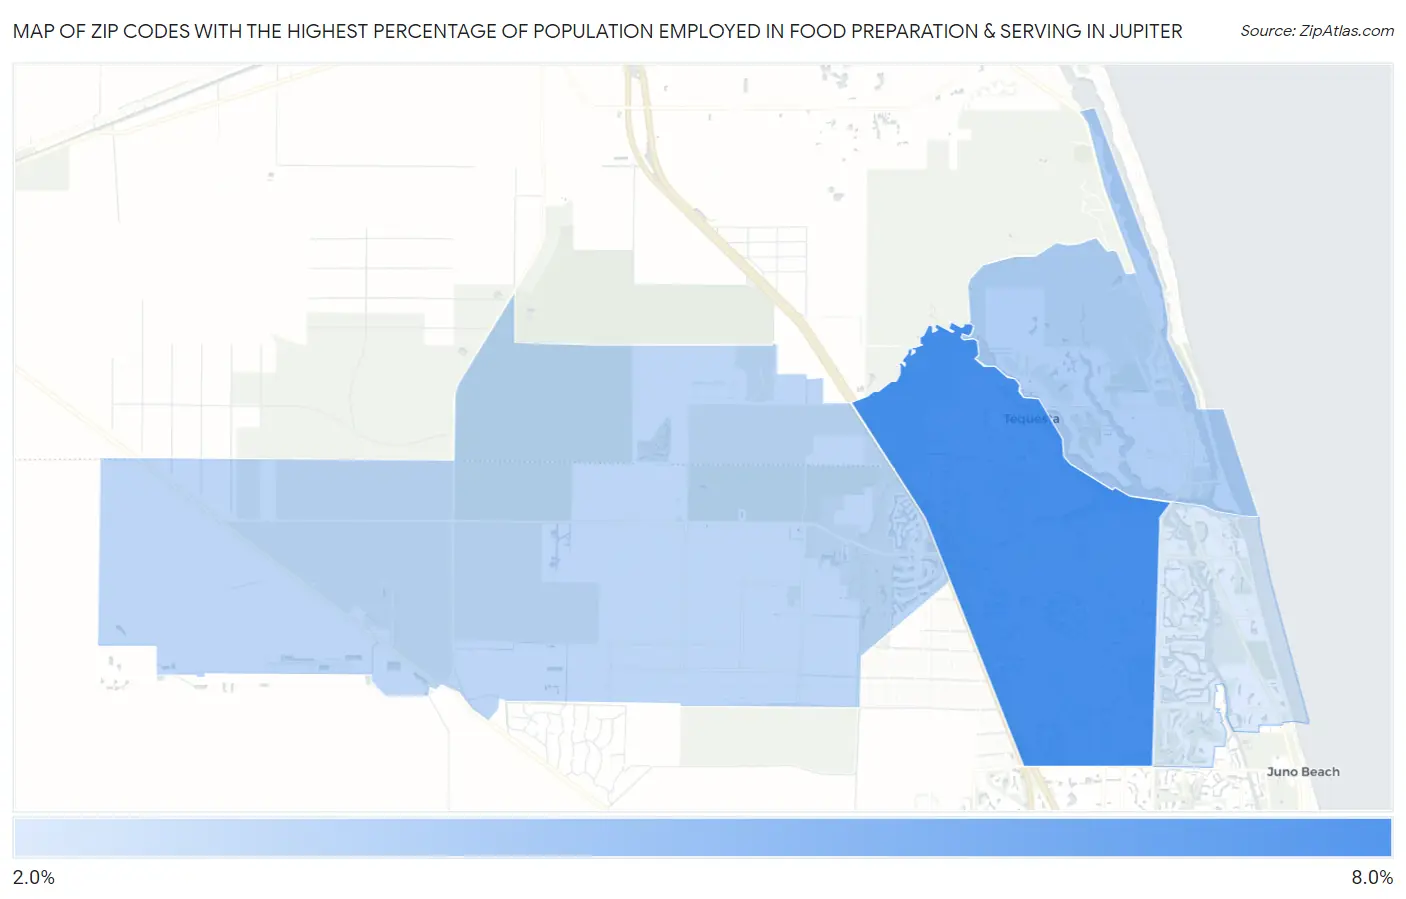
Map of Zip Codes with the Highest Percentage of Population Employed in Food Preparation & Serving in Jupiter
2.2%
7.6%
Zip Codes with the Highest Percentage of Population Employed in Food Preparation & Serving in Jupiter, FL
| Zip Code | % Employed | vs State | vs National | |
| 1. | 33458 | 7.6% | 6.1%(+1.50)#245 | 5.3%(+2.31)#5,387 |
| 2. | 33469 | 3.7% | 6.1%(-2.36)#763 | 5.3%(-1.55)#18,188 |
| 3. | 33478 | 3.3% | 6.1%(-2.76)#798 | 5.3%(-1.95)#19,905 |
| 4. | 33477 | 2.2% | 6.1%(-3.90)#879 | 5.3%(-3.10)#24,128 |
1
Common Questions
What are the Top 3 Zip Codes with the Highest Percentage of Population Employed in Food Preparation & Serving in Jupiter, FL?
Top 3 Zip Codes with the Highest Percentage of Population Employed in Food Preparation & Serving in Jupiter, FL are:
What zip code has the Highest Percentage of Population Employed in Food Preparation & Serving in Jupiter, FL?
33458 has the Highest Percentage of Population Employed in Food Preparation & Serving in Jupiter, FL with 7.6%.
What is the Percentage of Population Employed in Food Preparation & Serving in Jupiter, FL?
Percentage of Population Employed in Food Preparation & Serving in Jupiter is 6.6%.
What is the Percentage of Population Employed in Food Preparation & Serving in Florida?
Percentage of Population Employed in Food Preparation & Serving in Florida is 6.1%.
What is the Percentage of Population Employed in Food Preparation & Serving in the United States?
Percentage of Population Employed in Food Preparation & Serving in the United States is 5.3%.