Zip Codes with the Highest Percentage of Population Employed in Food Preparation & Serving in Lake Wales, FL
RELATED REPORTS & OPTIONS
Food Preparation & Serving
Lake Wales
Compare Zip Codes
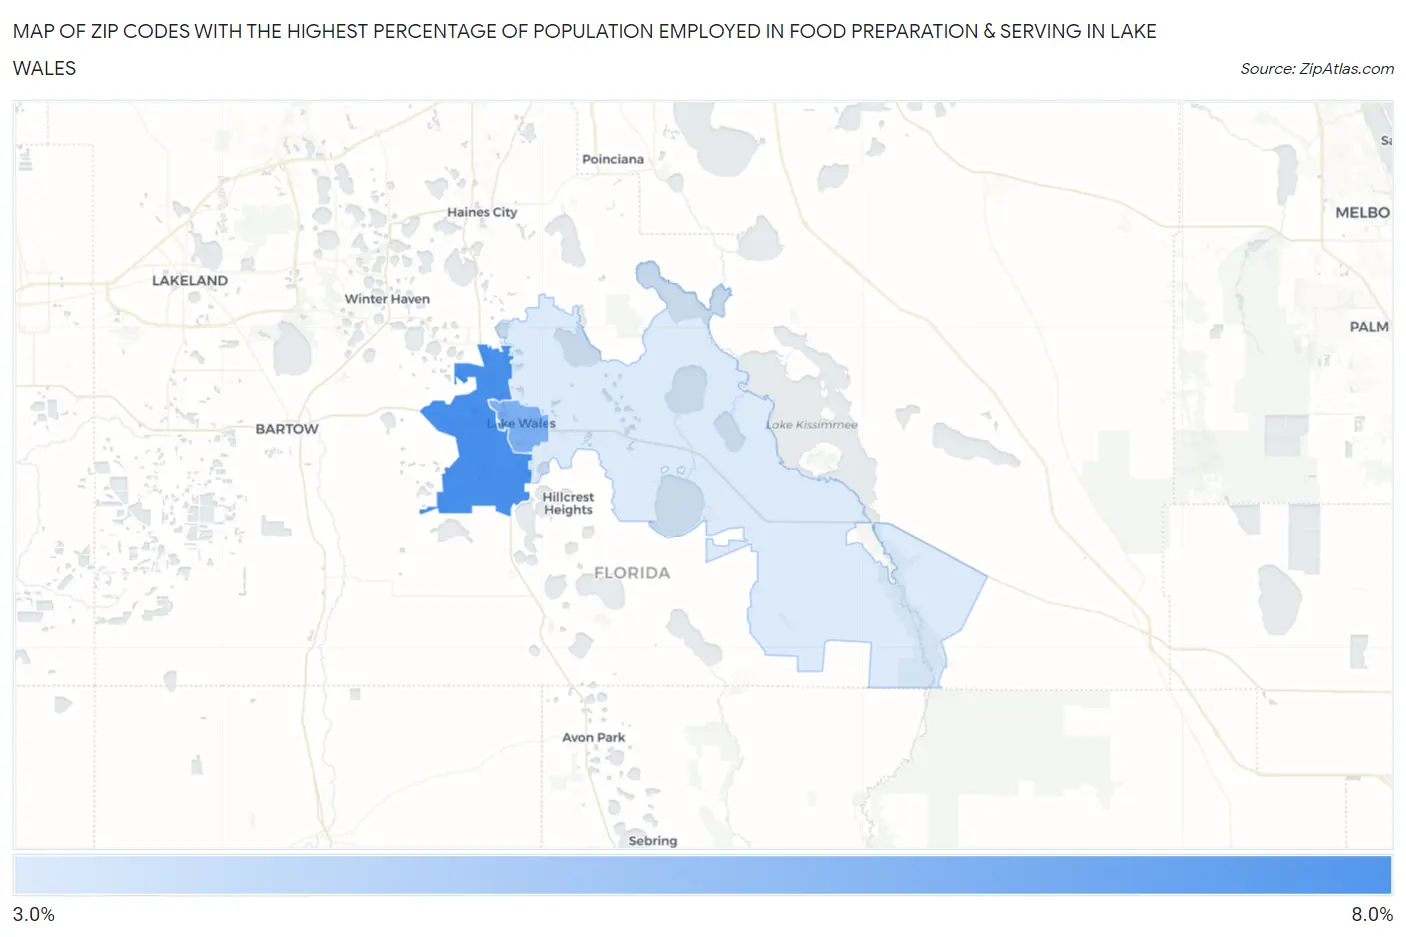
Map of Zip Codes with the Highest Percentage of Population Employed in Food Preparation & Serving in Lake Wales
3.7%
7.2%
Zip Codes with the Highest Percentage of Population Employed in Food Preparation & Serving in Lake Wales, FL
| Zip Code | % Employed | vs State | vs National | |
| 1. | 33859 | 7.2% | 6.1%(+1.10)#294 | 5.3%(+1.91)#6,152 |
| 2. | 33853 | 6.0% | 6.1%(-0.123)#464 | 5.3%(+0.681)#9,449 |
| 3. | 33898 | 3.7% | 6.1%(-2.38)#764 | 5.3%(-1.57)#18,279 |
1
Common Questions
What are the Top Zip Codes with the Highest Percentage of Population Employed in Food Preparation & Serving in Lake Wales, FL?
Top Zip Codes with the Highest Percentage of Population Employed in Food Preparation & Serving in Lake Wales, FL are:
What zip code has the Highest Percentage of Population Employed in Food Preparation & Serving in Lake Wales, FL?
33859 has the Highest Percentage of Population Employed in Food Preparation & Serving in Lake Wales, FL with 7.2%.
What is the Percentage of Population Employed in Food Preparation & Serving in Lake Wales, FL?
Percentage of Population Employed in Food Preparation & Serving in Lake Wales is 5.7%.
What is the Percentage of Population Employed in Food Preparation & Serving in Florida?
Percentage of Population Employed in Food Preparation & Serving in Florida is 6.1%.
What is the Percentage of Population Employed in Food Preparation & Serving in the United States?
Percentage of Population Employed in Food Preparation & Serving in the United States is 5.3%.