Zip Codes with the Highest Percentage of Population Employed in Firefighting & Prevention in Jacksonville, FL

RELATED REPORTS & OPTIONS

Firefighting & Prevention
Population
Families and Households
Female Fertility
Female Fertility (Unmarried)
Race (Community Size)
Race (Percentage)
Ancestry (Community Size)
AfghanAfricanAlaskan AthabascanAlbanianAmericanApacheArabArgentineanArmenianAustralianAustrianBahamianBangladeshiBarbadianBasqueBelgianBelizeanBhutaneseBlackfeetBolivianBrazilianBritishBritish West IndianBulgarianBurmeseCajunCanadianCape VerdeanCelticCentral AmericanCentral American IndianCherokeeChickasawChileanChippewaChoctawColombianCosta RicanCreekCroatianCubanCypriotCzechCzechoslovakianDanishDominicanDutchEastern EuropeanEcuadorianEgyptianEnglishEstonianEthiopianEuropeanFilipinoFinnishFrenchFrench American IndianFrench CanadianGermanGerman RussianGhanaianGreekGuamanian / ChamorroGuatemalanGuyaneseHaitianHonduranHungarianIcelanderIndian (Asian)IndonesianIranianIraqiIrishIroquoisIsraeliItalianJamaicanJapaneseJordanianKenyanKoreanLaotianLatvianLebaneseLiberianLithuanianLumbeeMacedonianMalaysianMalteseMexicanMexican American IndianMoroccanNative HawaiianNavajoNew ZealanderNicaraguanNigerianNorthern EuropeanNorwegianOkinawanPakistaniPalestinianPanamanianPennsylvania GermanPeruvianPolishPortuguesePotawatomiPuerto RicanRomanianRussianSalvadoranSamoanScandinavianScotch-IrishScottishSeminoleSerbianSiouxSlavicSlovakSloveneSouth AfricanSouth AmericanSouth American IndianSpaniardSpanishSpanish American IndianSri LankanSubsaharan AfricanSudaneseSwedishSwissSyrianThaiTrinidadian and TobagonianTurkishU.S. Virgin IslanderUkrainianUruguayanVenezuelanVietnameseWelshWest IndianYugoslavian
Ancestry (Percentage)
AfghanAfricanAlaskan AthabascanAlbanianAmericanApacheArabArgentineanArmenianAustralianAustrianBahamianBangladeshiBarbadianBasqueBelgianBelizeanBhutaneseBlackfeetBolivianBrazilianBritishBritish West IndianBulgarianBurmeseCajunCanadianCape VerdeanCelticCentral AmericanCentral American IndianCherokeeChickasawChileanChippewaChoctawColombianCosta RicanCreekCroatianCubanCypriotCzechCzechoslovakianDanishDominicanDutchEastern EuropeanEcuadorianEgyptianEnglishEstonianEthiopianEuropeanFilipinoFinnishFrenchFrench American IndianFrench CanadianGermanGerman RussianGhanaianGreekGuamanian / ChamorroGuatemalanGuyaneseHaitianHonduranHungarianIcelanderIndian (Asian)IndonesianIranianIraqiIrishIroquoisIsraeliItalianJamaicanJapaneseJordanianKenyanKoreanLaotianLatvianLebaneseLiberianLithuanianLumbeeMacedonianMalaysianMalteseMexicanMexican American IndianMoroccanNative HawaiianNavajoNew ZealanderNicaraguanNigerianNorthern EuropeanNorwegianOkinawanPakistaniPalestinianPanamanianPennsylvania GermanPeruvianPolishPortuguesePotawatomiPuerto RicanRomanianRussianSalvadoranSamoanScandinavianScotch-IrishScottishSeminoleSerbianSiouxSlavicSlovakSloveneSouth AfricanSouth AmericanSouth American IndianSpaniardSpanishSpanish American IndianSri LankanSubsaharan AfricanSudaneseSwedishSwissSyrianThaiTrinidadian and TobagonianTurkishU.S. Virgin IslanderUkrainianUruguayanVenezuelanVietnameseWelshWest IndianYugoslavian
Immigrant Origin (Total)
AfghanistanAfricaAlbaniaArgentinaAsiaAustraliaAustriaBahamasBangladeshBarbadosBelarusBelgiumBelizeBoliviaBosnia and HerzegovinaBrazilBulgariaBurma / MyanmarCambodiaCanadaCaribbeanCentral AmericaChileChinaColombiaCosta RicaCroatiaCubaCzechoslovakiaDenmarkDominicaDominican RepublicEastern AfricaEastern AsiaEastern EuropeEcuadorEgyptEl SalvadorEnglandEthiopiaEuropeFranceGermanyGhanaGreeceGrenadaGuatemalaGuyanaHaitiHondurasHong KongHungaryIndiaIndonesiaIranIraqIrelandIsraelItalyJamaicaJapanJordanKenyaKoreaKuwaitLaosLatin AmericaLebanonLiberiaLithuaniaMalaysiaMexicoMiddle AfricaMoldovaMoroccoNepalNetherlandsNicaraguaNigeriaNorthern AfricaNorthern EuropeNorwayOceaniaPakistanPanamaPeruPhilippinesPolandPortugalRomaniaRussiaSaudi ArabiaScotlandSerbiaSingaporeSouth AfricaSouth AmericaSouth Central AsiaSouth Eastern AsiaSouthern EuropeSpainSudanSwedenSwitzerlandSyriaTaiwanThailandTrinidad and TobagoTurkeyUgandaUkraineUruguayUzbekistanVenezuelaVietnamWestern AfricaWestern AsiaWestern EuropeZimbabwe
Immigrant Origin (Percentage)
AfghanistanAfricaAlbaniaArgentinaAsiaAustraliaAustriaBahamasBangladeshBarbadosBelarusBelgiumBelizeBoliviaBosnia and HerzegovinaBrazilBulgariaBurma / MyanmarCambodiaCanadaCaribbeanCentral AmericaChileChinaColombiaCosta RicaCroatiaCubaCzechoslovakiaDenmarkDominicaDominican RepublicEastern AfricaEastern AsiaEastern EuropeEcuadorEgyptEl SalvadorEnglandEthiopiaEuropeFranceGermanyGhanaGreeceGrenadaGuatemalaGuyanaHaitiHondurasHong KongHungaryIndiaIndonesiaIranIraqIrelandIsraelItalyJamaicaJapanJordanKenyaKoreaKuwaitLaosLatin AmericaLebanonLiberiaLithuaniaMalaysiaMexicoMiddle AfricaMoldovaMoroccoNepalNetherlandsNicaraguaNigeriaNorthern AfricaNorthern EuropeNorwayOceaniaPakistanPanamaPeruPhilippinesPolandPortugalRomaniaRussiaSaudi ArabiaScotlandSerbiaSingaporeSouth AfricaSouth AmericaSouth Central AsiaSouth Eastern AsiaSouthern EuropeSpainSudanSwedenSwitzerlandSyriaTaiwanThailandTrinidad and TobagoTurkeyUgandaUkraineUruguayUzbekistanVenezuelaVietnamWestern AfricaWestern AsiaWestern EuropeZimbabwe
Income
Income (Families)
Income (Households)
Poverty
Poverty (Families)
Unemployment
Employment Occupations
Employment Industries
Employer Class
Commute Time
Commute Means
School Enrollment
Education by Degree Field
Occupancy
Finances
Physical Characteristics
Jacksonville
States
Florida Cities
Altamonte SpringsApopkaArcadiaBoca RatonBonita SpringsBoynton BeachBradentonBrandonBrooksvilleCape CoralCasselberryClearwaterClermontCocoaCoral SpringsCrestviewDade CityDavenportDaytona BeachDeerfield BeachDefuniak SpringsDelandDelray BeachDeltonaDunnellonEdgewaterEnglewoodEustisFort LauderdaleFort MyersFort PierceFort Walton BeachGainesvilleGulf BreezeHialeahHolidayHollywoodHomesteadHomosassaHudsonInvernessJacksonvilleJupiterKissimmeeLake CityLake WalesLake WorthLakelandLand O LakesLargoLeesburgLehigh AcresLive OakLongwoodLutzMariannaMelbourneMerritt IslandMiamiMiami BeachMiltonNaplesNew Port RicheyNew Smyrna BeachNorth Fort MyersNorth PortOcalaOkeechobeeOpa LockaOrange ParkOrlandoOrmond BeachOviedoPalm BayPalm Beach GardensPalm CoastPalm HarborPanama CityPanama City BeachPensacolaPinellas ParkPlant CityPompano BeachPort CharlottePort OrangePort Saint LuciePunta GordaQuincyRiverviewSaint AugustineSaint CloudSaint PetersburgSanfordSarasotaSebringSeminoleSpring HillStuartTallahasseeTampaTarpon SpringsThe VillagesTitusvilleValricoVeniceVero BeachWesley ChapelWest Palm BeachWinter HavenWinter ParkZephyrhills
Compare Zip Codes
Comparison Subject

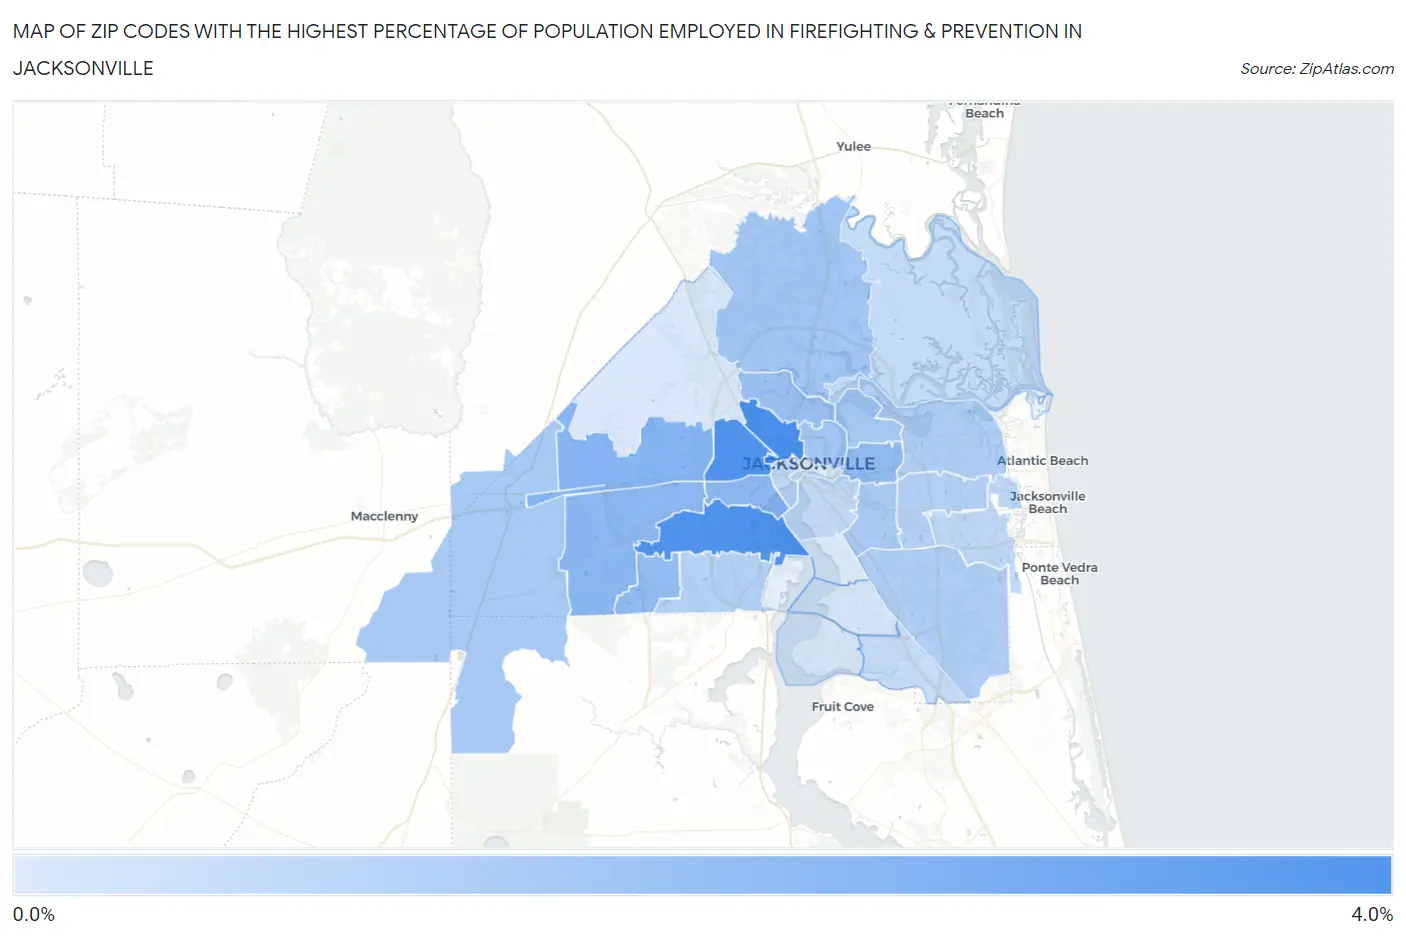
Map of Zip Codes with the Highest Percentage of Population Employed in Firefighting & Prevention in Jacksonville

0.0%
4.0%
Zip Codes with the Highest Percentage of Population Employed in Firefighting & Prevention in Jacksonville Map

Zip Codes with the Highest Percentage of Population Employed in Firefighting & Prevention in Jacksonville, FL

Zip Code % Employed vs State vs National
1.322093.5%1.4%(+2.10)#381.2%(+2.31)#1,722
2.322103.4%1.4%(+1.96)#451.2%(+2.18)#1,847
3.322543.3%1.4%(+1.93)#461.2%(+2.15)#1,874
4.322202.1%1.4%(+0.725)#1531.2%(+0.941)#4,077
5.322212.0%1.4%(+0.579)#1851.2%(+0.794)#4,589
6.322052.0%1.4%(+0.569)#1861.2%(+0.785)#4,622
7.322111.9%1.4%(+0.462)#2041.2%(+0.678)#5,074
8.322221.8%1.4%(+0.442)#2121.2%(+0.657)#5,167
9.322081.7%1.4%(+0.269)#2511.2%(+0.485)#5,993
10.322181.5%1.4%(+0.092)#3061.2%(+0.308)#7,014
11.322061.5%1.4%(+0.080)#3091.2%(+0.296)#7,099
12.322771.4%1.4%(+0.015)#3241.2%(+0.230)#7,532
13.322341.4%1.4%(-0.014)#3381.2%(+0.201)#7,733
14.322161.4%1.4%(-0.042)#3521.2%(+0.173)#7,911
15.322561.2%1.4%(-0.185)#4031.2%(+0.031)#9,008
16.322251.2%1.4%(-0.194)#4071.2%(+0.022)#9,083
17.322441.1%1.4%(-0.287)#4531.2%(-0.071)#9,965
18.322461.1%1.4%(-0.303)#4681.2%(-0.087)#10,119
19.322040.89%1.4%(-0.512)#5791.2%(-0.297)#12,272
20.322240.85%1.4%(-0.552)#5981.2%(-0.336)#12,671
21.322070.79%1.4%(-0.609)#6221.2%(-0.393)#13,306
22.322260.78%1.4%(-0.622)#6301.2%(-0.406)#13,437
23.322580.69%1.4%(-0.711)#6701.2%(-0.495)#14,449
24.322570.41%1.4%(-0.993)#7611.2%(-0.777)#17,555
25.322230.35%1.4%(-1.05)#7851.2%(-0.833)#18,196
26.322020.34%1.4%(-1.06)#7911.2%(-0.848)#18,383
27.322190.33%1.4%(-1.07)#7941.2%(-0.853)#18,428
28.322170.26%1.4%(-1.14)#8071.2%(-0.921)#19,111

Common Questions

What are the Top 10 Zip Codes with the Highest Percentage of Population Employed in Firefighting & Prevention in Jacksonville, FL?
Top 10 Zip Codes with the Highest Percentage of Population Employed in Firefighting & Prevention in Jacksonville, FL are:
#1
3.5%
#2
3.4%
#3
3.3%
#4
2.1%
#5
2.0%
#6
2.0%
#7
1.9%
#8
1.8%
#9
1.7%
#10
1.5%
What zip code has the Highest Percentage of Population Employed in Firefighting & Prevention in Jacksonville, FL?
32209 has the Highest Percentage of Population Employed in Firefighting & Prevention in Jacksonville, FL with 3.5%.
What is the Percentage of Population Employed in Firefighting & Prevention in Jacksonville, FL?
Percentage of Population Employed in Firefighting & Prevention in Jacksonville is 1.4%.
What is the Percentage of Population Employed in Firefighting & Prevention in Florida?
Percentage of Population Employed in Firefighting & Prevention in Florida is 1.4%.
What is the Percentage of Population Employed in Firefighting & Prevention in the United States?
Percentage of Population Employed in Firefighting & Prevention in the United States is 1.2%.