Zip Codes with the Highest Percentage of Population Employed in Food Preparation & Serving in Port Orange, FL
RELATED REPORTS & OPTIONS
Food Preparation & Serving
Port Orange
Compare Zip Codes
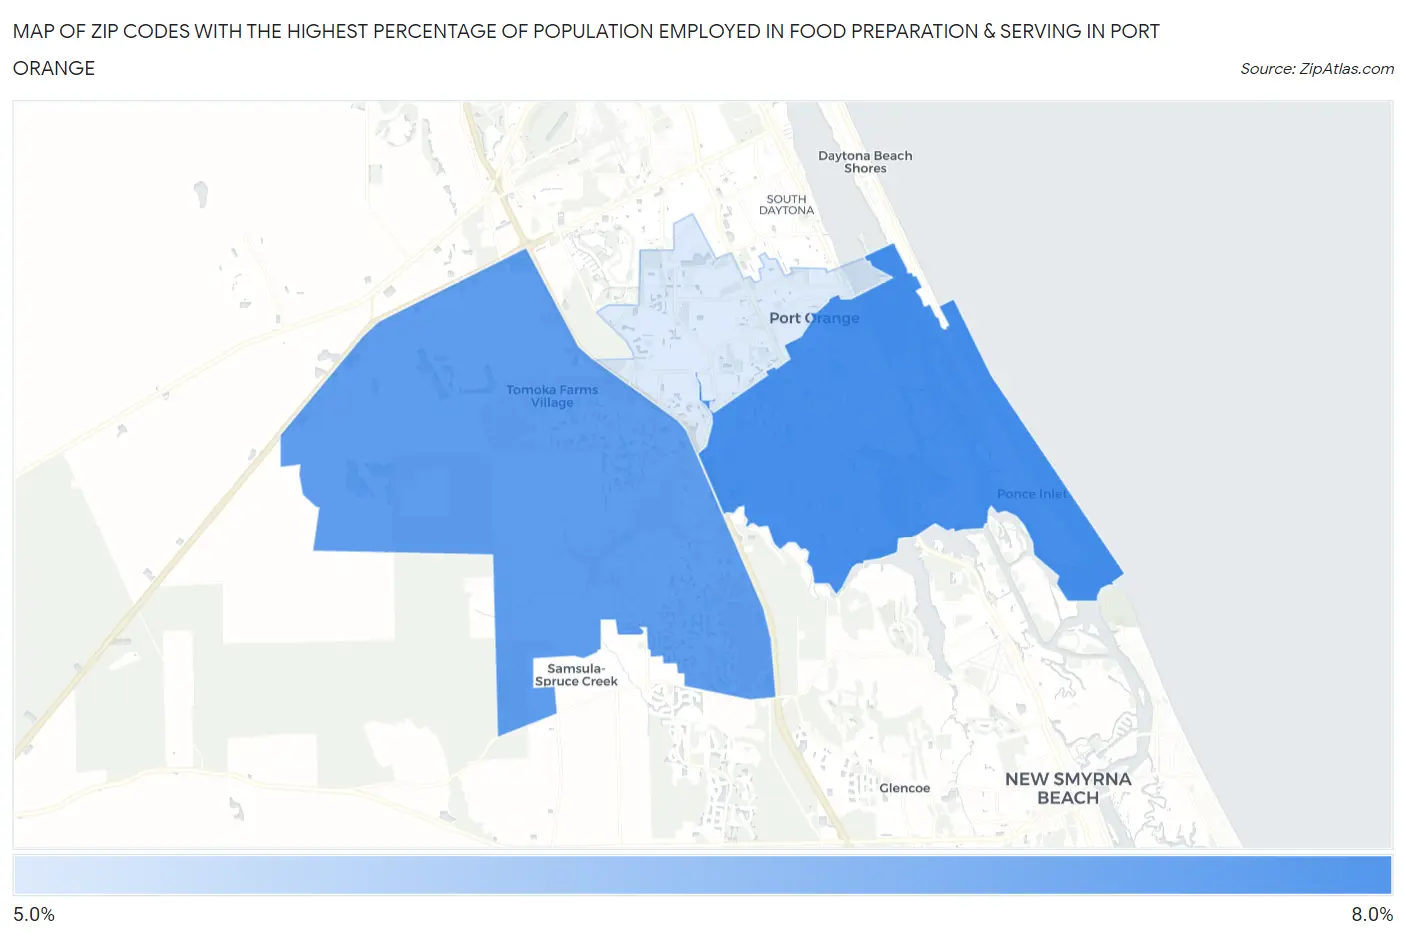
Map of Zip Codes with the Highest Percentage of Population Employed in Food Preparation & Serving in Port Orange
5.6%
7.6%
Zip Codes with the Highest Percentage of Population Employed in Food Preparation & Serving in Port Orange, FL
| Zip Code | % Employed | vs State | vs National | |
| 1. | 32127 | 7.6% | 6.1%(+1.54)#238 | 5.3%(+2.34)#5,336 |
| 2. | 32128 | 7.3% | 6.1%(+1.23)#281 | 5.3%(+2.03)#5,896 |
| 3. | 32129 | 5.6% | 6.1%(-0.495)#518 | 5.3%(+0.309)#10,718 |
1
Common Questions
What are the Top Zip Codes with the Highest Percentage of Population Employed in Food Preparation & Serving in Port Orange, FL?
Top Zip Codes with the Highest Percentage of Population Employed in Food Preparation & Serving in Port Orange, FL are:
What zip code has the Highest Percentage of Population Employed in Food Preparation & Serving in Port Orange, FL?
32127 has the Highest Percentage of Population Employed in Food Preparation & Serving in Port Orange, FL with 7.6%.
What is the Percentage of Population Employed in Food Preparation & Serving in Port Orange, FL?
Percentage of Population Employed in Food Preparation & Serving in Port Orange is 7.0%.
What is the Percentage of Population Employed in Food Preparation & Serving in Florida?
Percentage of Population Employed in Food Preparation & Serving in Florida is 6.1%.
What is the Percentage of Population Employed in Food Preparation & Serving in the United States?
Percentage of Population Employed in Food Preparation & Serving in the United States is 5.3%.