Crow vs Immigrants from Lithuania GED/Equivalency

COMPARE

Crow
Race
Ancestry
AfghanAfricanAlaska NativeAlaskan AthabascanAlbanianAleutAlsatianAmericanApacheArabArapahoArgentineanArmenianAssyrian/Chaldean/SyriacAustralianAustrianBahamianBangladeshiBarbadianBasqueBelgianBelizeanBermudanBhutaneseBlackfeetBolivianBrazilianBritishBritish West IndianBulgarianBurmeseCajunCambodianCanadianCape VerdeanCarpatho RusynCelticCentral AmericanCentral American IndianCherokeeCheyenneChickasawChileanChineseChippewaChoctawColombianColvilleComancheCosta RicanCreeCreekCroatianCrowCubanCypriotCzechCzechoslovakianDanishDelawareDominicanDutchDutch West IndianEastern EuropeanEcuadorianEgyptianEnglishEstonianEthiopianEuropeanFijianFilipinoFinnishFrenchFrench American IndianFrench CanadianGermanGerman RussianGhanaianGreekGuamanian/ChamorroGuatemalanGuyaneseHaitianHmongHonduranHopiHoumaHungarianIcelanderIndian (Asian)IndonesianInupiatIranianIraqiIrishIroquoisIsraeliItalianJamaicanJapaneseJordanianKenyanKiowaKoreanLaotianLatvianLebaneseLiberianLithuanianLumbeeLuxembourgerMacedonianMalaysianMalteseMarshalleseMenomineeMexicanMexican American IndianMongolianMoroccanNative HawaiianNavajoNepaleseNew ZealanderNicaraguanNigerianNorthern EuropeanNorwegianOkinawanOsageOttawaPaiutePakistaniPalestinianPanamanianParaguayanPennsylvania GermanPeruvianPimaPolishPortuguesePotawatomiPuebloPuerto RicanPuget Sound SalishRomanianRussianSalvadoranSamoanScandinavianScotch-IrishScottishSeminoleSenegaleseSerbianShoshoneSierra LeoneanSiouxSlavicSlovakSloveneSomaliSouth AfricanSouth AmericanSouth American IndianSoviet UnionSpaniardSpanishSpanish AmericanSpanish American IndianSri LankanSubsaharan AfricanSudaneseSwedishSwissSyrianTaiwaneseThaiTlingit-HaidaTohono O'OdhamTonganTrinidadian and TobagonianTsimshianTurkishU.S. Virgin IslanderUgandanUkrainianUruguayanUteVenezuelanVietnameseWelshWest IndianYakamaYaquiYugoslavianYumanYup'ikZimbabwean
Immigration
NonimmigrantsImmigrantsAfghanistanAfricaAlbaniaArgentinaArmeniaAsiaAustraliaAustriaBahamasBangladeshBarbadosBelarusBelgiumBelizeBoliviaBosnia and HerzegovinaBrazilBulgariaBurma/MyanmarCabo VerdeCambodiaCameroonCanadaCaribbeanCentral AmericaChileChinaColombiaCongoCosta RicaCroatiaCubaCzechoslovakiaDenmarkDominicaDominican RepublicEastern AfricaEastern AsiaEastern EuropeEcuadorEgyptEl SalvadorEnglandEritreaEthiopiaEuropeFijiFranceGermanyGhanaGreeceGrenadaGuatemalaGuyanaHaitiHondurasHong KongHungaryIndiaIndonesiaIranIraqIrelandIsraelItalyJamaicaJapanJordanKazakhstanKenyaKoreaKuwaitLaosLatin AmericaLatviaLebanonLiberiaMalaysiaMexicoMicronesiaMiddle AfricaMoldovaMoroccoNepalNetherlandsNicaraguaNigeriaNorth AmericaNorth MacedoniaNorthern AfricaNorthern EuropeNorwayOceaniaPakistanPanamaPeruPhilippinesPolandPortugalRomaniaRussiaSaudi ArabiaScotlandSenegalSerbiaSierra LeoneSingaporeSomaliaSouth AfricaSouth AmericaSouth Central AsiaSouth Eastern AsiaSouthern EuropeSpainSri LankaSt. Vincent and the GrenadinesSudanSwedenSwitzerlandSyriaTaiwanThailandTrinidad and TobagoTurkeyUgandaUkraineUruguayUzbekistanVenezuelaVietnamWest IndiesWestern AfricaWestern AsiaWestern EuropeYemenZaireZimbabweAzores
Immigrants from Lithuania
Race
Ancestry
AfghanAfricanAlaska NativeAlaskan AthabascanAlbanianAleutAlsatianAmericanApacheArabArapahoArgentineanArmenianAssyrian/Chaldean/SyriacAustralianAustrianBahamianBangladeshiBarbadianBasqueBelgianBelizeanBermudanBhutaneseBlackfeetBolivianBrazilianBritishBritish West IndianBulgarianBurmeseCajunCambodianCanadianCape VerdeanCarpatho RusynCelticCentral AmericanCentral American IndianCherokeeCheyenneChickasawChileanChineseChippewaChoctawColombianColvilleComancheCosta RicanCreeCreekCroatianCubanCypriotCzechCzechoslovakianDanishDelawareDominicanDutchDutch West IndianEastern EuropeanEcuadorianEgyptianEnglishEstonianEthiopianEuropeanFijianFilipinoFinnishFrenchFrench American IndianFrench CanadianGermanGerman RussianGhanaianGreekGuamanian/ChamorroGuatemalanGuyaneseHaitianHmongHonduranHopiHoumaHungarianIcelanderIndian (Asian)IndonesianInupiatIranianIraqiIrishIroquoisIsraeliItalianJamaicanJapaneseJordanianKenyanKiowaKoreanLaotianLatvianLebaneseLiberianLithuanianLumbeeLuxembourgerMacedonianMalaysianMalteseMarshalleseMenomineeMexicanMexican American IndianMongolianMoroccanNative HawaiianNavajoNepaleseNew ZealanderNicaraguanNigerianNorthern EuropeanNorwegianOkinawanOsageOttawaPaiutePakistaniPalestinianPanamanianParaguayanPennsylvania GermanPeruvianPimaPolishPortuguesePotawatomiPuebloPuerto RicanPuget Sound SalishRomanianRussianSalvadoranSamoanScandinavianScotch-IrishScottishSeminoleSenegaleseSerbianShoshoneSierra LeoneanSiouxSlavicSlovakSloveneSomaliSouth AfricanSouth AmericanSouth American IndianSoviet UnionSpaniardSpanishSpanish AmericanSpanish American IndianSri LankanSubsaharan AfricanSudaneseSwedishSwissSyrianTaiwaneseThaiTlingit-HaidaTohono O'OdhamTonganTrinidadian and TobagonianTsimshianTurkishU.S. Virgin IslanderUgandanUkrainianUruguayanUteVenezuelanVietnameseWelshWest IndianYakamaYaquiYugoslavianYumanYup'ikZimbabwean
Immigration
NonimmigrantsImmigrantsAfghanistanAfricaAlbaniaArgentinaArmeniaAsiaAustraliaAustriaBahamasBangladeshBarbadosBelarusBelgiumBelizeBoliviaBosnia and HerzegovinaBrazilBulgariaBurma/MyanmarCabo VerdeCambodiaCameroonCanadaCaribbeanCentral AmericaChileChinaColombiaCongoCosta RicaCroatiaCubaCzechoslovakiaDenmarkDominicaDominican RepublicEastern AfricaEastern AsiaEastern EuropeEcuadorEgyptEl SalvadorEnglandEritreaEthiopiaEuropeFijiFranceGermanyGhanaGreeceGrenadaGuatemalaGuyanaHaitiHondurasHong KongHungaryIndiaIndonesiaIranIraqIrelandIsraelItalyJamaicaJapanJordanKazakhstanKenyaKoreaKuwaitLaosLatin AmericaLatviaLebanonLiberiaLithuaniaMalaysiaMexicoMicronesiaMiddle AfricaMoldovaMoroccoNepalNetherlandsNicaraguaNigeriaNorth AmericaNorth MacedoniaNorthern AfricaNorthern EuropeNorwayOceaniaPakistanPanamaPeruPhilippinesPolandPortugalRomaniaRussiaSaudi ArabiaScotlandSenegalSerbiaSierra LeoneSingaporeSomaliaSouth AfricaSouth AmericaSouth Central AsiaSouth Eastern AsiaSouthern EuropeSpainSri LankaSt. Vincent and the GrenadinesSudanSwedenSwitzerlandSyriaTaiwanThailandTrinidad and TobagoTurkeyUgandaUkraineUruguayUzbekistanVenezuelaVietnamWest IndiesWestern AfricaWestern AsiaWestern EuropeYemenZaireZimbabweAzores
GED/Equivalency
Income
Poverty
Unemployment
Labor Participation
Family Structure
Vehicle Availability
Education Level
Disability

GED/Equivalency Comparison

Crow

Immigrants from Lithuania

Tragic
Exceptional
83.8%
GED/EQUIVALENCY
1.1/ 100
METRIC RATING
249th/ 347
METRIC RANK
88.6%
GED/EQUIVALENCY
99.8/ 100
METRIC RATING
27th/ 347
METRIC RANK

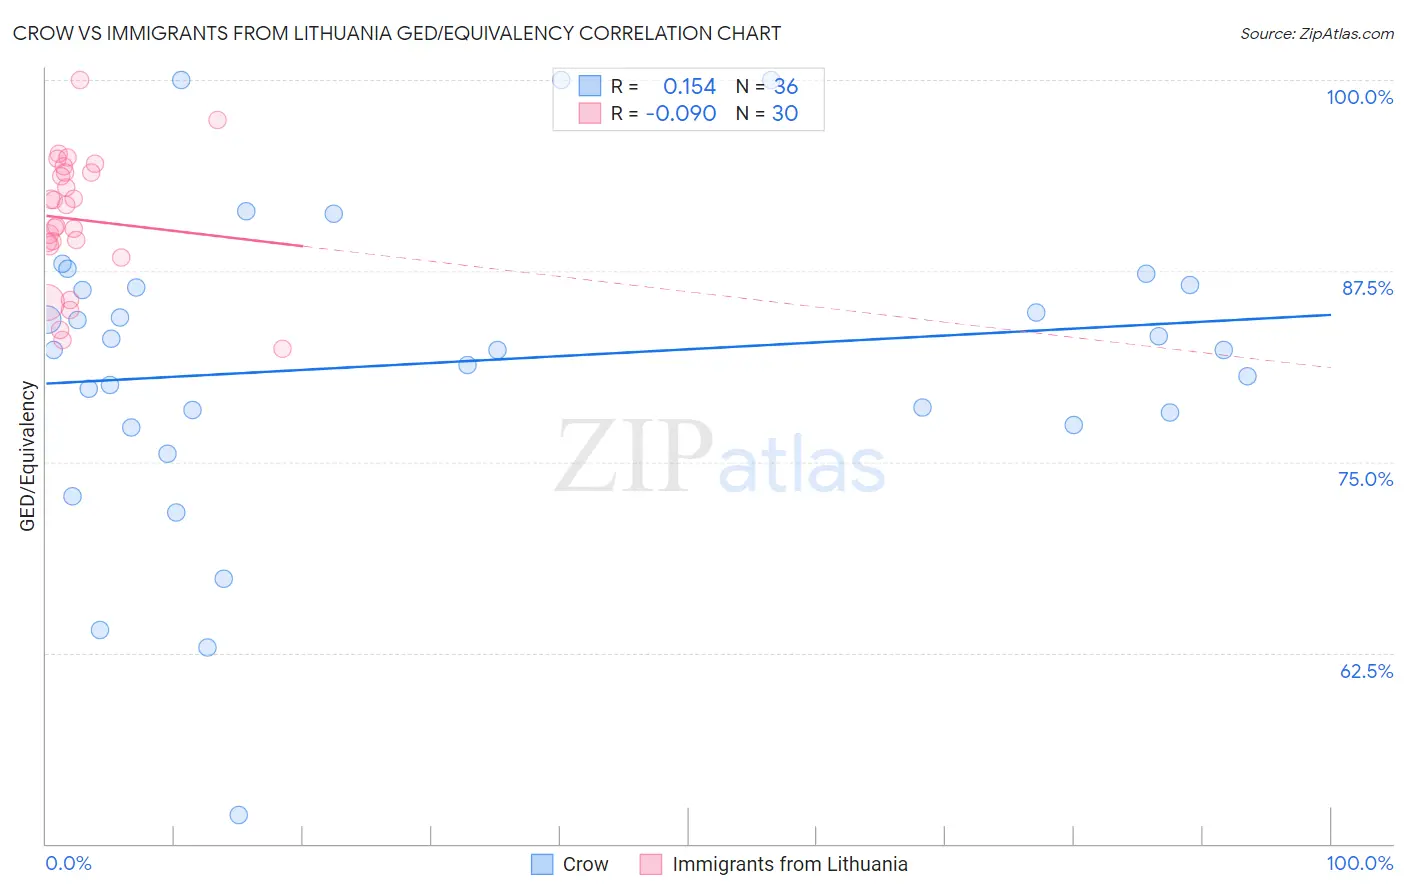
Crow vs Immigrants from Lithuania GED/Equivalency Correlation Chart

The statistical analysis conducted on geographies consisting of 59,209,980 people shows a poor positive correlation between the proportion of Crow and percentage of population with at least ged/equivalency education in the United States with a correlation coefficient (R) of 0.154 and weighted average of 83.8%. Similarly, the statistical analysis conducted on geographies consisting of 117,724,932 people shows a slight negative correlation between the proportion of Immigrants from Lithuania and percentage of population with at least ged/equivalency education in the United States with a correlation coefficient (R) of -0.090 and weighted average of 88.6%, a difference of 5.7%.
Crow vs Immigrants from Lithuania GED/Equivalency

GED/Equivalency Correlation Summary

MeasurementCrowImmigrants from Lithuania
Minimum51.9%82.4%
Maximum100.0%100.0%
Range48.1%17.6%
Mean81.5%90.9%
Median82.3%91.1%
Interquartile 25% (IQ1)77.9%89.2%
Interquartile 75% (IQ3)86.5%94.0%
Interquartile Range (IQR)8.6%4.8%
Standard Deviation (Sample)9.9%4.3%
Standard Deviation (Population)9.8%4.2%

Similar Demographics by GED/Equivalency

Demographics Similar to Crow by GED/Equivalency

In terms of ged/equivalency, the demographic groups most similar to Crow are Blackfeet (83.8%, a difference of 0.010%), Immigrants from Western Africa (83.8%, a difference of 0.020%), Shoshone (83.7%, a difference of 0.020%), Chickasaw (83.8%, a difference of 0.050%), and Immigrants from Senegal (83.8%, a difference of 0.080%).
DemographicsRating | RankGED/Equivalency
Sri Lankans
1.9
/100
|
#242
Tragic
84.0%
Cherokee
1.3
/100
|
#243
Tragic
83.9%
Immigrants | Ghana
1.3
/100
|
#244
Tragic
83.9%
Immigrants | Senegal
1.2
/100
|
#245
Tragic
83.8%
Chickasaw
1.2
/100
|
#246
Tragic
83.8%
Immigrants | Western Africa
1.1
/100
|
#247
Tragic
83.8%
Blackfeet
1.1
/100
|
#248
Tragic
83.8%
Crow
1.1
/100
|
#249
Tragic
83.8%
Shoshone
1.0
/100
|
#250
Tragic
83.7%
Spanish Americans
0.8
/100
|
#251
Tragic
83.6%
Bahamians
0.8
/100
|
#252
Tragic
83.6%
Comanche
0.7
/100
|
#253
Tragic
83.6%
Creek
0.7
/100
|
#254
Tragic
83.6%
Colville
0.5
/100
|
#255
Tragic
83.4%
Africans
0.5
/100
|
#256
Tragic
83.4%

Demographics Similar to Immigrants from Lithuania by GED/Equivalency

In terms of ged/equivalency, the demographic groups most similar to Immigrants from Lithuania are Immigrants from Australia (88.6%, a difference of 0.030%), Russian (88.6%, a difference of 0.040%), Slovak (88.6%, a difference of 0.040%), Estonian (88.6%, a difference of 0.040%), and Immigrants from Northern Europe (88.5%, a difference of 0.040%).
DemographicsRating | RankGED/Equivalency
Maltese
99.9
/100
|
#20
Exceptional
88.6%
Luxembourgers
99.8
/100
|
#21
Exceptional
88.6%
Immigrants | Ireland
99.8
/100
|
#22
Exceptional
88.6%
Russians
99.8
/100
|
#23
Exceptional
88.6%
Slovaks
99.8
/100
|
#24
Exceptional
88.6%
Estonians
99.8
/100
|
#25
Exceptional
88.6%
Immigrants | Australia
99.8
/100
|
#26
Exceptional
88.6%
Immigrants | Lithuania
99.8
/100
|
#27
Exceptional
88.6%
Immigrants | Northern Europe
99.8
/100
|
#28
Exceptional
88.5%
Poles
99.8
/100
|
#29
Exceptional
88.5%
Turks
99.8
/100
|
#30
Exceptional
88.5%
Bhutanese
99.8
/100
|
#31
Exceptional
88.4%
Danes
99.8
/100
|
#32
Exceptional
88.4%
Immigrants | Sweden
99.7
/100
|
#33
Exceptional
88.4%
Immigrants | Japan
99.7
/100
|
#34
Exceptional
88.4%