Zip Codes with the Highest Percentage of Population Taking Taxi / Cab to Work in Westerville, OH
RELATED REPORTS & OPTIONS
Select to Compare
Select to Compare
Compare Zip Codes
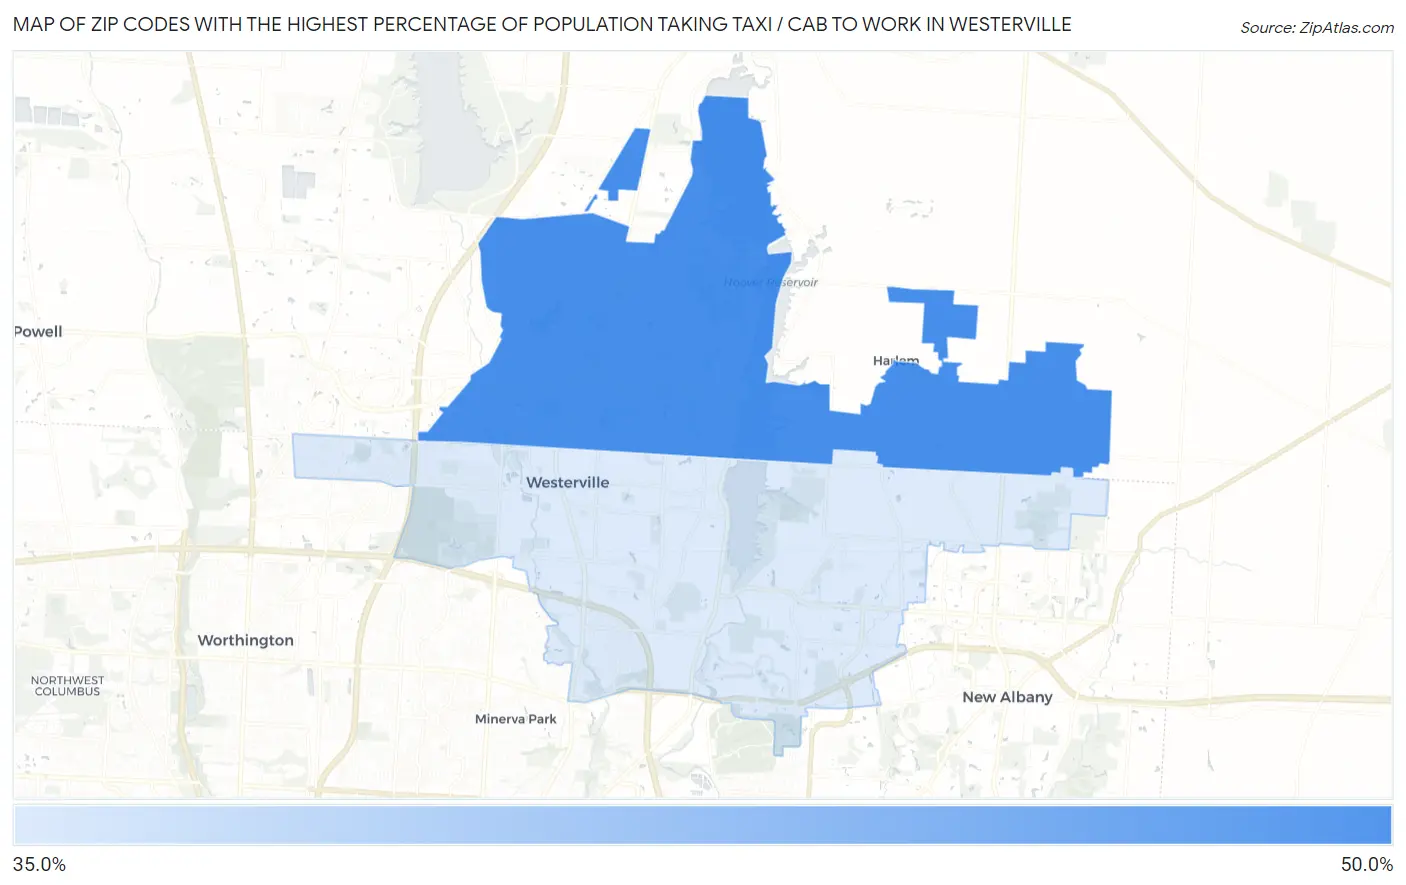
Map of Zip Codes with the Highest Percentage of Population Taking Taxi / Cab to Work in Westerville
29.2%
29.2%
Zip Codes with the Highest Percentage of Population Taking Taxi / Cab to Work in Westerville, OH
| Zip Code | % Take Taxi / Cab | vs State | vs National | |
| 1. | 43081 | 29.2% | 37.6%(-8.40)#372 | 38.2%(-9.00)#11,202 |
1
Common Questions
What are the Top Zip Codes with the Highest Percentage of Population Taking Taxi / Cab to Work in Westerville, OH?
Top Zip Codes with the Highest Percentage of Population Taking Taxi / Cab to Work in Westerville, OH are:
What zip code has the Highest Percentage of Population Taking Taxi / Cab to Work in Westerville, OH?
43081 has the Highest Percentage of Population Taking Taxi / Cab to Work in Westerville, OH with 29.2%.
What is the Percentage of Population Taking Taxi / Cab to Work in Westerville, OH?
Percentage of Population Taking Taxi / Cab to Work in Westerville is 34.5%.
What is the Percentage of Population Taking Taxi / Cab to Work in Ohio?
Percentage of Population Taking Taxi / Cab to Work in Ohio is 37.6%.
What is the Percentage of Population Taking Taxi / Cab to Work in the United States?
Percentage of Population Taking Taxi / Cab to Work in the United States is 38.2%.