Zip Codes with the Highest Percentage of Population Employed in Legal Services & Support in Quincy, MA
RELATED REPORTS & OPTIONS
Legal Services & Support
Quincy
Compare Zip Codes
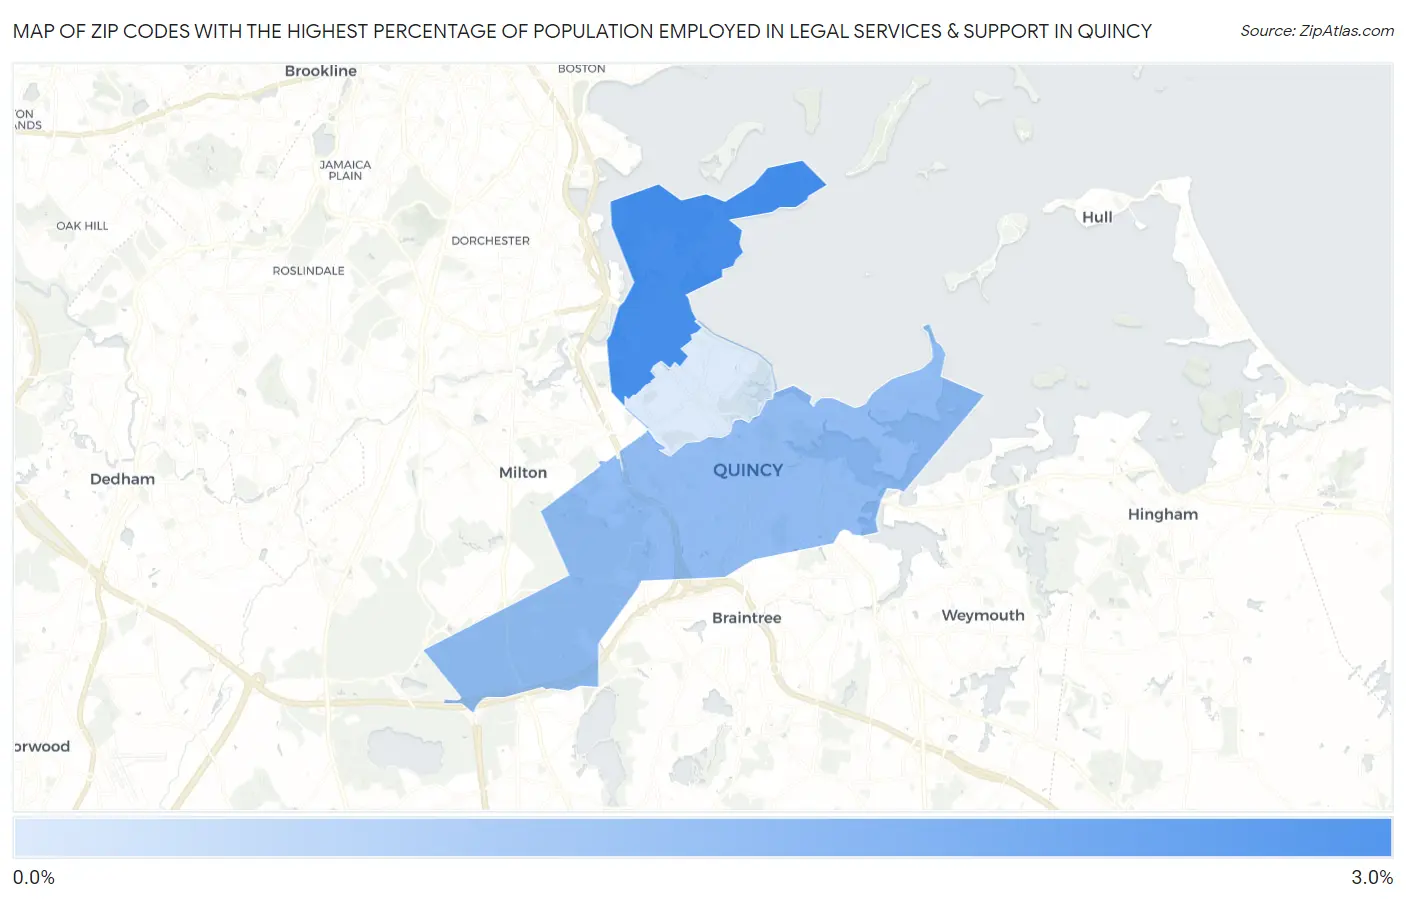
Map of Zip Codes with the Highest Percentage of Population Employed in Legal Services & Support in Quincy
0.99%
2.6%
Zip Codes with the Highest Percentage of Population Employed in Legal Services & Support in Quincy, MA
| Zip Code | % Employed | vs State | vs National | |
| 1. | 02171 | 2.6% | 1.5%(+1.16)#82 | 1.2%(+1.46)#2,272 |
| 2. | 02169 | 1.8% | 1.5%(+0.351)#145 | 1.2%(+0.656)#3,892 |
| 3. | 02170 | 0.99% | 1.5%(-0.496)#260 | 1.2%(-0.191)#7,876 |
1
Common Questions
What are the Top Zip Codes with the Highest Percentage of Population Employed in Legal Services & Support in Quincy, MA?
Top Zip Codes with the Highest Percentage of Population Employed in Legal Services & Support in Quincy, MA are:
What zip code has the Highest Percentage of Population Employed in Legal Services & Support in Quincy, MA?
02171 has the Highest Percentage of Population Employed in Legal Services & Support in Quincy, MA with 2.6%.
What is the Percentage of Population Employed in Legal Services & Support in Quincy, MA?
Percentage of Population Employed in Legal Services & Support in Quincy is 1.8%.
What is the Percentage of Population Employed in Legal Services & Support in Massachusetts?
Percentage of Population Employed in Legal Services & Support in Massachusetts is 1.5%.
What is the Percentage of Population Employed in Legal Services & Support in the United States?
Percentage of Population Employed in Legal Services & Support in the United States is 1.2%.