Zip Codes with the Highest Percentage of Population Taking Taxi / Cab to Work in Kansas City, KS
RELATED REPORTS & OPTIONS
Taxi / Cab
Kansas City
Compare Zip Codes
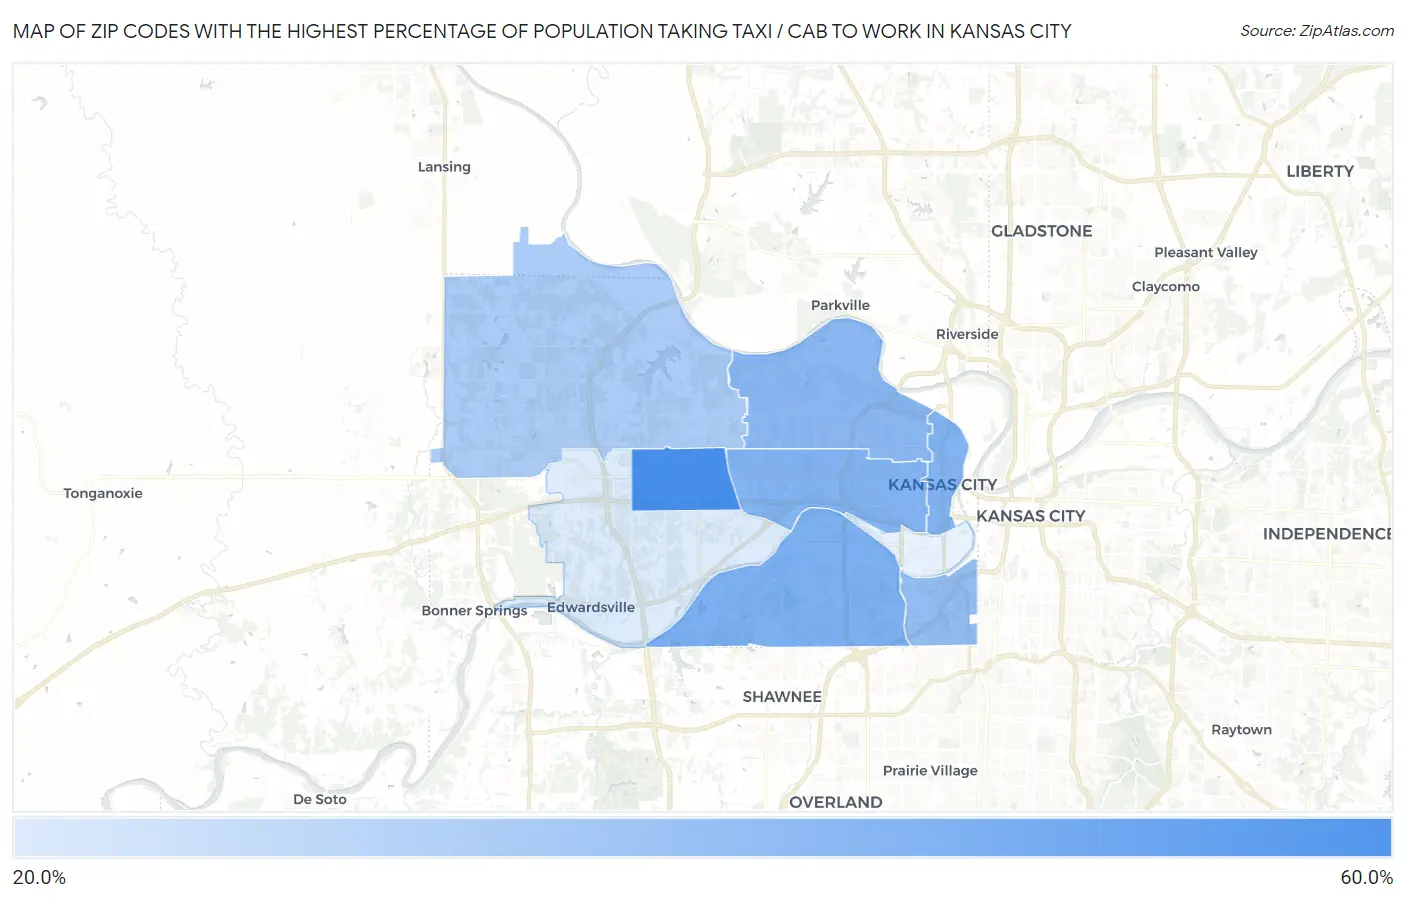
Map of Zip Codes with the Highest Percentage of Population Taking Taxi / Cab to Work in Kansas City
27.9%
55.0%
Zip Codes with the Highest Percentage of Population Taking Taxi / Cab to Work in Kansas City, KS
| Zip Code | % Take Taxi / Cab | vs State | vs National | |
| 1. | 66112 | 55.0% | 39.2%(+15.8)#34 | 38.2%(+16.8)#1,608 |
| 2. | 66106 | 44.9% | 39.2%(+5.70)#75 | 38.2%(+6.70)#4,688 |
| 3. | 66102 | 43.6% | 39.2%(+4.40)#77 | 38.2%(+5.40)#5,124 |
| 4. | 66101 | 43.4% | 39.2%(+4.20)#79 | 38.2%(+5.20)#5,239 |
| 5. | 66104 | 42.1% | 39.2%(+2.90)#83 | 38.2%(+3.90)#5,689 |
| 6. | 66103 | 40.5% | 39.2%(+1.30)#91 | 38.2%(+2.30)#6,385 |
| 7. | 66109 | 36.6% | 39.2%(-2.60)#115 | 38.2%(-1.60)#8,129 |
| 8. | 66111 | 27.9% | 39.2%(-11.3)#148 | 38.2%(-10.3)#11,585 |
1
Common Questions
What are the Top 5 Zip Codes with the Highest Percentage of Population Taking Taxi / Cab to Work in Kansas City, KS?
Top 5 Zip Codes with the Highest Percentage of Population Taking Taxi / Cab to Work in Kansas City, KS are:
What zip code has the Highest Percentage of Population Taking Taxi / Cab to Work in Kansas City, KS?
66112 has the Highest Percentage of Population Taking Taxi / Cab to Work in Kansas City, KS with 55.0%.
What is the Percentage of Population Taking Taxi / Cab to Work in Kansas City, KS?
Percentage of Population Taking Taxi / Cab to Work in Kansas City is 43.2%.
What is the Percentage of Population Taking Taxi / Cab to Work in Kansas?
Percentage of Population Taking Taxi / Cab to Work in Kansas is 39.2%.
What is the Percentage of Population Taking Taxi / Cab to Work in the United States?
Percentage of Population Taking Taxi / Cab to Work in the United States is 38.2%.