Zip Codes with the Highest Percentage of Immigrants from Asia in Kansas City, KS
RELATED REPORTS & OPTIONS
Asia
Kansas City
Compare Zip Codes
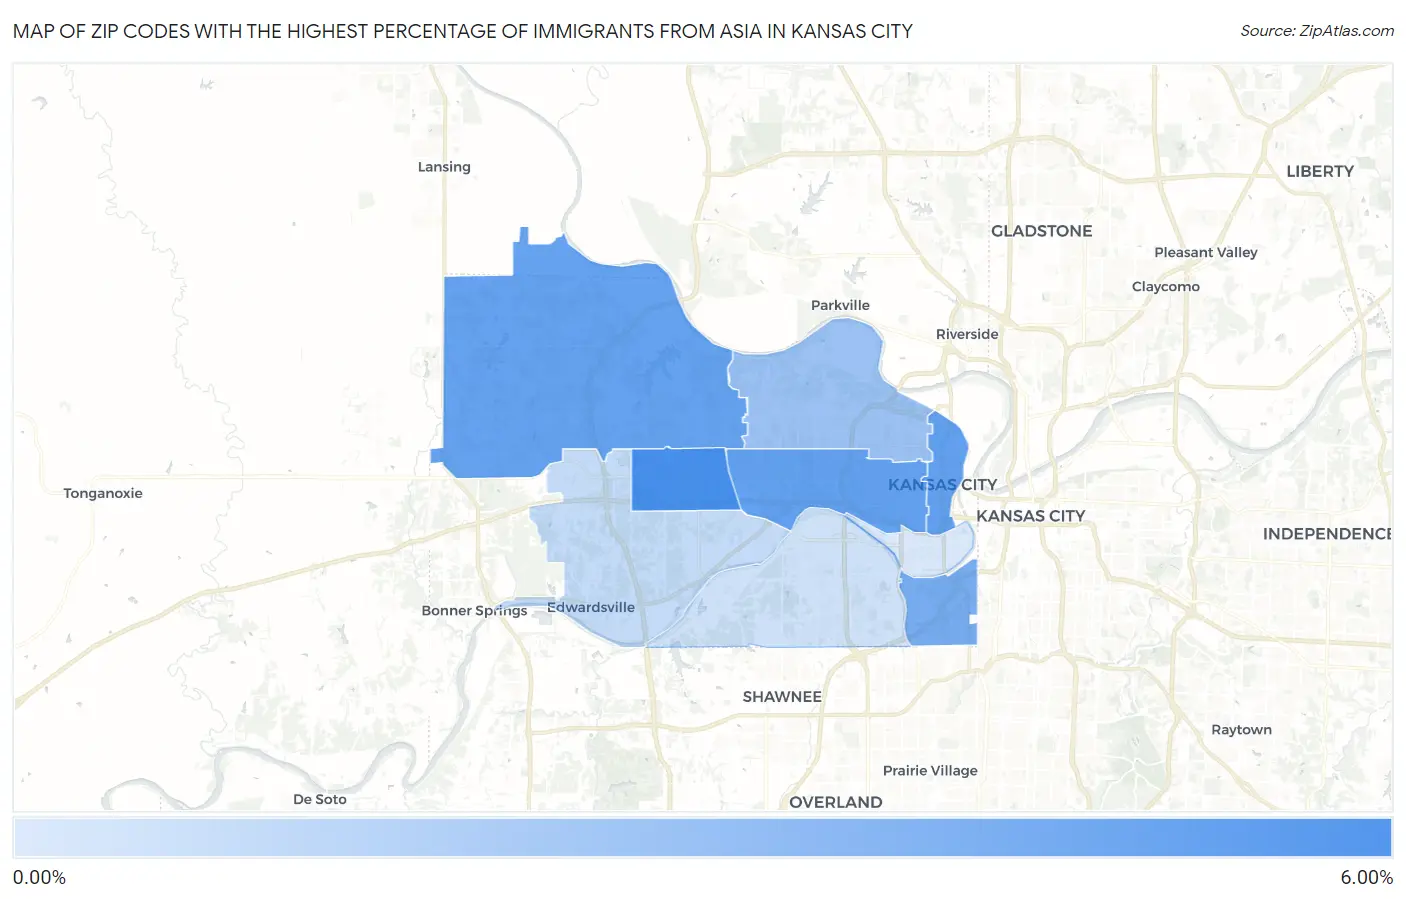
Map of Zip Codes with the Highest Percentage of Immigrants from Asia in Kansas City
0.18%
5.51%
Zip Codes with the Highest Percentage of Immigrants from Asia in Kansas City, KS
| Zip Code | Asia | vs State | vs National | |
| 1. | 66112 | 5.51% | 2.24%(+3.28)#23 | 4.26%(+1.25)#2,698 |
| 2. | 66101 | 4.49% | 2.24%(+2.25)#30 | 4.26%(+0.232)#3,361 |
| 3. | 66102 | 4.48% | 2.24%(+2.25)#31 | 4.26%(+0.224)#3,363 |
| 4. | 66109 | 4.40% | 2.24%(+2.16)#34 | 4.26%(+0.136)#3,426 |
| 5. | 66103 | 3.74% | 2.24%(+1.50)#39 | 4.26%(-0.524)#4,036 |
| 6. | 66104 | 2.39% | 2.24%(+0.155)#67 | 4.26%(-1.87)#5,940 |
| 7. | 66111 | 0.89% | 2.24%(-1.35)#159 | 4.26%(-3.37)#10,939 |
| 8. | 66106 | 0.52% | 2.24%(-1.71)#198 | 4.26%(-3.74)#13,629 |
| 9. | 66105 | 0.18% | 2.24%(-2.06)#268 | 4.26%(-4.08)#17,340 |
1
Common Questions
What are the Top 5 Zip Codes with the Highest Percentage of Immigrants from Asia in Kansas City, KS?
Top 5 Zip Codes with the Highest Percentage of Immigrants from Asia in Kansas City, KS are:
What zip code has the Highest Percentage of Immigrants from Asia in Kansas City, KS?
66112 has the Highest Percentage of Immigrants from Asia in Kansas City, KS with 5.51%.
What is the Percentage of Immigrants from Asia in Kansas City, KS?
Percentage of Immigrants from Asia in Kansas City is 3.32%.
What is the Percentage of Immigrants from Asia in Kansas?
Percentage of Immigrants from Asia in Kansas is 2.24%.
What is the Percentage of Immigrants from Asia in the United States?
Percentage of Immigrants from Asia in the United States is 4.26%.