Zip Codes with the Highest Percentage of Population with a Degree in Science and Engineering in Homestead, FL

RELATED REPORTS & OPTIONS

Science and Engineering
Population
Families and Households
Female Fertility
Female Fertility (Unmarried)
Race (Community Size)
Race (Percentage)
Ancestry (Community Size)
AfricanAmericanArabArgentineanBahamianBelizeanBhutaneseBlackfeetBolivianBrazilianBritishBritish West IndianBulgarianBurmeseCanadianCape VerdeanCentral AmericanCentral American IndianCherokeeChileanColombianCosta RicanCubanCzechDominicanDutchEastern EuropeanEcuadorianEnglishEuropeanFinnishFrenchFrench CanadianGermanGreekGuatemalanGuyaneseHaitianHonduranHungarianIndian (Asian)IrishItalianJamaicanJapaneseKoreanLebaneseLithuanianMalaysianMexicanMexican American IndianNicaraguanNigerianNorthern EuropeanNorwegianPanamanianPeruvianPolishPortuguesePuerto RicanRussianSalvadoranScandinavianScotch-IrishScottishSlavicSouth AmericanSouth American IndianSpaniardSpanishSri LankanSubsaharan AfricanSwedishSyrianThaiTrinidadian and TobagonianTurkishU.S. Virgin IslanderUruguayanVenezuelanVietnameseWelshWest Indian
Ancestry (Percentage)
AfricanAmericanArabArgentineanBahamianBelizeanBhutaneseBlackfeetBolivianBrazilianBritishBritish West IndianBulgarianBurmeseCanadianCape VerdeanCentral AmericanCentral American IndianCherokeeChileanColombianCosta RicanCubanCzechDominicanDutchEastern EuropeanEcuadorianEnglishEuropeanFinnishFrenchFrench CanadianGermanGreekGuatemalanGuyaneseHaitianHonduranHungarianIndian (Asian)IrishItalianJamaicanJapaneseKoreanLebaneseLithuanianMalaysianMexicanMexican American IndianNicaraguanNigerianNorthern EuropeanNorwegianPanamanianPeruvianPolishPortuguesePuerto RicanRussianSalvadoranScandinavianScotch-IrishScottishSlavicSouth AmericanSouth American IndianSpaniardSpanishSri LankanSubsaharan AfricanSwedishSyrianThaiTrinidadian and TobagonianTurkishU.S. Virgin IslanderUruguayanVenezuelanVietnameseWelshWest Indian
Immigrant Origin (Total)
Immigrant Origin (Percentage)
Income
Income (Families)
Income (Households)
Poverty
Poverty (Families)
Unemployment
Employment Occupations
Employment Industries
Employer Class
Commute Time
Commute Means
School Enrollment
Education by Degree Field
Occupancy
Finances
Physical Characteristics
Homestead
States
Florida Cities
Altamonte SpringsApopkaArcadiaBoca RatonBonita SpringsBoynton BeachBradentonBrandonBrooksvilleCape CoralCasselberryClearwaterClermontCocoaCoral SpringsCrestviewCrystal RiverDade CityDavenportDaytona BeachDeerfield BeachDefuniak SpringsDelandDelray BeachDeltonaDunnellonEdgewaterEnglewoodEustisFort LauderdaleFort MyersFort PierceFort Walton BeachGainesvilleGulf BreezeHialeahHolidayHollywoodHomesteadHomosassaHudsonInvernessJacksonvilleJupiterKissimmeeLake CityLake WalesLake WorthLakelandLand O LakesLargoLeesburgLehigh AcresLive OakLongwoodLutzMariannaMelbourneMerritt IslandMiamiMiami BeachMiltonNaplesNew Port RicheyNew Smyrna BeachNorth Fort MyersNorth PortOcalaOkeechobeeOpa LockaOrange ParkOrlandoOrmond BeachOviedoPalm BayPalm Beach GardensPalm CoastPalm HarborPanama CityPanama City BeachPensacolaPerryPinellas ParkPlant CityPompano BeachPort CharlottePort OrangePort Saint LuciePunta GordaRiverviewSaint AugustineSaint CloudSaint PetersburgSanfordSarasotaSebastianSebringSeminoleSpring HillStuartTallahasseeTampaTarpon SpringsThe VillagesTitusvilleValricoVeniceVero BeachWesley ChapelWest Palm BeachWewahitchkaWinter HavenWinter ParkZephyrhills
Compare Zip Codes
Comparison Subject

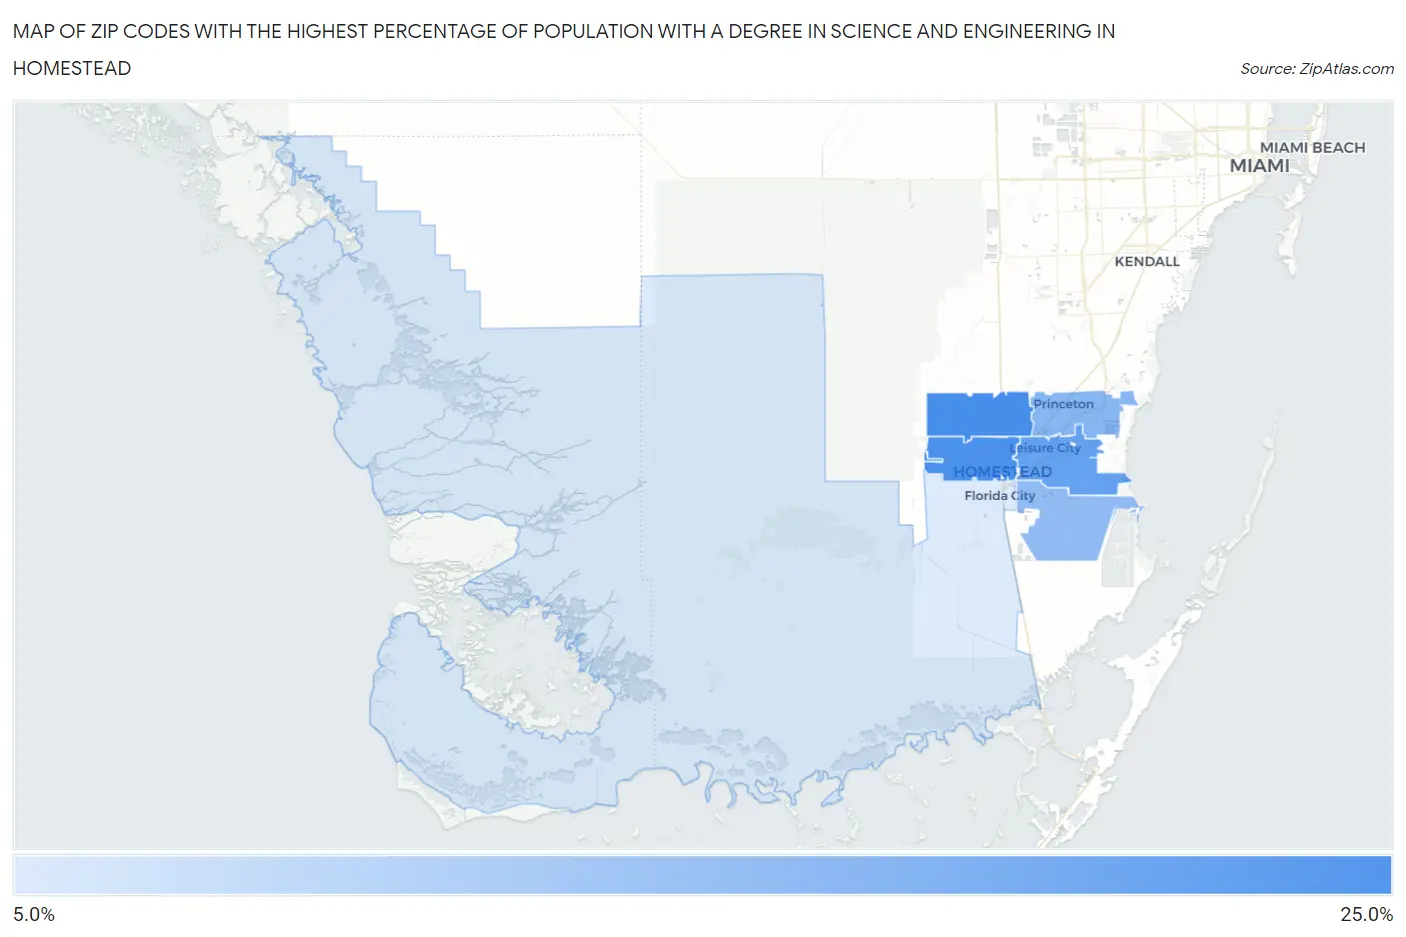
Map of Zip Codes with the Highest Percentage of Population with a Degree in Science and Engineering in Homestead

0.0%
25.0%
Zip Codes with the Highest Percentage of Population with a Degree in Science and Engineering in Homestead Map

Zip Codes with the Highest Percentage of Population with a Degree in Science and Engineering in Homestead, FL

Zip Code % Graduates vs State vs National
1.3303121.3%10.9%(+10.4)#329.8%(+11.5)#2,870
2.3303020.9%10.9%(+10.0)#359.8%(+11.1)#3,009
3.3303318.1%10.9%(+7.26)#669.8%(+8.35)#4,244
4.3303214.8%10.9%(+3.95)#1499.8%(+5.04)#6,882
5.3303513.8%10.9%(+2.91)#1919.8%(+4.00)#8,159
6.330346.7%10.9%(-4.19)#8379.8%(-3.11)#22,265

Common Questions

What are the Top 5 Zip Codes with the Highest Percentage of Population with a Degree in Science and Engineering in Homestead, FL?
Top 5 Zip Codes with the Highest Percentage of Population with a Degree in Science and Engineering in Homestead, FL are:
#1
21.3%
#2
20.9%
#3
18.1%
#4
14.8%
#5
13.8%
What zip code has the Highest Percentage of Population with a Degree in Science and Engineering in Homestead, FL?
33031 has the Highest Percentage of Population with a Degree in Science and Engineering in Homestead, FL with 21.3%.
What is the Percentage of Population with a Degree in Science and Engineering in Homestead, FL?
Percentage of Population with a Degree in Science and Engineering in Homestead is 15.5%.
What is the Percentage of Population with a Degree in Science and Engineering in Florida?
Percentage of Population with a Degree in Science and Engineering in Florida is 10.9%.
What is the Percentage of Population with a Degree in Science and Engineering in the United States?
Percentage of Population with a Degree in Science and Engineering in the United States is 9.8%.