Zip Codes with the Highest Percentage of Population Employed in Professional & Scientific Services in San Marcos, CA
RELATED REPORTS & OPTIONS
Professional & Scientific Services
San Marcos
Compare Zip Codes
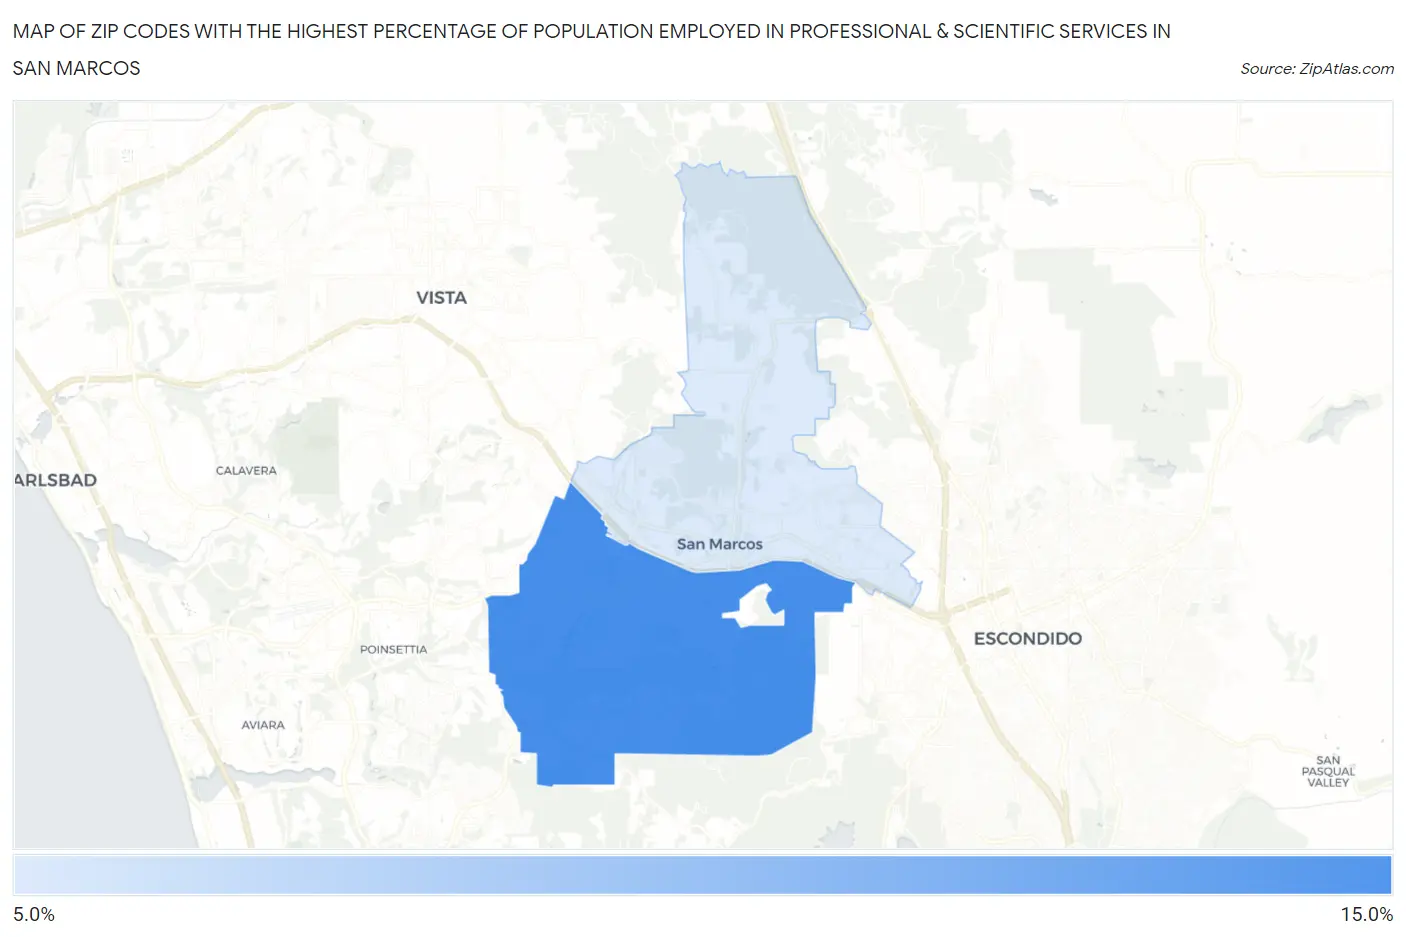
Map of Zip Codes with the Highest Percentage of Population Employed in Professional & Scientific Services in San Marcos
7.6%
11.8%
Zip Codes with the Highest Percentage of Population Employed in Professional & Scientific Services in San Marcos, CA
| Zip Code | % Employed | vs State | vs National | |
| 1. | 92078 | 11.8% | 9.4%(+2.34)#427 | 7.8%(+3.93)#3,332 |
| 2. | 92069 | 7.6% | 9.4%(-1.83)#722 | 7.8%(-0.238)#7,204 |
1
Common Questions
What are the Top Zip Codes with the Highest Percentage of Population Employed in Professional & Scientific Services in San Marcos, CA?
Top Zip Codes with the Highest Percentage of Population Employed in Professional & Scientific Services in San Marcos, CA are:
What zip code has the Highest Percentage of Population Employed in Professional & Scientific Services in San Marcos, CA?
92078 has the Highest Percentage of Population Employed in Professional & Scientific Services in San Marcos, CA with 11.8%.
What is the Percentage of Population Employed in Professional & Scientific Services in San Marcos, CA?
Percentage of Population Employed in Professional & Scientific Services in San Marcos is 9.7%.
What is the Percentage of Population Employed in Professional & Scientific Services in California?
Percentage of Population Employed in Professional & Scientific Services in California is 9.4%.
What is the Percentage of Population Employed in Professional & Scientific Services in the United States?
Percentage of Population Employed in Professional & Scientific Services in the United States is 7.8%.