Zip Codes with the Highest Percentage of Population Employed in Professional & Scientific Services in Pasadena, CA
RELATED REPORTS & OPTIONS
Professional & Scientific Services
Pasadena
Compare Zip Codes
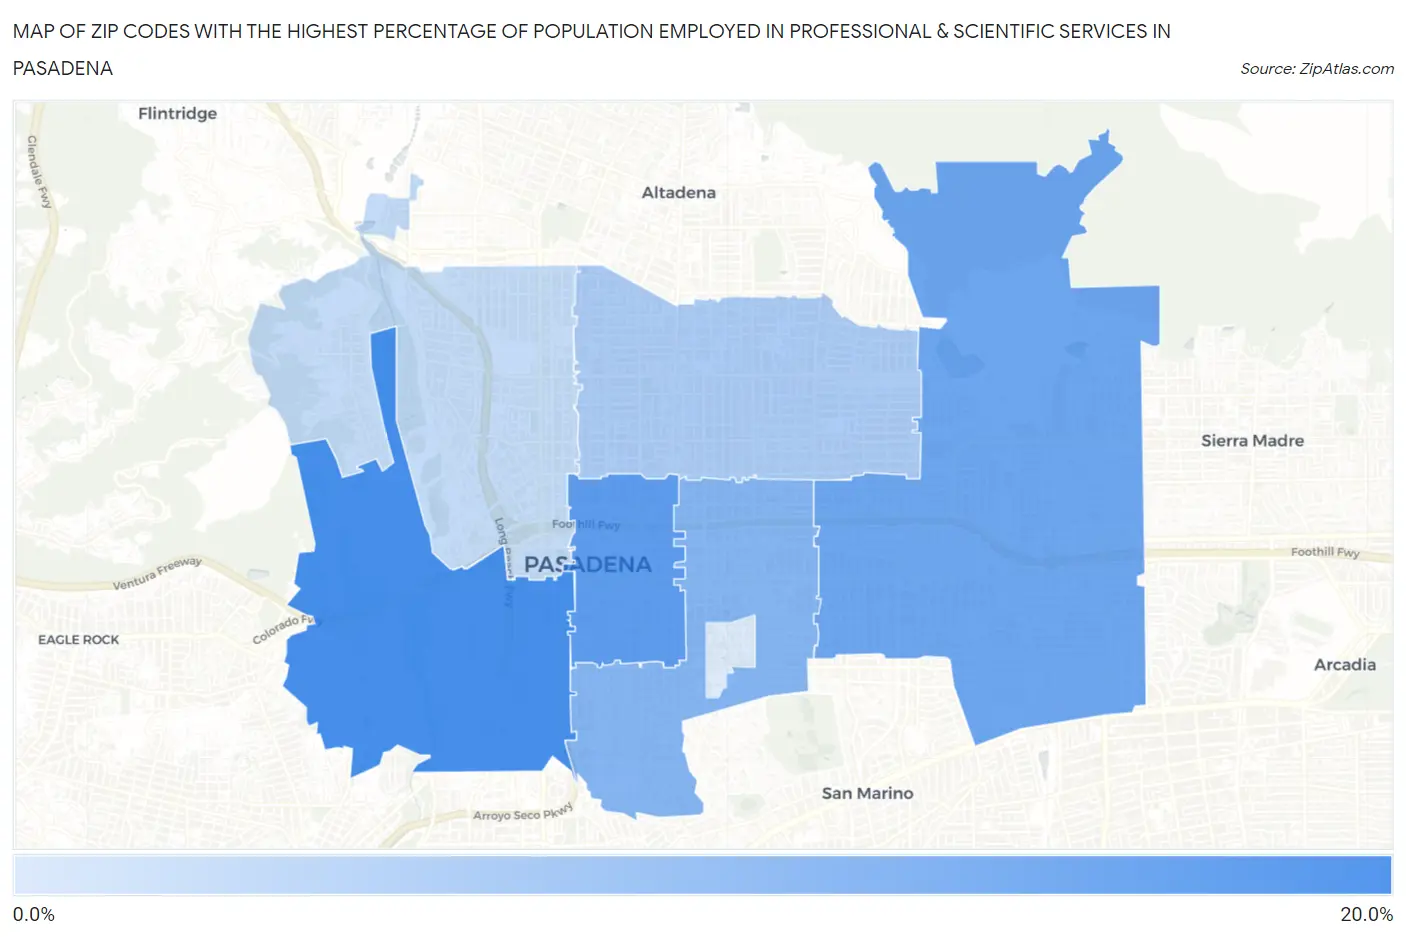
Map of Zip Codes with the Highest Percentage of Population Employed in Professional & Scientific Services in Pasadena
5.6%
19.3%
Zip Codes with the Highest Percentage of Population Employed in Professional & Scientific Services in Pasadena, CA
| Zip Code | % Employed | vs State | vs National | |
| 1. | 91105 | 19.3% | 9.4%(+9.87)#159 | 7.8%(+11.5)#970 |
| 2. | 91101 | 17.0% | 9.4%(+7.59)#228 | 7.8%(+9.18)#1,353 |
| 3. | 91107 | 15.6% | 9.4%(+6.15)#273 | 7.8%(+7.74)#1,721 |
| 4. | 91106 | 13.3% | 9.4%(+3.89)#358 | 7.8%(+5.48)#2,574 |
| 5. | 91104 | 9.8% | 9.4%(+0.389)#546 | 7.8%(+1.98)#4,723 |
| 6. | 91103 | 7.9% | 9.4%(-1.52)#697 | 7.8%(+0.066)#6,777 |
| 7. | 91125 | 5.6% | 9.4%(-3.80)#933 | 7.8%(-2.21)#10,737 |
1
Common Questions
What are the Top 5 Zip Codes with the Highest Percentage of Population Employed in Professional & Scientific Services in Pasadena, CA?
Top 5 Zip Codes with the Highest Percentage of Population Employed in Professional & Scientific Services in Pasadena, CA are:
What zip code has the Highest Percentage of Population Employed in Professional & Scientific Services in Pasadena, CA?
91105 has the Highest Percentage of Population Employed in Professional & Scientific Services in Pasadena, CA with 19.3%.
What is the Percentage of Population Employed in Professional & Scientific Services in Pasadena, CA?
Percentage of Population Employed in Professional & Scientific Services in Pasadena is 13.3%.
What is the Percentage of Population Employed in Professional & Scientific Services in California?
Percentage of Population Employed in Professional & Scientific Services in California is 9.4%.
What is the Percentage of Population Employed in Professional & Scientific Services in the United States?
Percentage of Population Employed in Professional & Scientific Services in the United States is 7.8%.