Tabiona, UT Map & Demographics
Tabiona Map
Tabiona Overview
$25,138
PER CAPITA INCOME
$67,500
AVG FAMILY INCOME
$66,429
AVG HOUSEHOLD INCOME
0.32
INEQUALITY / GINI INDEX
156
TOTAL POPULATION
77
MALE POPULATION
79
FEMALE POPULATION
97.47
MALES / 100 FEMALES
102.60
FEMALES / 100 MALES
28.1
MEDIAN AGE
3.2
AVG FAMILY SIZE
2.8
AVG HOUSEHOLD SIZE
66
LABOR FORCE [ PEOPLE ]
64.7%
PERCENT IN LABOR FORCE
3.0%
UNEMPLOYMENT RATE
Tabiona Zip Codes
Tabiona Area Codes
Income in Tabiona
Income Overview in Tabiona
Per Capita Income in Tabiona is $25,138, while median incomes of families and households are $67,500 and $66,429 respectively.
| Characteristic | Number | Measure |
| Per Capita Income | 156 | $25,138 |
| Median Family Income | 46 | $67,500 |
| Mean Family Income | 46 | $74,254 |
| Median Household Income | 56 | $66,429 |
| Mean Household Income | 56 | $68,593 |
| Income Deficit | 46 | $0 |
| Wage / Income Gap (%) | 156 | 0.00% |
| Wage / Income Gap ($) | 156 | 100.00¢ per $1 |
| Gini / Inequality Index | 156 | 0.32 |
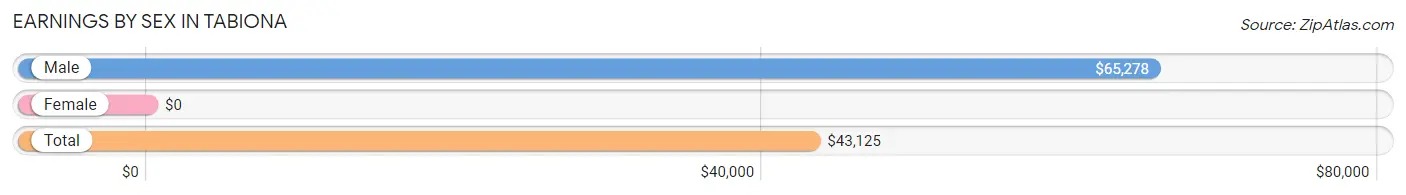
Earnings by Sex in Tabiona
| Sex | Number | Average Earnings |
| Male | 38 (52.0%) | $65,278 |
| Female | 35 (47.9%) | $0 |
| Total | 73 (100.0%) | $43,125 |
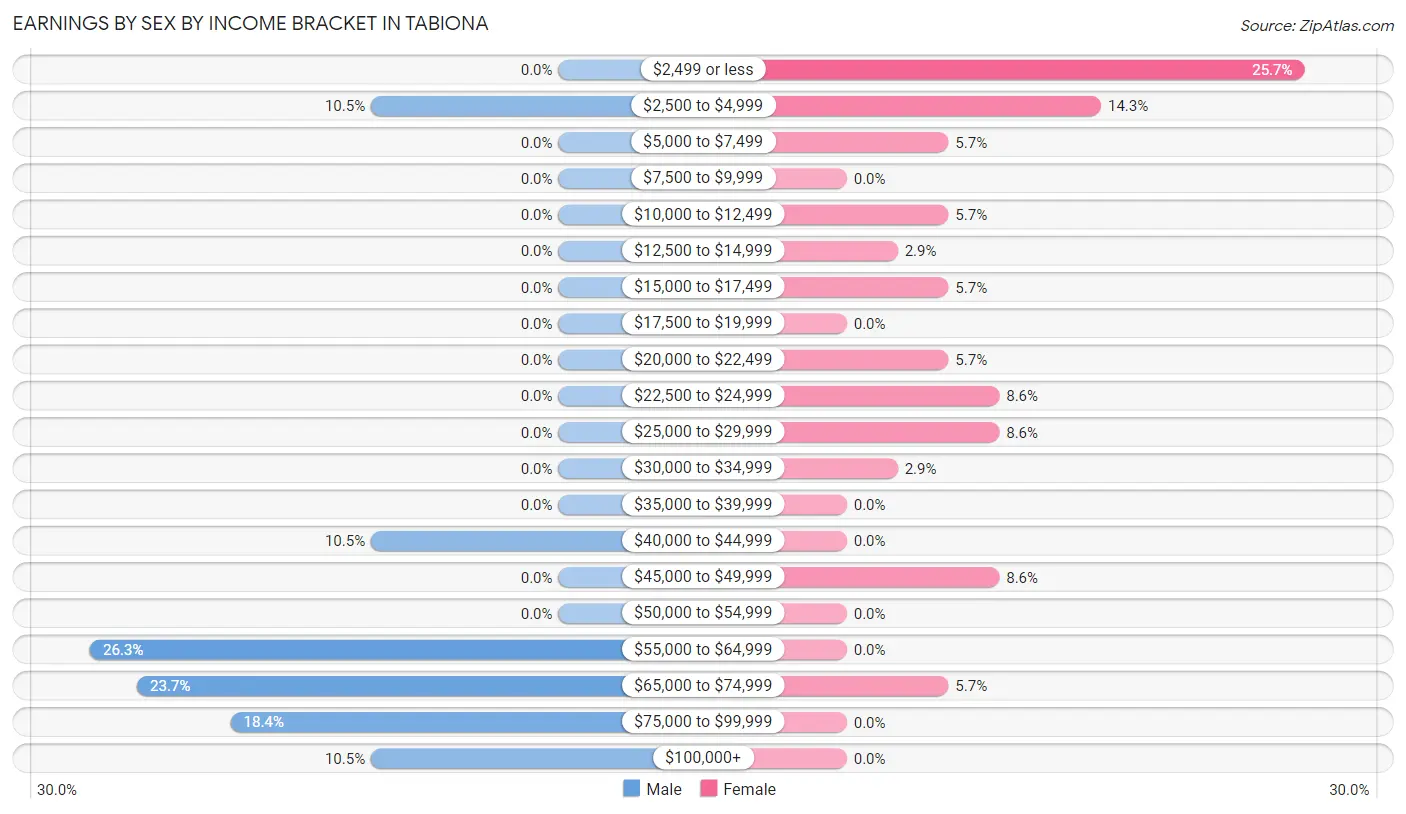
Earnings by Sex by Income Bracket in Tabiona
The most common earnings brackets in Tabiona are $55,000 to $64,999 for men (10 | 26.3%) and $2,499 or less for women (9 | 25.7%).
| Income | Male | Female |
| $2,499 or less | 0 (0.0%) | 9 (25.7%) |
| $2,500 to $4,999 | 4 (10.5%) | 5 (14.3%) |
| $5,000 to $7,499 | 0 (0.0%) | 2 (5.7%) |
| $7,500 to $9,999 | 0 (0.0%) | 0 (0.0%) |
| $10,000 to $12,499 | 0 (0.0%) | 2 (5.7%) |
| $12,500 to $14,999 | 0 (0.0%) | 1 (2.9%) |
| $15,000 to $17,499 | 0 (0.0%) | 2 (5.7%) |
| $17,500 to $19,999 | 0 (0.0%) | 0 (0.0%) |
| $20,000 to $22,499 | 0 (0.0%) | 2 (5.7%) |
| $22,500 to $24,999 | 0 (0.0%) | 3 (8.6%) |
| $25,000 to $29,999 | 0 (0.0%) | 3 (8.6%) |
| $30,000 to $34,999 | 0 (0.0%) | 1 (2.9%) |
| $35,000 to $39,999 | 0 (0.0%) | 0 (0.0%) |
| $40,000 to $44,999 | 4 (10.5%) | 0 (0.0%) |
| $45,000 to $49,999 | 0 (0.0%) | 3 (8.6%) |
| $50,000 to $54,999 | 0 (0.0%) | 0 (0.0%) |
| $55,000 to $64,999 | 10 (26.3%) | 0 (0.0%) |
| $65,000 to $74,999 | 9 (23.7%) | 2 (5.7%) |
| $75,000 to $99,999 | 7 (18.4%) | 0 (0.0%) |
| $100,000+ | 4 (10.5%) | 0 (0.0%) |
| Total | 38 (100.0%) | 35 (100.0%) |
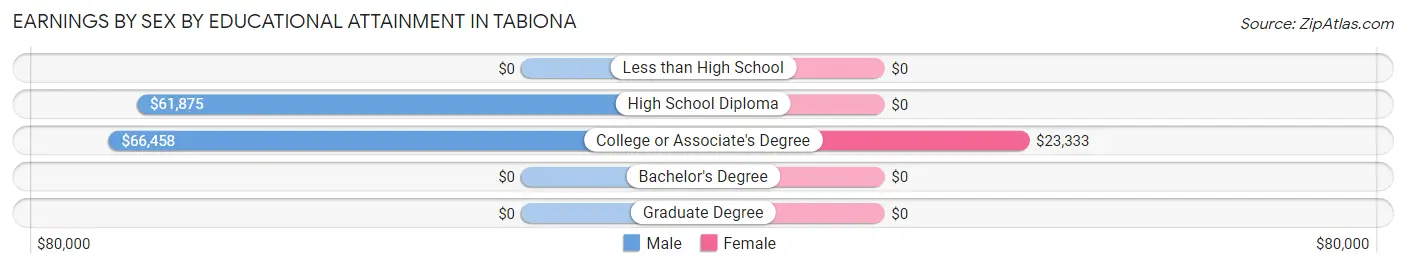
Earnings by Sex by Educational Attainment in Tabiona
Average earnings in Tabiona are $65,972 for men and $16,250 for women, a difference of 75.4%. Men with an educational attainment of college or associate's degree enjoy the highest average annual earnings of $66,458, while those with high school diploma education earn the least with $61,875. Women with an educational attainment of college or associate's degree earn the most with the average annual earnings of $23,333, while those with college or associate's degree education have the smallest earnings of $23,333.
| Educational Attainment | Male Income | Female Income |
| Less than High School | - | - |
| High School Diploma | $61,875 | $0 |
| College or Associate's Degree | $66,458 | $23,333 |
| Bachelor's Degree | - | - |
| Graduate Degree | - | - |
| Total | $65,972 | $16,250 |
Family Income in Tabiona
Family Income Brackets in Tabiona
According to the Tabiona family income data, there are 19 families falling into the $50,000 to $74,999 income range, which is the most common income bracket and makes up 41.3% of all families.
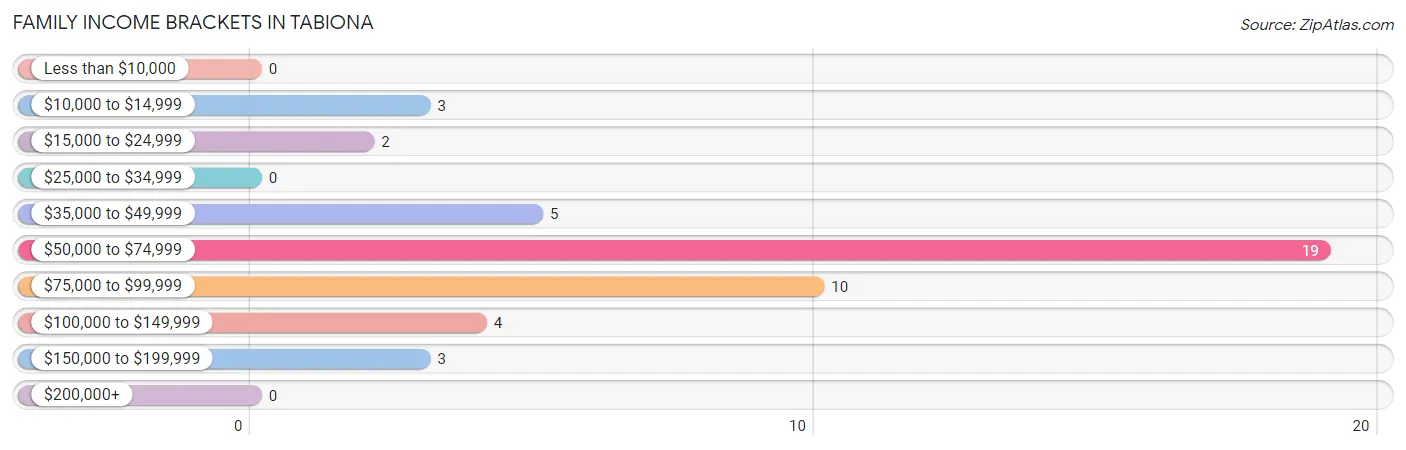
| Income Bracket | # Families | % Families |
| Less than $10,000 | 0 | 0.0% |
| $10,000 to $14,999 | 3 | 6.5% |
| $15,000 to $24,999 | 2 | 4.3% |
| $25,000 to $34,999 | 0 | 0.0% |
| $35,000 to $49,999 | 5 | 10.9% |
| $50,000 to $74,999 | 19 | 41.3% |
| $75,000 to $99,999 | 10 | 21.7% |
| $100,000 to $149,999 | 4 | 8.7% |
| $150,000 to $199,999 | 3 | 6.5% |
| $200,000+ | 0 | 0.0% |
Family Income by Famaliy Size in Tabiona
4-person families (15 | 32.6%) account for the highest median family income in Tabiona with $72,083 per family, while 2-person families (20 | 43.5%) have the highest median income of $30,834 per family member.
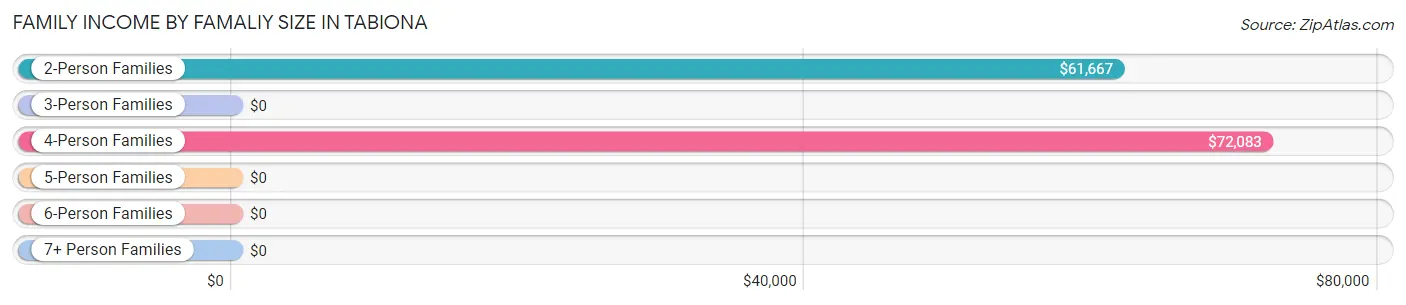
| Income Bracket | # Families | Median Income |
| 2-Person Families | 20 (43.5%) | $61,667 |
| 3-Person Families | 5 (10.9%) | $0 |
| 4-Person Families | 15 (32.6%) | $72,083 |
| 5-Person Families | 1 (2.2%) | $0 |
| 6-Person Families | 2 (4.3%) | $0 |
| 7+ Person Families | 3 (6.5%) | $0 |
| Total | 46 (100.0%) | $67,500 |
Family Income by Number of Earners in Tabiona
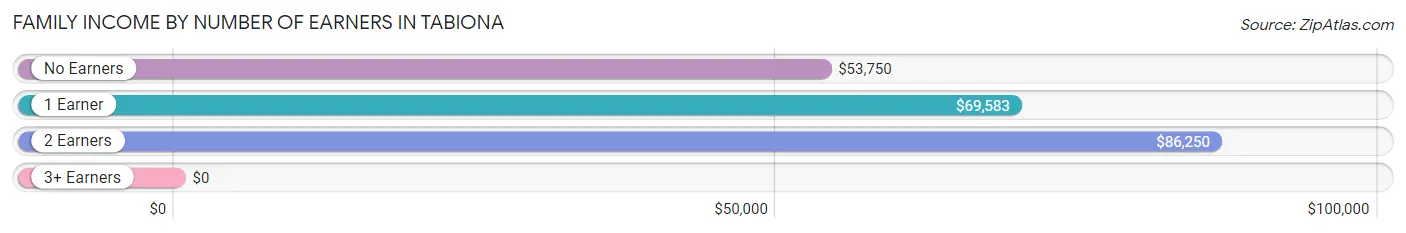
| Number of Earners | # Families | Median Income |
| No Earners | 10 (21.7%) | $53,750 |
| 1 Earner | 13 (28.3%) | $69,583 |
| 2 Earners | 20 (43.5%) | $86,250 |
| 3+ Earners | 3 (6.5%) | $0 |
| Total | 46 (100.0%) | $67,500 |
Household Income in Tabiona
Household Income Brackets in Tabiona
With 19 households falling in the category, the $50,000 to $74,999 income range is the most frequent in Tabiona, accounting for 33.9% of all households.
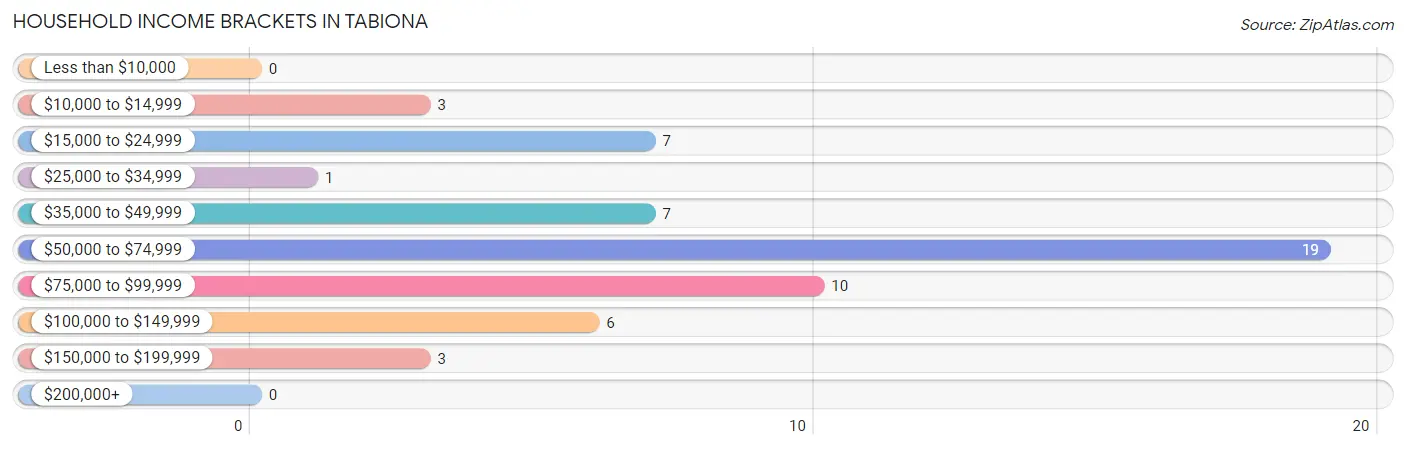
| Income Bracket | # Households | % Households |
| Less than $10,000 | 0 | 0.0% |
| $10,000 to $14,999 | 3 | 5.4% |
| $15,000 to $24,999 | 7 | 12.5% |
| $25,000 to $34,999 | 1 | 1.8% |
| $35,000 to $49,999 | 7 | 12.5% |
| $50,000 to $74,999 | 19 | 33.9% |
| $75,000 to $99,999 | 10 | 17.9% |
| $100,000 to $149,999 | 6 | 10.7% |
| $150,000 to $199,999 | 3 | 5.4% |
| $200,000+ | 0 | 0.0% |
Household Income by Householder Age in Tabiona
The median household income in Tabiona is $66,429, with the highest median household income of $79,583 found in the 25 to 44 years age bracket for the primary householder. A total of 15 households (26.8%) fall into this category. Meanwhile, the 15 to 24 years age bracket for the primary householder has the lowest median household income of $0, with 2 households (3.6%) in this group.
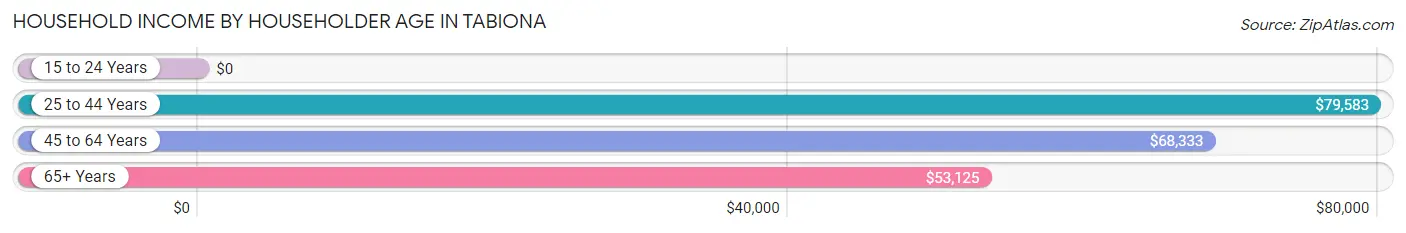
| Income Bracket | # Households | Median Income |
| 15 to 24 Years | 2 (3.6%) | $0 |
| 25 to 44 Years | 15 (26.8%) | $79,583 |
| 45 to 64 Years | 24 (42.9%) | $68,333 |
| 65+ Years | 15 (26.8%) | $53,125 |
| Total | 56 (100.0%) | $66,429 |
Poverty in Tabiona
Income Below Poverty by Sex and Age in Tabiona
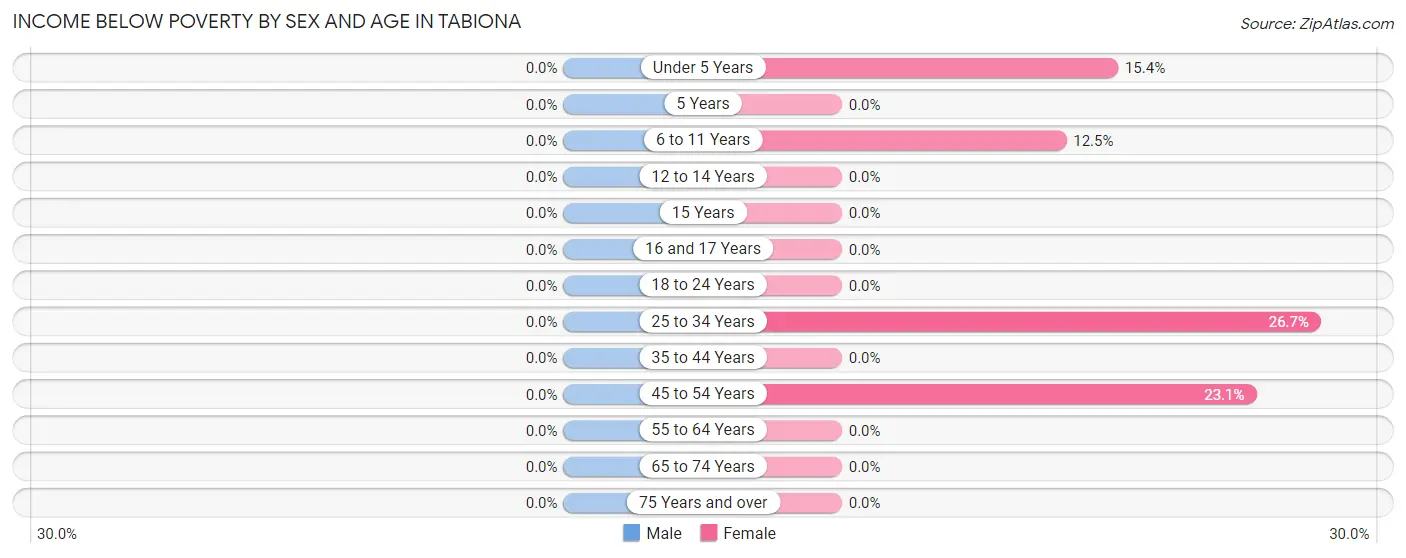
| Age Bracket | Male | Female |
| Under 5 Years | 0 (0.0%) | 2 (15.4%) |
| 5 Years | 0 (0.0%) | 0 (0.0%) |
| 6 to 11 Years | 0 (0.0%) | 1 (12.5%) |
| 12 to 14 Years | 0 (0.0%) | 0 (0.0%) |
| 15 Years | 0 (0.0%) | 0 (0.0%) |
| 16 and 17 Years | 0 (0.0%) | 0 (0.0%) |
| 18 to 24 Years | 0 (0.0%) | 0 (0.0%) |
| 25 to 34 Years | 0 (0.0%) | 4 (26.7%) |
| 35 to 44 Years | 0 (0.0%) | 0 (0.0%) |
| 45 to 54 Years | 0 (0.0%) | 3 (23.1%) |
| 55 to 64 Years | 0 (0.0%) | 0 (0.0%) |
| 65 to 74 Years | 0 (0.0%) | 0 (0.0%) |
| 75 Years and over | 0 (0.0%) | 0 (0.0%) |
| Total | 0 (0.0%) | 10 (12.7%) |
Income Above Poverty by Sex and Age in Tabiona
According to the poverty statistics in Tabiona, males aged under 5 years and females aged 5 years are the age groups that are most secure financially, with 100.0% of males and 100.0% of females in these age groups living above the poverty line.
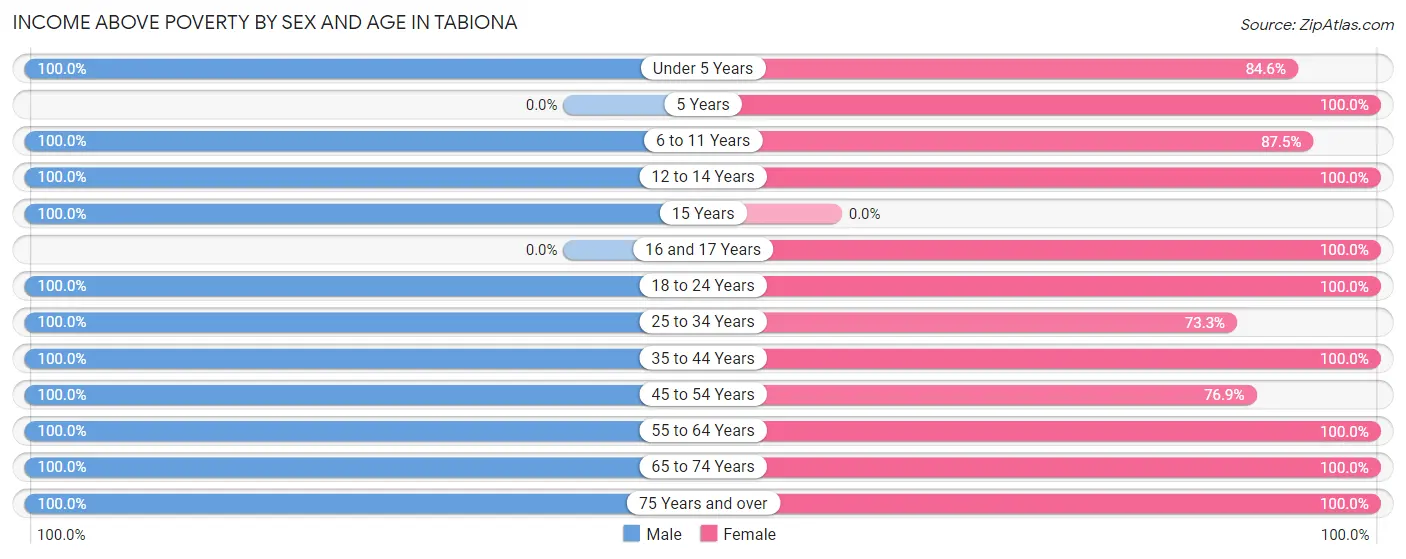
| Age Bracket | Male | Female |
| Under 5 Years | 12 (100.0%) | 11 (84.6%) |
| 5 Years | 0 (0.0%) | 2 (100.0%) |
| 6 to 11 Years | 11 (100.0%) | 7 (87.5%) |
| 12 to 14 Years | 2 (100.0%) | 3 (100.0%) |
| 15 Years | 3 (100.0%) | 0 (0.0%) |
| 16 and 17 Years | 0 (0.0%) | 3 (100.0%) |
| 18 to 24 Years | 5 (100.0%) | 2 (100.0%) |
| 25 to 34 Years | 11 (100.0%) | 11 (73.3%) |
| 35 to 44 Years | 4 (100.0%) | 3 (100.0%) |
| 45 to 54 Years | 11 (100.0%) | 10 (76.9%) |
| 55 to 64 Years | 6 (100.0%) | 5 (100.0%) |
| 65 to 74 Years | 6 (100.0%) | 10 (100.0%) |
| 75 Years and over | 6 (100.0%) | 2 (100.0%) |
| Total | 77 (100.0%) | 69 (87.3%) |
Income Below Poverty Among Married-Couple Families in Tabiona
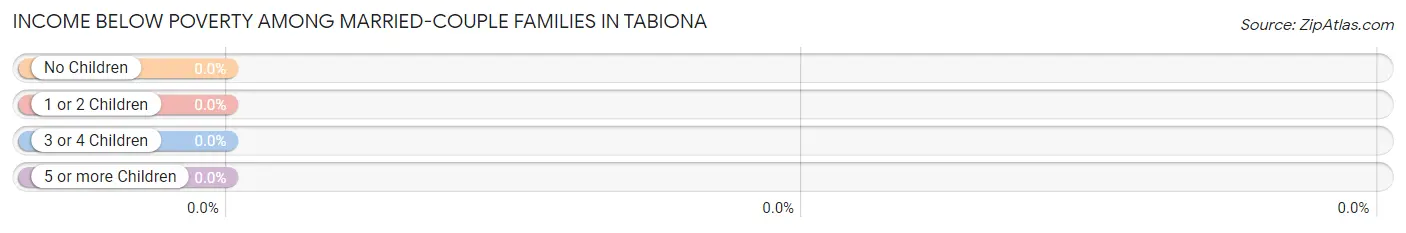
| Children | Above Poverty | Below Poverty |
| No Children | 17 (100.0%) | 0 (0.0%) |
| 1 or 2 Children | 14 (100.0%) | 0 (0.0%) |
| 3 or 4 Children | 3 (100.0%) | 0 (0.0%) |
| 5 or more Children | 3 (100.0%) | 0 (0.0%) |
| Total | 37 (100.0%) | 0 (0.0%) |
Income Below Poverty Among Single-Parent Households in Tabiona
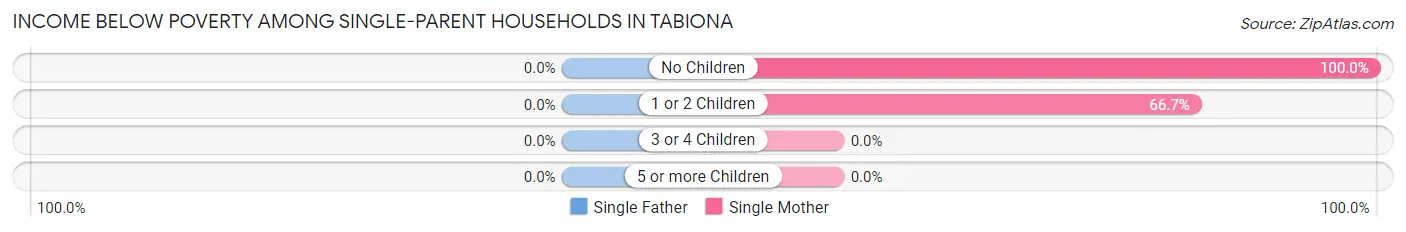
| Children | Single Father | Single Mother |
| No Children | 0 (0.0%) | 3 (100.0%) |
| 1 or 2 Children | 0 (0.0%) | 2 (66.7%) |
| 3 or 4 Children | 0 (0.0%) | 0 (0.0%) |
| 5 or more Children | 0 (0.0%) | 0 (0.0%) |
| Total | 0 (0.0%) | 5 (83.3%) |
Income Below Poverty Among Married-Couple vs Single-Parent Households in Tabiona
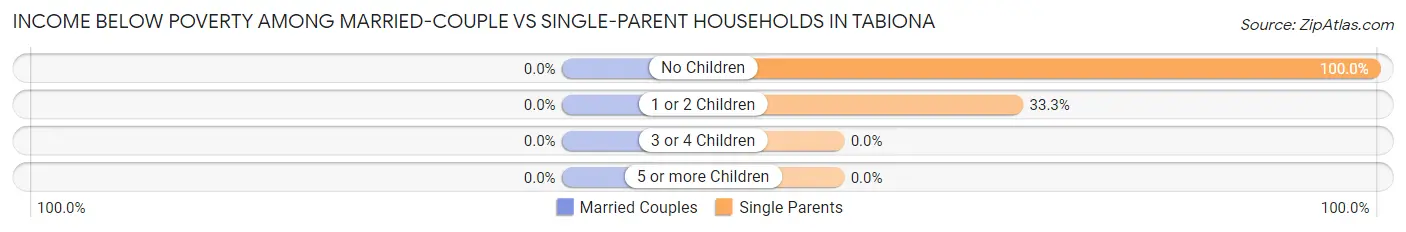
| Children | Married-Couple Families | Single-Parent Households |
| No Children | 0 (0.0%) | 3 (100.0%) |
| 1 or 2 Children | 0 (0.0%) | 2 (33.3%) |
| 3 or 4 Children | 0 (0.0%) | 0 (0.0%) |
| 5 or more Children | 0 (0.0%) | 0 (0.0%) |
| Total | 0 (0.0%) | 5 (55.6%) |
Race in Tabiona
The most populous races in Tabiona are White / Caucasian (150 | 96.2%), Hawaiian / Pacific (3 | 1.9%), and Two or more Races (3 | 1.9%).
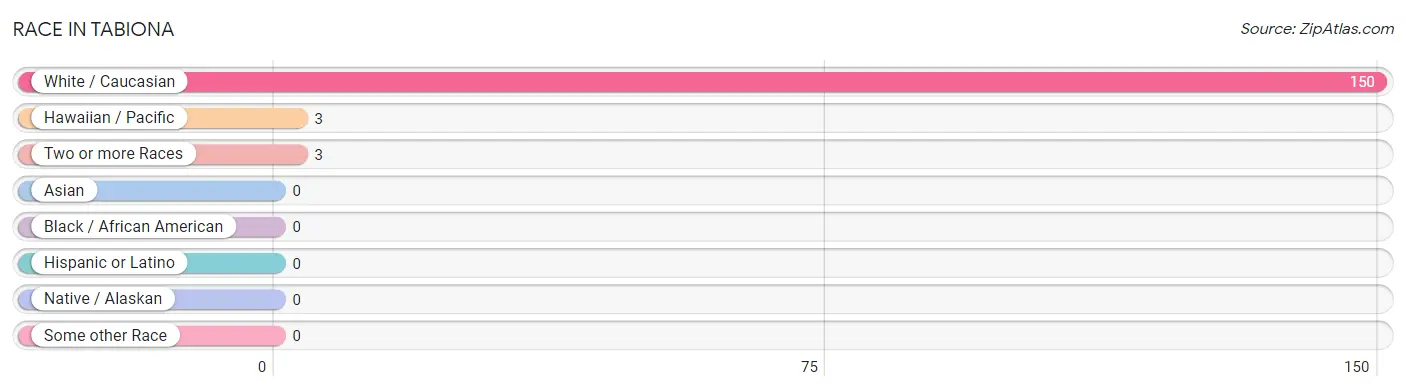
| Race | # Population | % Population |
| Asian | 0 | 0.0% |
| Black / African American | 0 | 0.0% |
| Hawaiian / Pacific | 3 | 1.9% |
| Hispanic or Latino | 0 | 0.0% |
| Native / Alaskan | 0 | 0.0% |
| White / Caucasian | 150 | 96.2% |
| Two or more Races | 3 | 1.9% |
| Some other Race | 0 | 0.0% |
| Total | 156 | 100.0% |
Ancestry in Tabiona
The most populous ancestries reported in Tabiona are English (44 | 28.2%), German (15 | 9.6%), Irish (10 | 6.4%), Scottish (10 | 6.4%), and American (9 | 5.8%), together accounting for 56.4% of all Tabiona residents.
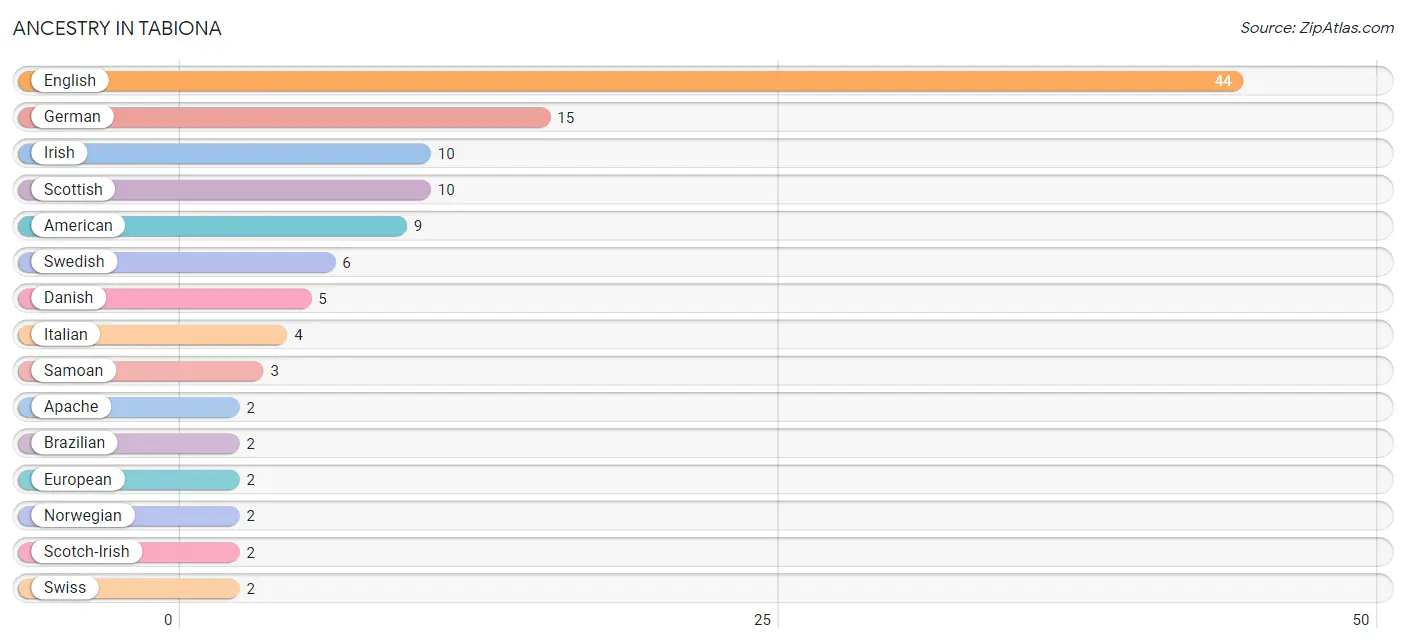
| Ancestry | # Population | % Population |
| American | 9 | 5.8% |
| Apache | 2 | 1.3% |
| Brazilian | 2 | 1.3% |
| Danish | 5 | 3.2% |
| English | 44 | 28.2% |
| European | 2 | 1.3% |
| German | 15 | 9.6% |
| Irish | 10 | 6.4% |
| Italian | 4 | 2.6% |
| Norwegian | 2 | 1.3% |
| Samoan | 3 | 1.9% |
| Scotch-Irish | 2 | 1.3% |
| Scottish | 10 | 6.4% |
| Swedish | 6 | 3.8% |
| Swiss | 2 | 1.3% |
| Ute | 1 | 0.6% | View All 16 Rows |
Immigrants in Tabiona
The most numerous immigrant groups reported in Tabiona came from Brazil (2 | 1.3%), Latin America (2 | 1.3%), and South America (2 | 1.3%), together accounting for 3.8% of all Tabiona residents.
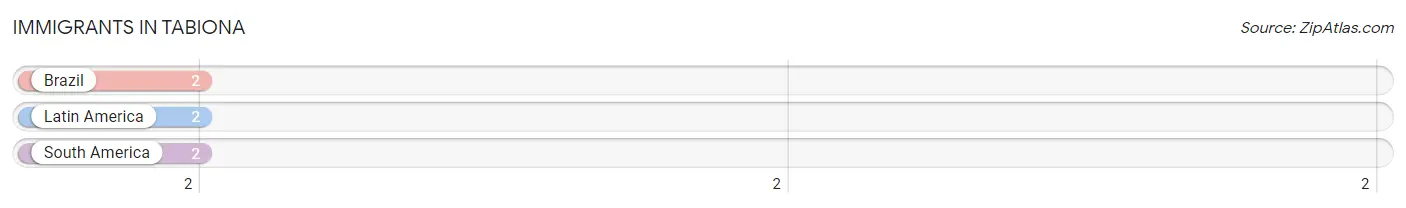
| Immigration Origin | # Population | % Population |
| Brazil | 2 | 1.3% |
| Latin America | 2 | 1.3% |
| South America | 2 | 1.3% | View All 3 Rows |
Sex and Age in Tabiona
Sex and Age in Tabiona
The most populous age groups in Tabiona are Under 5 Years (12 | 15.6%) for men and Under 5 Years (13 | 16.5%) for women.
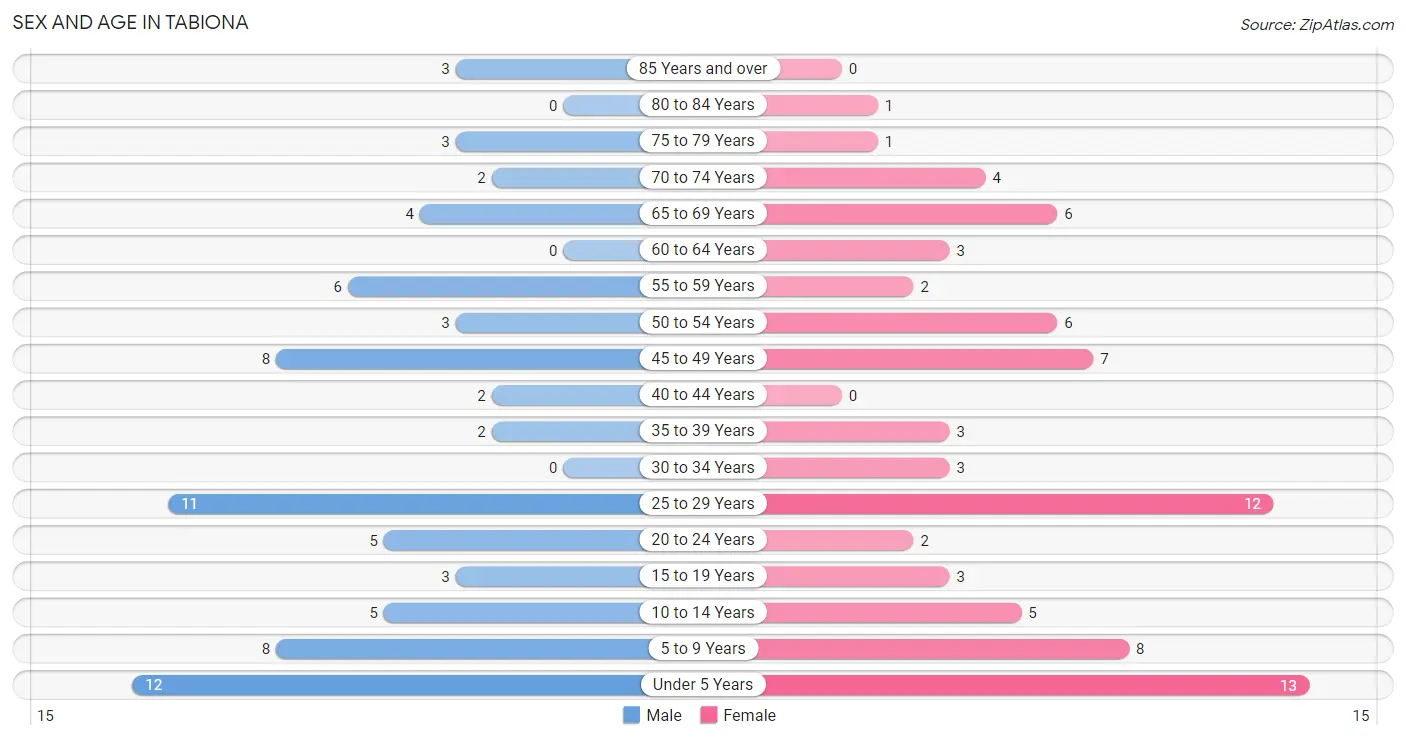
| Age Bracket | Male | Female |
| Under 5 Years | 12 (15.6%) | 13 (16.5%) |
| 5 to 9 Years | 8 (10.4%) | 8 (10.1%) |
| 10 to 14 Years | 5 (6.5%) | 5 (6.3%) |
| 15 to 19 Years | 3 (3.9%) | 3 (3.8%) |
| 20 to 24 Years | 5 (6.5%) | 2 (2.5%) |
| 25 to 29 Years | 11 (14.3%) | 12 (15.2%) |
| 30 to 34 Years | 0 (0.0%) | 3 (3.8%) |
| 35 to 39 Years | 2 (2.6%) | 3 (3.8%) |
| 40 to 44 Years | 2 (2.6%) | 0 (0.0%) |
| 45 to 49 Years | 8 (10.4%) | 7 (8.9%) |
| 50 to 54 Years | 3 (3.9%) | 6 (7.6%) |
| 55 to 59 Years | 6 (7.8%) | 2 (2.5%) |
| 60 to 64 Years | 0 (0.0%) | 3 (3.8%) |
| 65 to 69 Years | 4 (5.2%) | 6 (7.6%) |
| 70 to 74 Years | 2 (2.6%) | 4 (5.1%) |
| 75 to 79 Years | 3 (3.9%) | 1 (1.3%) |
| 80 to 84 Years | 0 (0.0%) | 1 (1.3%) |
| 85 Years and over | 3 (3.9%) | 0 (0.0%) |
| Total | 77 (100.0%) | 79 (100.0%) |
Families and Households in Tabiona
Median Family Size in Tabiona
The median family size in Tabiona is 3.17 persons per family, with married-couple families (37 | 80.4%) accounting for the largest median family size of 3.35 persons per family. On the other hand, single female/mother families (6 | 13.0%) represent the smallest median family size with 2.33 persons per family.
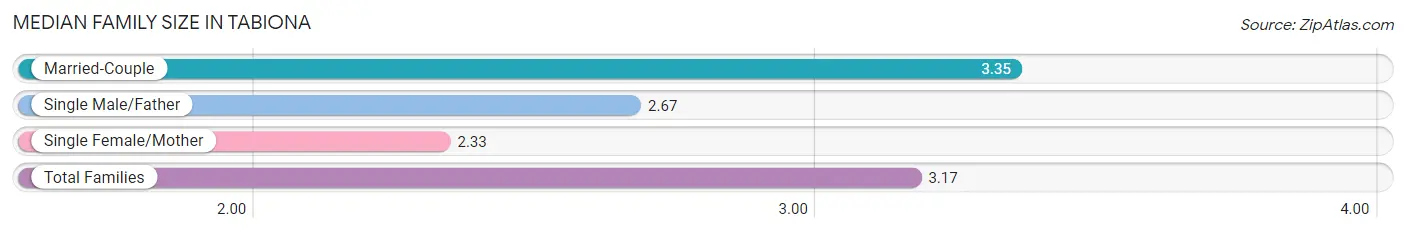
| Family Type | # Families | Family Size |
| Married-Couple | 37 (80.4%) | 3.35 |
| Single Male/Father | 3 (6.5%) | 2.67 |
| Single Female/Mother | 6 (13.0%) | 2.33 |
| Total Families | 46 (100.0%) | 3.17 |
Median Household Size in Tabiona
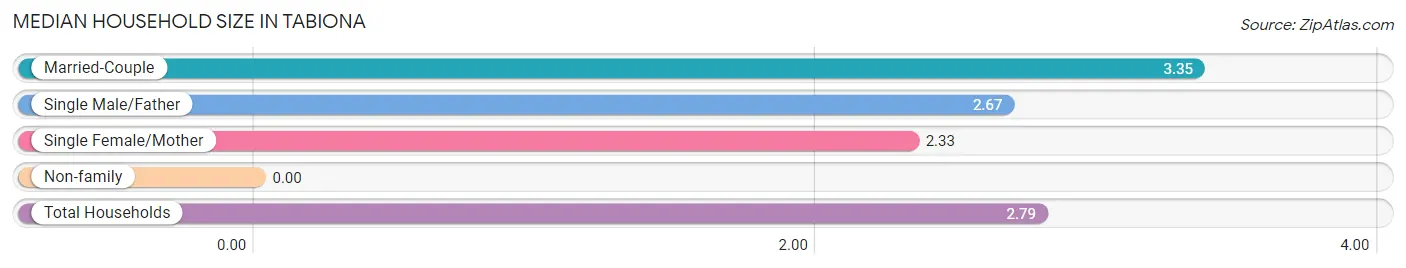
| Household Type | # Households | Household Size |
| Married-Couple | 37 (66.1%) | 3.35 |
| Single Male/Father | 3 (5.4%) | 2.67 |
| Single Female/Mother | 6 (10.7%) | 2.33 |
| Non-family | 10 (17.9%) | - |
| Total Households | 56 (100.0%) | 2.79 |
Household Size by Marriage Status in Tabiona
Out of a total of 56 households in Tabiona, 46 (82.1%) are family households, while 10 (17.9%) are nonfamily households. The most numerous type of family households are 2-person households, comprising 20, and the most common type of nonfamily households are 1-person households, comprising 10.
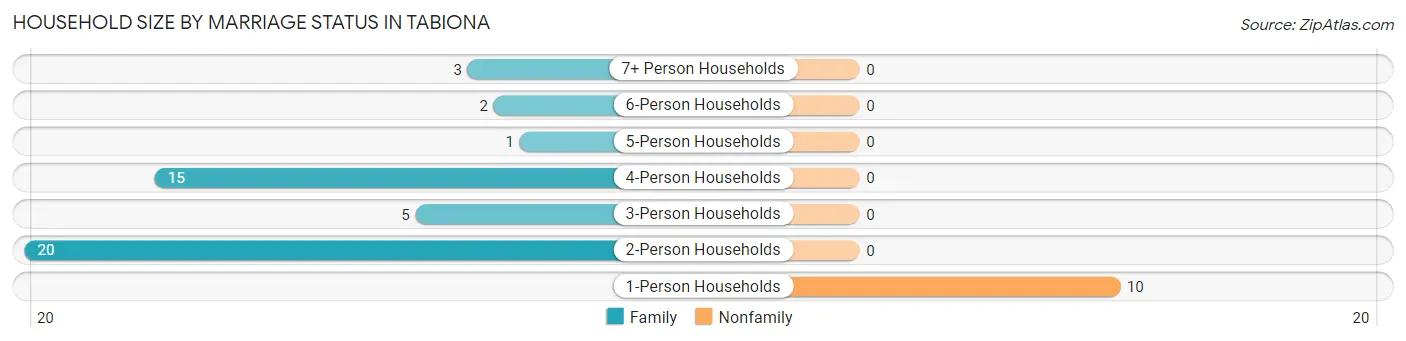
| Household Size | Family Households | Nonfamily Households |
| 1-Person Households | - | 10 (17.9%) |
| 2-Person Households | 20 (35.7%) | 0 (0.0%) |
| 3-Person Households | 5 (8.9%) | 0 (0.0%) |
| 4-Person Households | 15 (26.8%) | 0 (0.0%) |
| 5-Person Households | 1 (1.8%) | 0 (0.0%) |
| 6-Person Households | 2 (3.6%) | 0 (0.0%) |
| 7+ Person Households | 3 (5.4%) | 0 (0.0%) |
| Total | 46 (82.1%) | 10 (17.9%) |
Female Fertility in Tabiona
Fertility by Age in Tabiona
Average fertility rate in Tabiona is 194.0 births per 1,000 women. Women in the age bracket of 35 to 50 years have the highest fertility rate with 273.0 births per 1,000 women. Women in the age bracket of 20 to 34 years acount for 50.0% of all women with births.
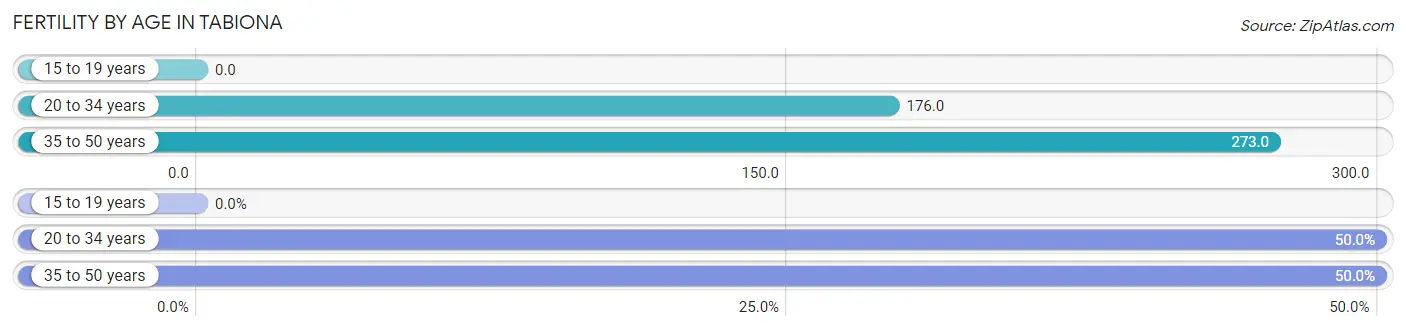
| Age Bracket | Women with Births | Births / 1,000 Women |
| 15 to 19 years | 0 (0.0%) | 0.0 |
| 20 to 34 years | 3 (50.0%) | 176.0 |
| 35 to 50 years | 3 (50.0%) | 273.0 |
| Total | 6 (100.0%) | 194.0 |
Fertility by Age by Marriage Status in Tabiona
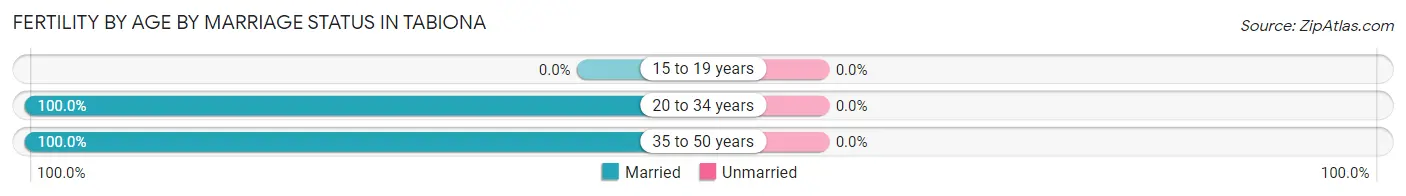
| Age Bracket | Married | Unmarried |
| 15 to 19 years | 0 (0.0%) | 0 (0.0%) |
| 20 to 34 years | 3 (100.0%) | 0 (0.0%) |
| 35 to 50 years | 3 (100.0%) | 0 (0.0%) |
| Total | 6 (100.0%) | 0 (0.0%) |
Fertility by Education in Tabiona
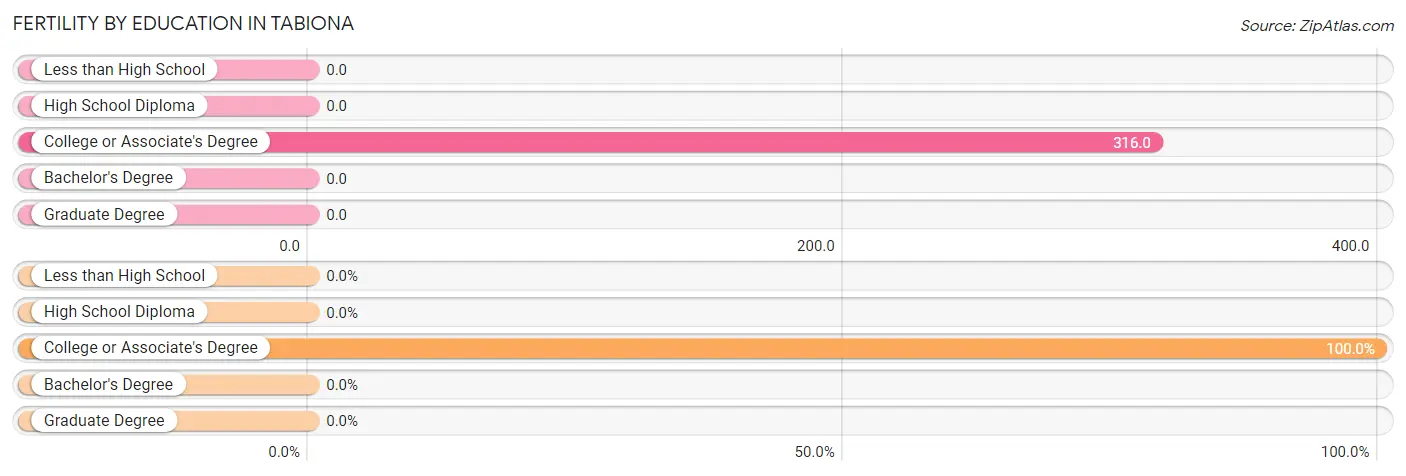
| Educational Attainment | Women with Births | Births / 1,000 Women |
| Less than High School | 0 (0.0%) | 0.0 |
| High School Diploma | 0 (0.0%) | 0.0 |
| College or Associate's Degree | 6 (100.0%) | 316.0 |
| Bachelor's Degree | 0 (0.0%) | 0.0 |
| Graduate Degree | 0 (0.0%) | 0.0 |
| Total | 6 (100.0%) | 194.0 |
Fertility by Education by Marriage Status in Tabiona
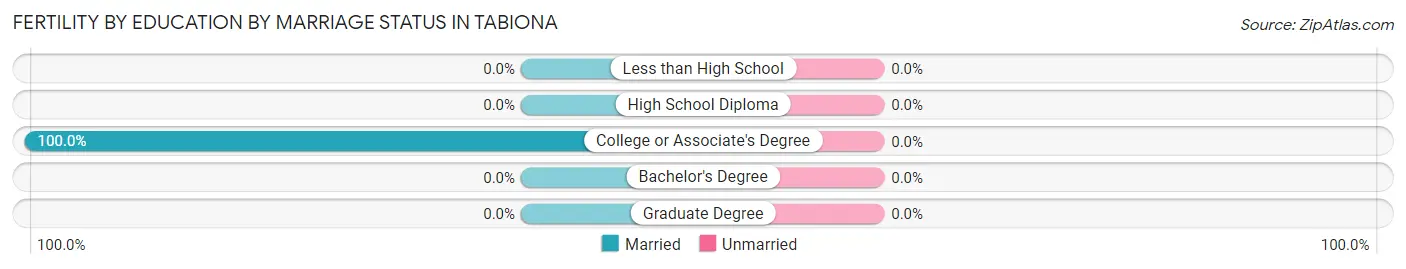
| Educational Attainment | Married | Unmarried |
| Less than High School | 0 (0.0%) | 0 (0.0%) |
| High School Diploma | 0 (0.0%) | 0 (0.0%) |
| College or Associate's Degree | 6 (100.0%) | 0 (0.0%) |
| Bachelor's Degree | 0 (0.0%) | 0 (0.0%) |
| Graduate Degree | 0 (0.0%) | 0 (0.0%) |
| Total | 6 (100.0%) | 0 (0.0%) |
Employment Characteristics in Tabiona
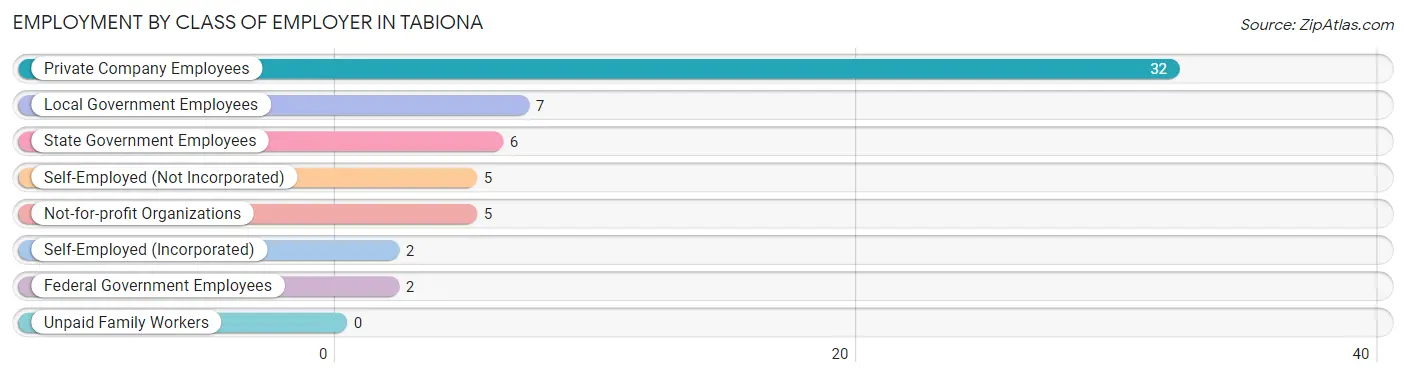
Employment by Class of Employer in Tabiona
Among the 59 employed individuals in Tabiona, private company employees (32 | 54.2%), local government employees (7 | 11.9%), and state government employees (6 | 10.2%) make up the most common classes of employment.
| Employer Class | # Employees | % Employees |
| Private Company Employees | 32 | 54.2% |
| Self-Employed (Incorporated) | 2 | 3.4% |
| Self-Employed (Not Incorporated) | 5 | 8.5% |
| Not-for-profit Organizations | 5 | 8.5% |
| Local Government Employees | 7 | 11.9% |
| State Government Employees | 6 | 10.2% |
| Federal Government Employees | 2 | 3.4% |
| Unpaid Family Workers | 0 | 0.0% |
| Total | 59 | 100.0% |
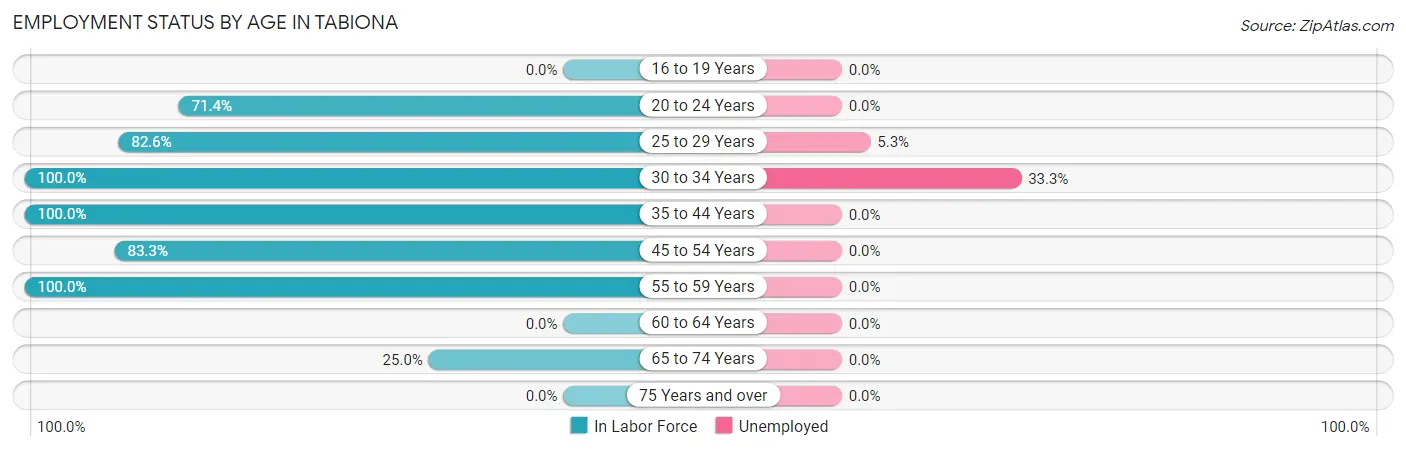
Employment Status by Age in Tabiona
According to the labor force statistics for Tabiona, out of the total population over 16 years of age (102), 64.7% or 66 individuals are in the labor force, with 3.0% or 2 of them unemployed. The age group with the highest labor force participation rate is 30 to 34 years, with 100.0% or 3 individuals in the labor force. Within the labor force, the 30 to 34 years age range has the highest percentage of unemployed individuals, with 33.3% or 1 of them being unemployed.
| Age Bracket | In Labor Force | Unemployed |
| 16 to 19 Years | 0 (0.0%) | 0 (0.0%) |
| 20 to 24 Years | 5 (71.4%) | 0 (0.0%) |
| 25 to 29 Years | 19 (82.6%) | 1 (5.3%) |
| 30 to 34 Years | 3 (100.0%) | 1 (33.3%) |
| 35 to 44 Years | 7 (100.0%) | 0 (0.0%) |
| 45 to 54 Years | 20 (83.3%) | 0 (0.0%) |
| 55 to 59 Years | 8 (100.0%) | 0 (0.0%) |
| 60 to 64 Years | 0 (0.0%) | 0 (0.0%) |
| 65 to 74 Years | 4 (25.0%) | 0 (0.0%) |
| 75 Years and over | 0 (0.0%) | 0 (0.0%) |
| Total | 66 (64.7%) | 2 (3.0%) |
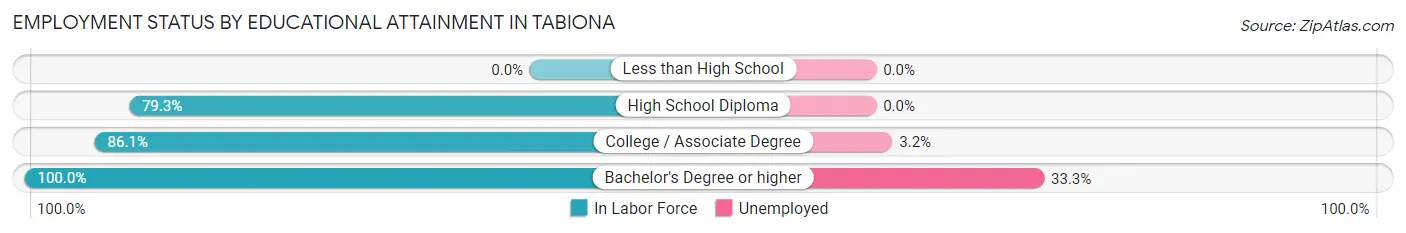
Employment Status by Educational Attainment in Tabiona
According to labor force statistics for Tabiona, 83.8% of individuals (57) out of the total population between 25 and 64 years of age (68) are in the labor force, with 3.5% or 2 of them being unemployed. The group with the highest labor force participation rate are those with the educational attainment of bachelor's degree or higher, with 100.0% or 3 individuals in the labor force. Within the labor force, individuals with bachelor's degree or higher education have the highest percentage of unemployment, with 33.3% or 1 of them being unemployed.
| Educational Attainment | In Labor Force | Unemployed |
| Less than High School | 0 (0.0%) | 0 (0.0%) |
| High School Diploma | 23 (79.3%) | 0 (0.0%) |
| College / Associate Degree | 31 (86.1%) | 1 (3.2%) |
| Bachelor's Degree or higher | 3 (100.0%) | 1 (33.3%) |
| Total | 57 (83.8%) | 2 (3.5%) |
Employment Occupations by Sex in Tabiona
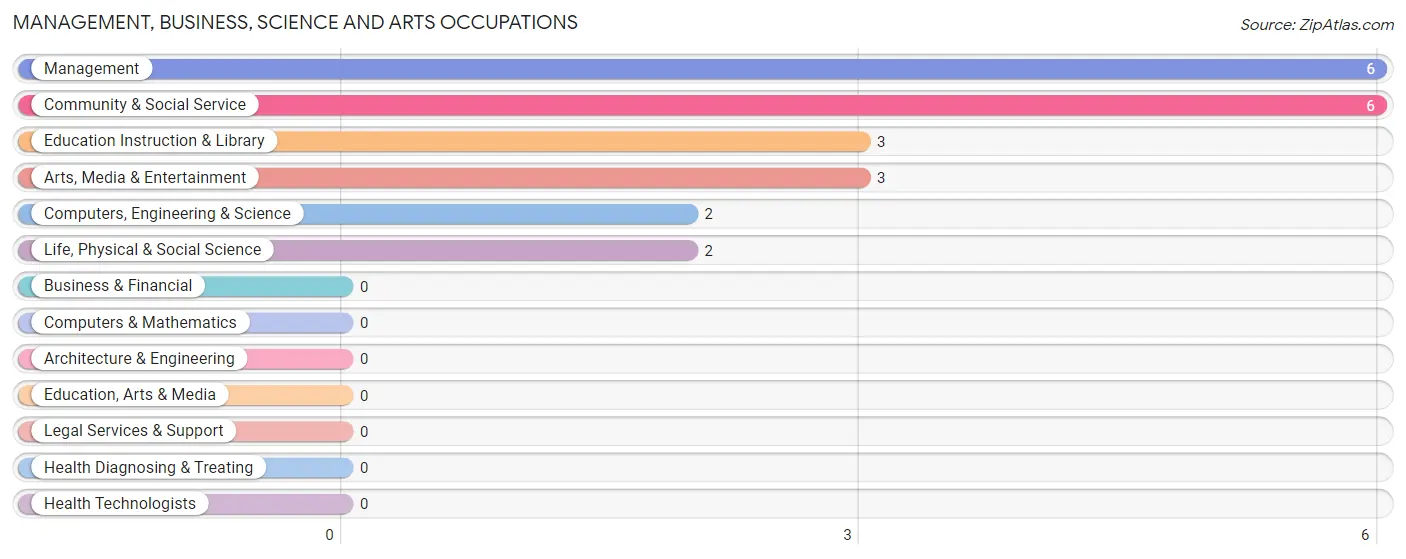
Management, Business, Science and Arts Occupations
The most common Management, Business, Science and Arts occupations in Tabiona are Management (6 | 9.4%), Community & Social Service (6 | 9.4%), Education Instruction & Library (3 | 4.7%), Arts, Media & Entertainment (3 | 4.7%), and Computers, Engineering & Science (2 | 3.1%).
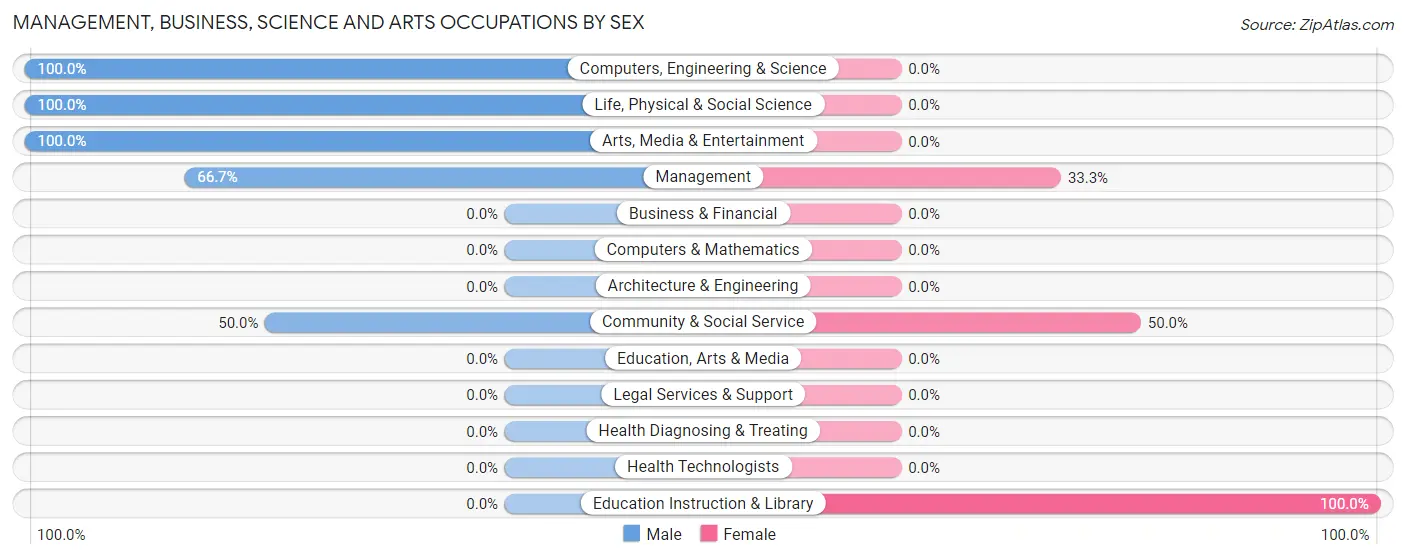
Management, Business, Science and Arts Occupations by Sex
Within the Management, Business, Science and Arts occupations in Tabiona, the most male-oriented occupations are Computers, Engineering & Science (100.0%), Life, Physical & Social Science (100.0%), and Arts, Media & Entertainment (100.0%), while the most female-oriented occupations are Education Instruction & Library (100.0%), Community & Social Service (50.0%), and Management (33.3%).
| Occupation | Male | Female |
| Management | 4 (66.7%) | 2 (33.3%) |
| Business & Financial | 0 (0.0%) | 0 (0.0%) |
| Computers, Engineering & Science | 2 (100.0%) | 0 (0.0%) |
| Computers & Mathematics | 0 (0.0%) | 0 (0.0%) |
| Architecture & Engineering | 0 (0.0%) | 0 (0.0%) |
| Life, Physical & Social Science | 2 (100.0%) | 0 (0.0%) |
| Community & Social Service | 3 (50.0%) | 3 (50.0%) |
| Education, Arts & Media | 0 (0.0%) | 0 (0.0%) |
| Legal Services & Support | 0 (0.0%) | 0 (0.0%) |
| Education Instruction & Library | 0 (0.0%) | 3 (100.0%) |
| Arts, Media & Entertainment | 3 (100.0%) | 0 (0.0%) |
| Health Diagnosing & Treating | 0 (0.0%) | 0 (0.0%) |
| Health Technologists | 0 (0.0%) | 0 (0.0%) |
| Total (Category) | 9 (64.3%) | 5 (35.7%) |
| Total (Overall) | 37 (57.8%) | 27 (42.2%) |
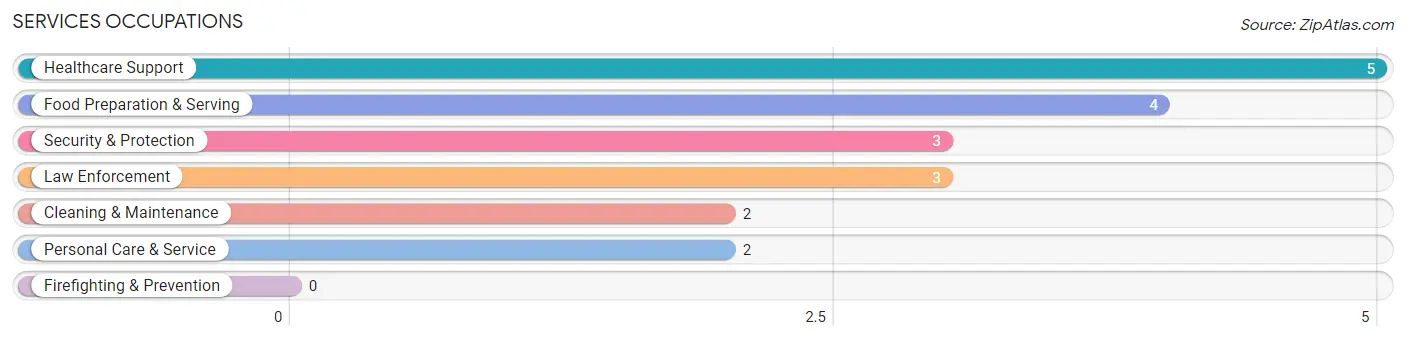
Services Occupations
The most common Services occupations in Tabiona are Healthcare Support (5 | 7.8%), Food Preparation & Serving (4 | 6.2%), Security & Protection (3 | 4.7%), Law Enforcement (3 | 4.7%), and Cleaning & Maintenance (2 | 3.1%).
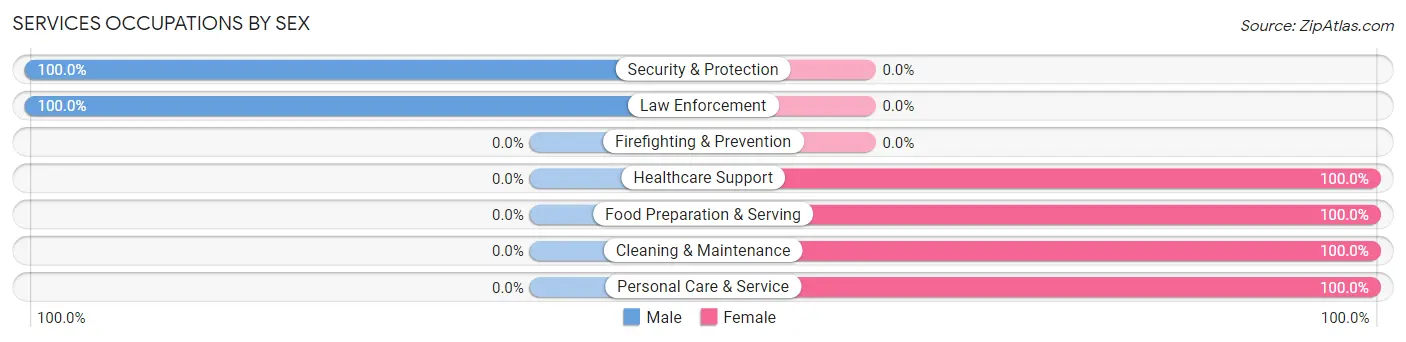
Services Occupations by Sex
Within the Services occupations in Tabiona, the most male-oriented occupations are Security & Protection (100.0%), and Law Enforcement (100.0%), while the most female-oriented occupations are Healthcare Support (100.0%), Food Preparation & Serving (100.0%), and Cleaning & Maintenance (100.0%).
| Occupation | Male | Female |
| Healthcare Support | 0 (0.0%) | 5 (100.0%) |
| Security & Protection | 3 (100.0%) | 0 (0.0%) |
| Firefighting & Prevention | 0 (0.0%) | 0 (0.0%) |
| Law Enforcement | 3 (100.0%) | 0 (0.0%) |
| Food Preparation & Serving | 0 (0.0%) | 4 (100.0%) |
| Cleaning & Maintenance | 0 (0.0%) | 2 (100.0%) |
| Personal Care & Service | 0 (0.0%) | 2 (100.0%) |
| Total (Category) | 3 (18.8%) | 13 (81.2%) |
| Total (Overall) | 37 (57.8%) | 27 (42.2%) |
Sales and Office Occupations
The most common Sales and Office occupations in Tabiona are Sales & Related (13 | 20.3%), and Office & Administration (4 | 6.2%).
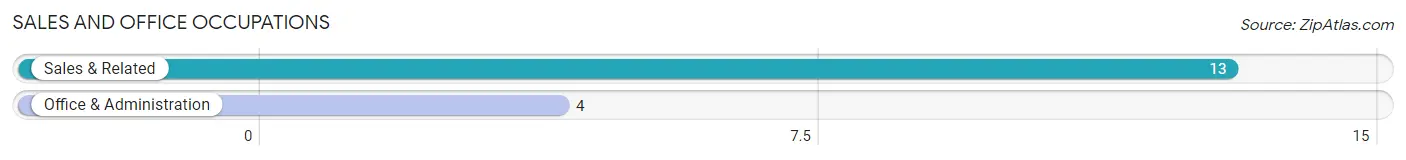
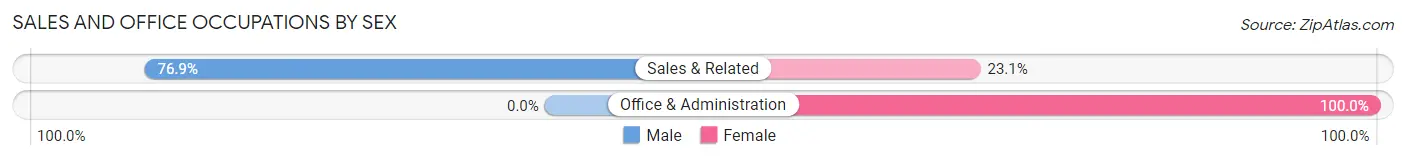
Sales and Office Occupations by Sex
| Occupation | Male | Female |
| Sales & Related | 10 (76.9%) | 3 (23.1%) |
| Office & Administration | 0 (0.0%) | 4 (100.0%) |
| Total (Category) | 10 (58.8%) | 7 (41.2%) |
| Total (Overall) | 37 (57.8%) | 27 (42.2%) |
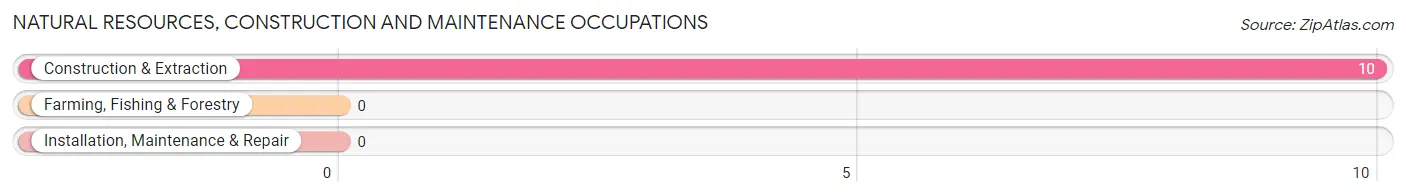
Natural Resources, Construction and Maintenance Occupations
The most common Natural Resources, Construction and Maintenance occupations in Tabiona are , and Construction & Extraction (10 | 15.6%).
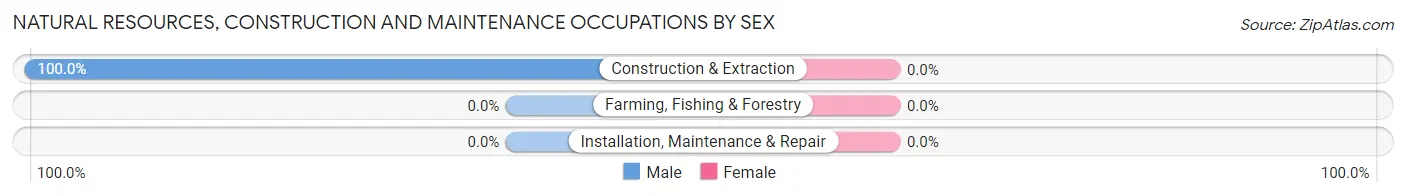
Natural Resources, Construction and Maintenance Occupations by Sex
| Occupation | Male | Female |
| Farming, Fishing & Forestry | 0 (0.0%) | 0 (0.0%) |
| Construction & Extraction | 10 (100.0%) | 0 (0.0%) |
| Installation, Maintenance & Repair | 0 (0.0%) | 0 (0.0%) |
| Total (Category) | 10 (100.0%) | 0 (0.0%) |
| Total (Overall) | 37 (57.8%) | 27 (42.2%) |
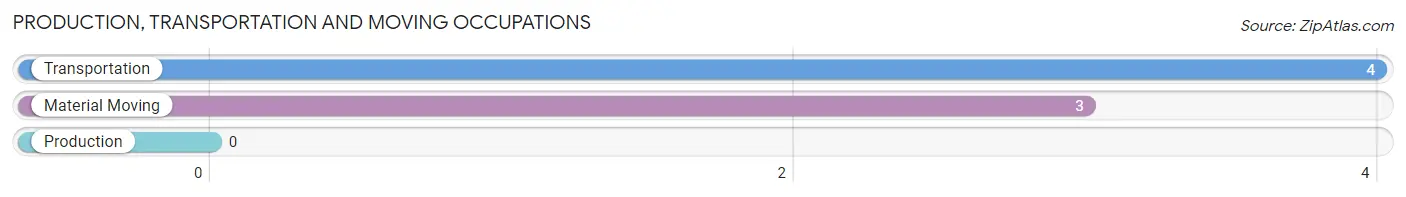
Production, Transportation and Moving Occupations
The most common Production, Transportation and Moving occupations in Tabiona are Transportation (4 | 6.2%), and Material Moving (3 | 4.7%).
Production, Transportation and Moving Occupations by Sex
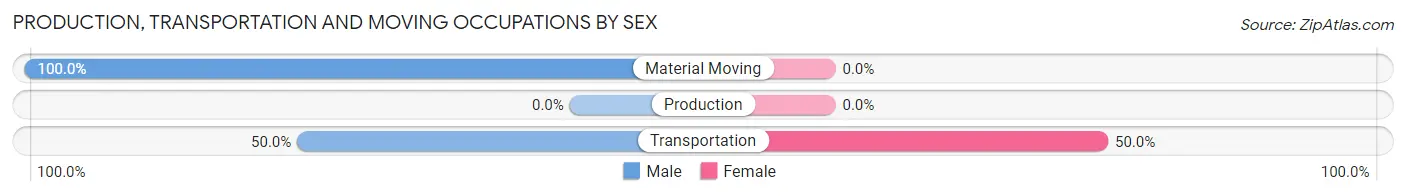
| Occupation | Male | Female |
| Production | 0 (0.0%) | 0 (0.0%) |
| Transportation | 2 (50.0%) | 2 (50.0%) |
| Material Moving | 3 (100.0%) | 0 (0.0%) |
| Total (Category) | 5 (71.4%) | 2 (28.6%) |
| Total (Overall) | 37 (57.8%) | 27 (42.2%) |
Employment Industries by Sex in Tabiona
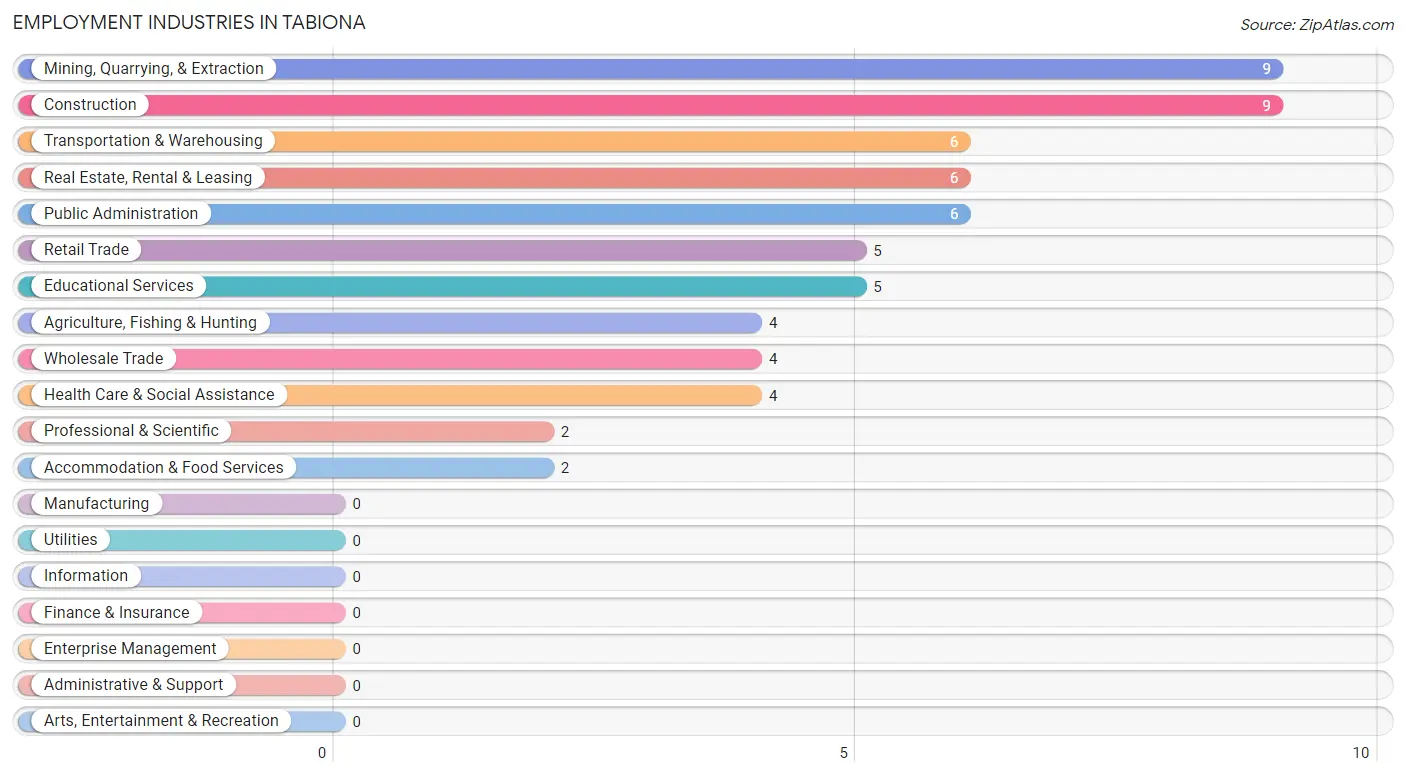
Employment Industries in Tabiona
The major employment industries in Tabiona include Mining, Quarrying, & Extraction (9 | 14.1%), Construction (9 | 14.1%), Transportation & Warehousing (6 | 9.4%), Real Estate, Rental & Leasing (6 | 9.4%), and Public Administration (6 | 9.4%).
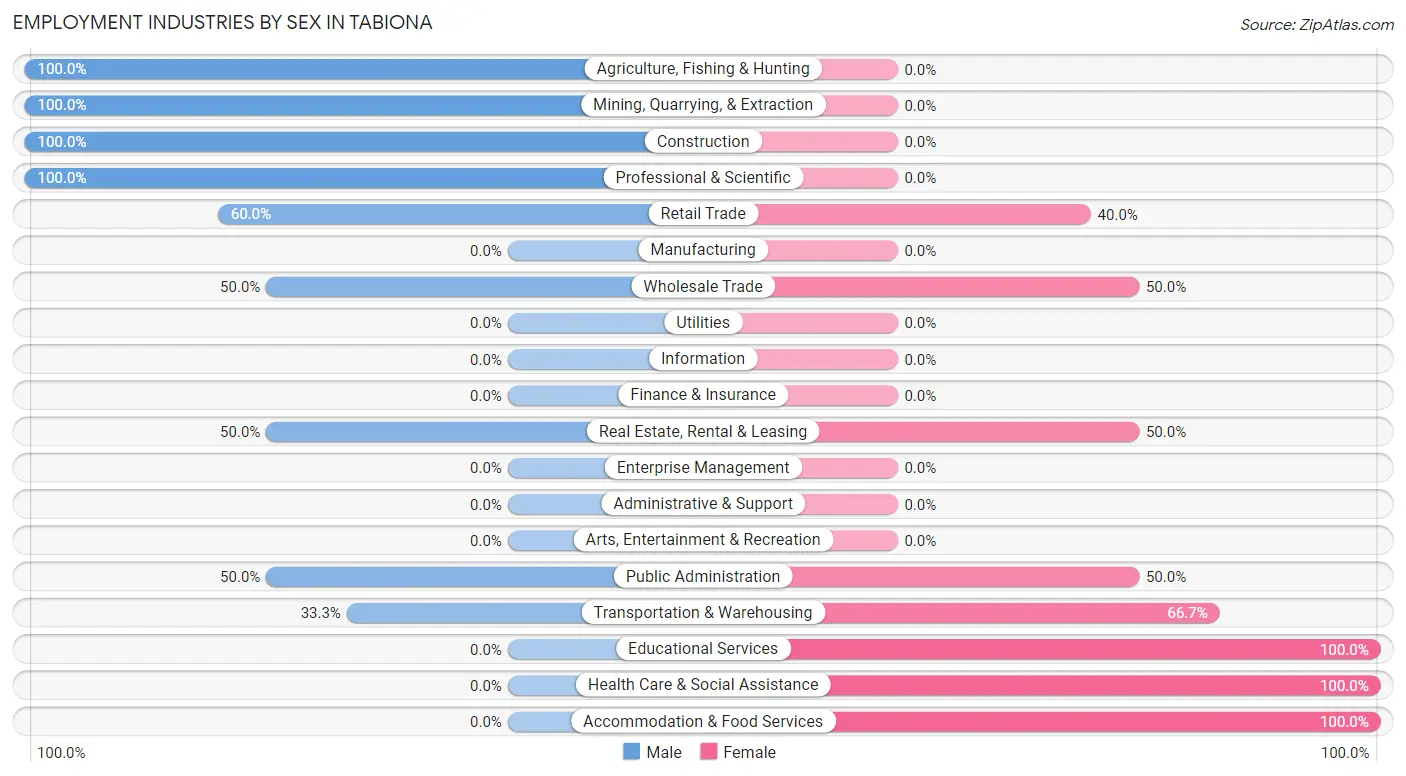
Employment Industries by Sex in Tabiona
The Tabiona industries that see more men than women are Agriculture, Fishing & Hunting (100.0%), Mining, Quarrying, & Extraction (100.0%), and Construction (100.0%), whereas the industries that tend to have a higher number of women are Educational Services (100.0%), Health Care & Social Assistance (100.0%), and Accommodation & Food Services (100.0%).
| Industry | Male | Female |
| Agriculture, Fishing & Hunting | 4 (100.0%) | 0 (0.0%) |
| Mining, Quarrying, & Extraction | 9 (100.0%) | 0 (0.0%) |
| Construction | 9 (100.0%) | 0 (0.0%) |
| Manufacturing | 0 (0.0%) | 0 (0.0%) |
| Wholesale Trade | 2 (50.0%) | 2 (50.0%) |
| Retail Trade | 3 (60.0%) | 2 (40.0%) |
| Transportation & Warehousing | 2 (33.3%) | 4 (66.7%) |
| Utilities | 0 (0.0%) | 0 (0.0%) |
| Information | 0 (0.0%) | 0 (0.0%) |
| Finance & Insurance | 0 (0.0%) | 0 (0.0%) |
| Real Estate, Rental & Leasing | 3 (50.0%) | 3 (50.0%) |
| Professional & Scientific | 2 (100.0%) | 0 (0.0%) |
| Enterprise Management | 0 (0.0%) | 0 (0.0%) |
| Administrative & Support | 0 (0.0%) | 0 (0.0%) |
| Educational Services | 0 (0.0%) | 5 (100.0%) |
| Health Care & Social Assistance | 0 (0.0%) | 4 (100.0%) |
| Arts, Entertainment & Recreation | 0 (0.0%) | 0 (0.0%) |
| Accommodation & Food Services | 0 (0.0%) | 2 (100.0%) |
| Public Administration | 3 (50.0%) | 3 (50.0%) |
| Total | 37 (57.8%) | 27 (42.2%) |
Education in Tabiona
School Enrollment in Tabiona
The most common levels of schooling among the 44 students in Tabiona are middle school (10 | 22.7%), nursery / preschool (9 | 20.4%), and elementary school (8 | 18.2%).
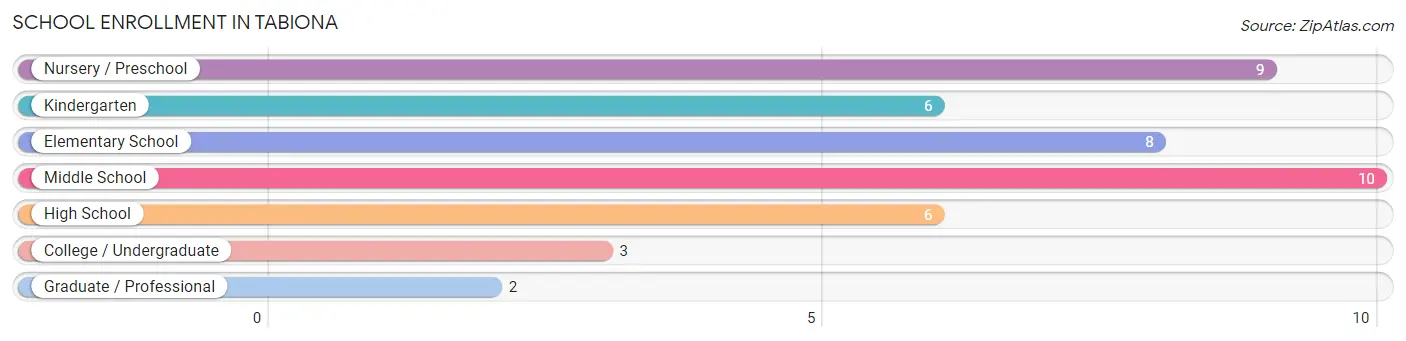
| School Level | # Students | % Students |
| Nursery / Preschool | 9 | 20.4% |
| Kindergarten | 6 | 13.6% |
| Elementary School | 8 | 18.2% |
| Middle School | 10 | 22.7% |
| High School | 6 | 13.6% |
| College / Undergraduate | 3 | 6.8% |
| Graduate / Professional | 2 | 4.5% |
| Total | 44 | 100.0% |
School Enrollment by Age by Funding Source in Tabiona
Out of a total of 44 students who are enrolled in schools in Tabiona, 2 (4.5%) attend a private institution, while the remaining 42 (95.5%) are enrolled in public schools. The age group of 35 years and over has the highest likelihood of being enrolled in private schools, with 2 (100.0% in the age bracket) enrolled. Conversely, the age group of 3 to 4 year olds has the lowest likelihood of being enrolled in a private school, with 9 (100.0% in the age bracket) attending a public institution.
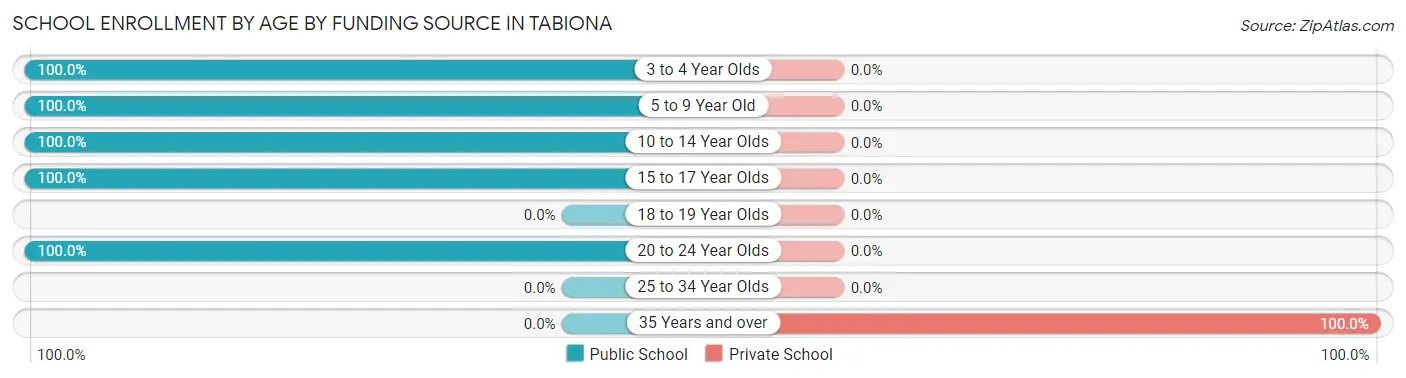
| Age Bracket | Public School | Private School |
| 3 to 4 Year Olds | 9 (100.0%) | 0 (0.0%) |
| 5 to 9 Year Old | 14 (100.0%) | 0 (0.0%) |
| 10 to 14 Year Olds | 10 (100.0%) | 0 (0.0%) |
| 15 to 17 Year Olds | 6 (100.0%) | 0 (0.0%) |
| 18 to 19 Year Olds | 0 (0.0%) | 0 (0.0%) |
| 20 to 24 Year Olds | 3 (100.0%) | 0 (0.0%) |
| 25 to 34 Year Olds | 0 (0.0%) | 0 (0.0%) |
| 35 Years and over | 0 (0.0%) | 2 (100.0%) |
| Total | 42 (95.5%) | 2 (4.5%) |
Educational Attainment by Field of Study in Tabiona
Business (3 | 60.0%), and computers & mathematics (2 | 40.0%) are the most common fields of study among 5 individuals in Tabiona who have obtained a bachelor's degree or higher.
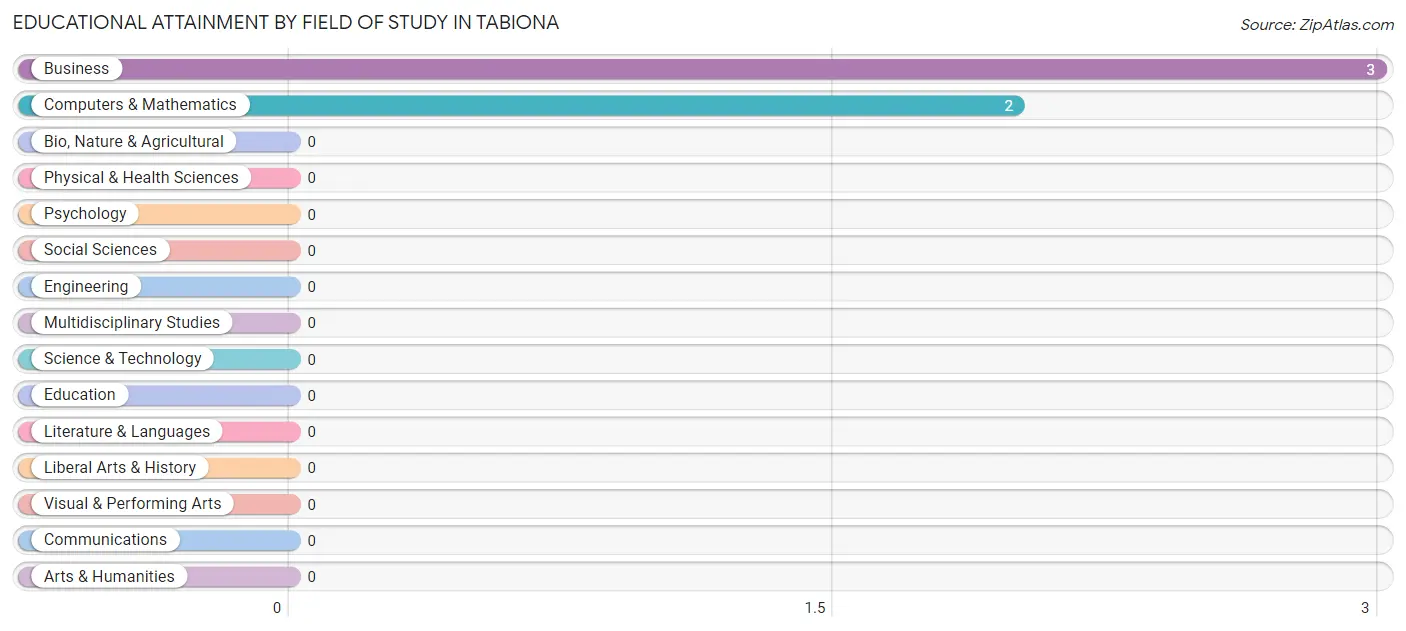
| Field of Study | # Graduates | % Graduates |
| Computers & Mathematics | 2 | 40.0% |
| Bio, Nature & Agricultural | 0 | 0.0% |
| Physical & Health Sciences | 0 | 0.0% |
| Psychology | 0 | 0.0% |
| Social Sciences | 0 | 0.0% |
| Engineering | 0 | 0.0% |
| Multidisciplinary Studies | 0 | 0.0% |
| Science & Technology | 0 | 0.0% |
| Business | 3 | 60.0% |
| Education | 0 | 0.0% |
| Literature & Languages | 0 | 0.0% |
| Liberal Arts & History | 0 | 0.0% |
| Visual & Performing Arts | 0 | 0.0% |
| Communications | 0 | 0.0% |
| Arts & Humanities | 0 | 0.0% |
| Total | 5 | 100.0% |
Transportation & Commute in Tabiona
Vehicle Availability by Sex in Tabiona
The most prevalent vehicle ownership categories in Tabiona are males with 4 vehicles (11, accounting for 29.7%) and females with 4 vehicles (6, making up 50.0%).
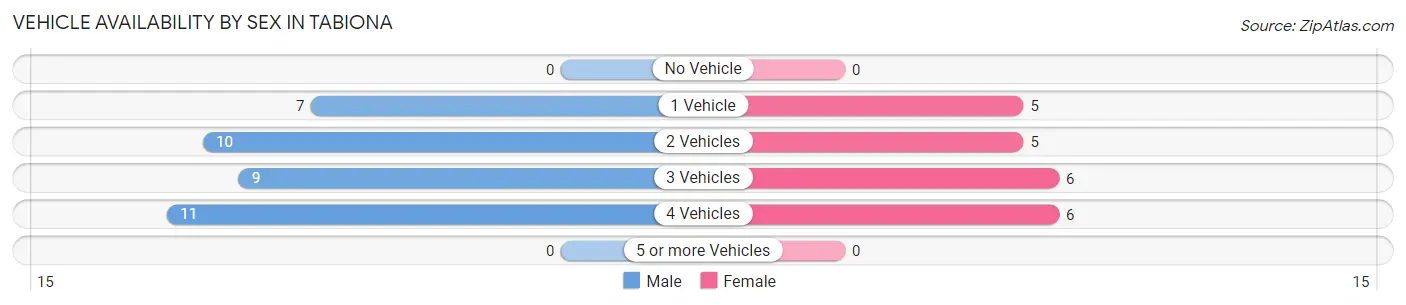
| Vehicles Available | Male | Female |
| No Vehicle | 0 (0.0%) | 0 (0.0%) |
| 1 Vehicle | 7 (18.9%) | 5 (22.7%) |
| 2 Vehicles | 10 (27.0%) | 5 (22.7%) |
| 3 Vehicles | 9 (24.3%) | 6 (27.3%) |
| 4 Vehicles | 11 (29.7%) | 6 (27.3%) |
| 5 or more Vehicles | 0 (0.0%) | 0 (0.0%) |
| Total | 37 (100.0%) | 22 (100.0%) |
Commute Time in Tabiona
The most frequently occuring commute durations in Tabiona are less than 5 minutes (11 commuters, 20.7%), 30 to 34 minutes (9 commuters, 17.0%), and 90 or more minutes (7 commuters, 13.2%).
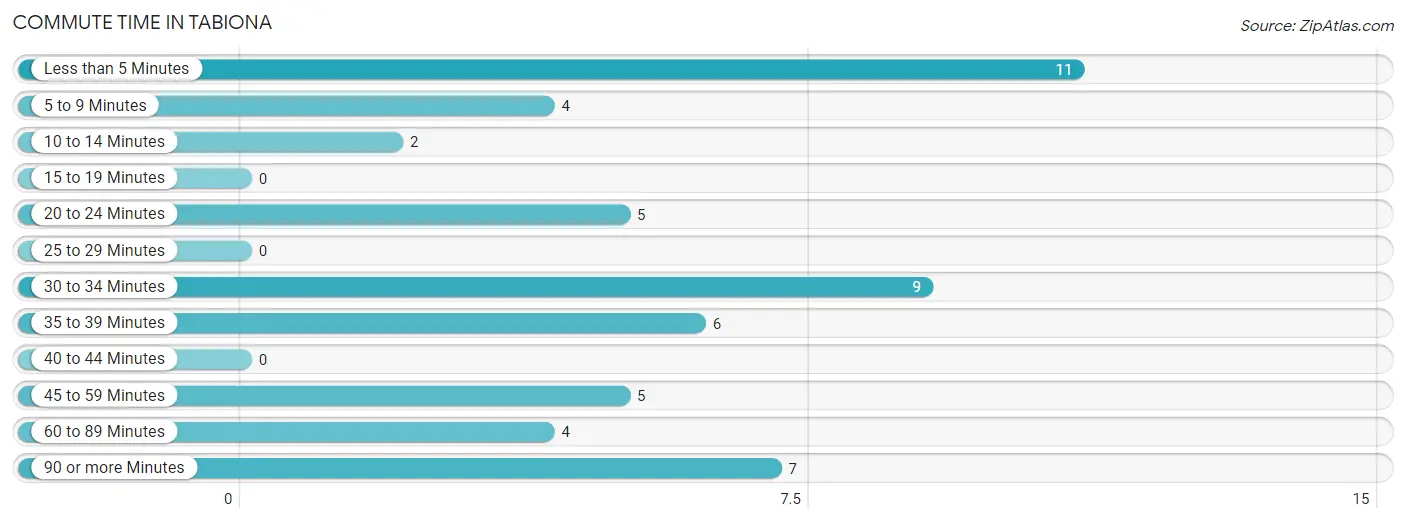
| Commute Time | # Commuters | % Commuters |
| Less than 5 Minutes | 11 | 20.7% |
| 5 to 9 Minutes | 4 | 7.5% |
| 10 to 14 Minutes | 2 | 3.8% |
| 15 to 19 Minutes | 0 | 0.0% |
| 20 to 24 Minutes | 5 | 9.4% |
| 25 to 29 Minutes | 0 | 0.0% |
| 30 to 34 Minutes | 9 | 17.0% |
| 35 to 39 Minutes | 6 | 11.3% |
| 40 to 44 Minutes | 0 | 0.0% |
| 45 to 59 Minutes | 5 | 9.4% |
| 60 to 89 Minutes | 4 | 7.5% |
| 90 or more Minutes | 7 | 13.2% |
Commute Time by Sex in Tabiona
The most common commute times in Tabiona are 30 to 34 minutes (9 commuters, 27.3%) for males and less than 5 minutes (9 commuters, 45.0%) for females.
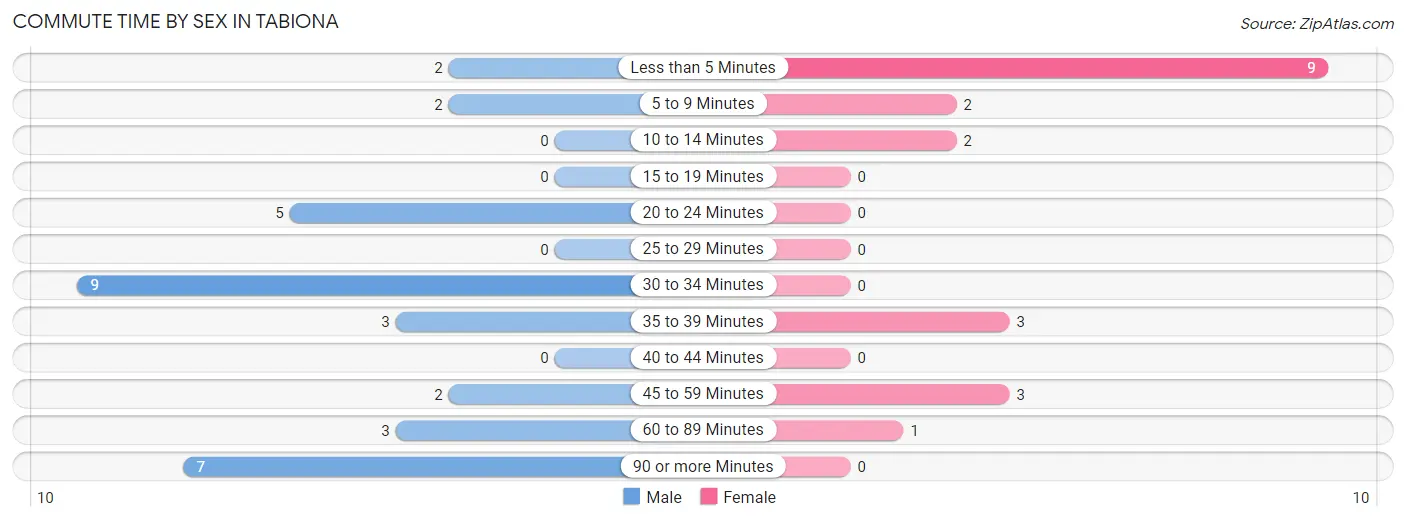
| Commute Time | Male | Female |
| Less than 5 Minutes | 2 (6.1%) | 9 (45.0%) |
| 5 to 9 Minutes | 2 (6.1%) | 2 (10.0%) |
| 10 to 14 Minutes | 0 (0.0%) | 2 (10.0%) |
| 15 to 19 Minutes | 0 (0.0%) | 0 (0.0%) |
| 20 to 24 Minutes | 5 (15.1%) | 0 (0.0%) |
| 25 to 29 Minutes | 0 (0.0%) | 0 (0.0%) |
| 30 to 34 Minutes | 9 (27.3%) | 0 (0.0%) |
| 35 to 39 Minutes | 3 (9.1%) | 3 (15.0%) |
| 40 to 44 Minutes | 0 (0.0%) | 0 (0.0%) |
| 45 to 59 Minutes | 2 (6.1%) | 3 (15.0%) |
| 60 to 89 Minutes | 3 (9.1%) | 1 (5.0%) |
| 90 or more Minutes | 7 (21.2%) | 0 (0.0%) |
Time of Departure to Work by Sex in Tabiona
The most frequent times of departure to work in Tabiona are 6:00 AM to 6:29 AM (10, 30.3%) for males and 6:00 AM to 6:29 AM (7, 35.0%) for females.
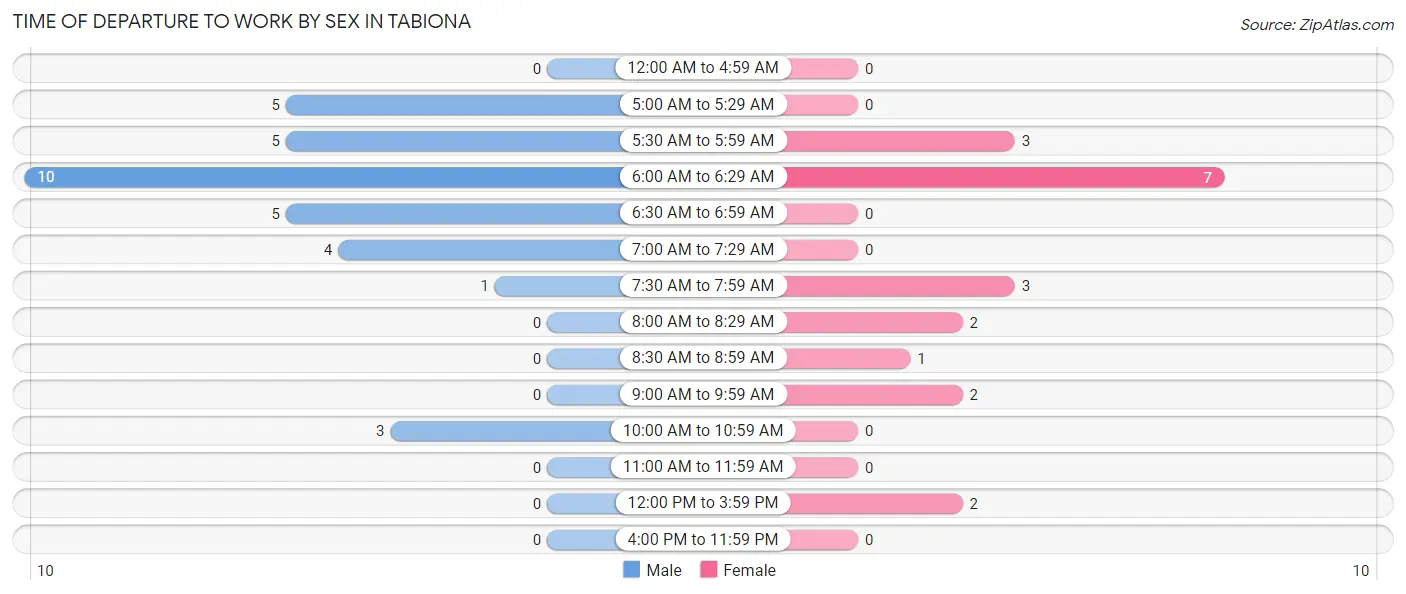
| Time of Departure | Male | Female |
| 12:00 AM to 4:59 AM | 0 (0.0%) | 0 (0.0%) |
| 5:00 AM to 5:29 AM | 5 (15.1%) | 0 (0.0%) |
| 5:30 AM to 5:59 AM | 5 (15.1%) | 3 (15.0%) |
| 6:00 AM to 6:29 AM | 10 (30.3%) | 7 (35.0%) |
| 6:30 AM to 6:59 AM | 5 (15.1%) | 0 (0.0%) |
| 7:00 AM to 7:29 AM | 4 (12.1%) | 0 (0.0%) |
| 7:30 AM to 7:59 AM | 1 (3.0%) | 3 (15.0%) |
| 8:00 AM to 8:29 AM | 0 (0.0%) | 2 (10.0%) |
| 8:30 AM to 8:59 AM | 0 (0.0%) | 1 (5.0%) |
| 9:00 AM to 9:59 AM | 0 (0.0%) | 2 (10.0%) |
| 10:00 AM to 10:59 AM | 3 (9.1%) | 0 (0.0%) |
| 11:00 AM to 11:59 AM | 0 (0.0%) | 0 (0.0%) |
| 12:00 PM to 3:59 PM | 0 (0.0%) | 2 (10.0%) |
| 4:00 PM to 11:59 PM | 0 (0.0%) | 0 (0.0%) |
| Total | 33 (100.0%) | 20 (100.0%) |
Housing Occupancy in Tabiona
Occupancy by Ownership in Tabiona
Of the total 56 dwellings in Tabiona, owner-occupied units account for 39 (69.6%), while renter-occupied units make up 17 (30.4%).
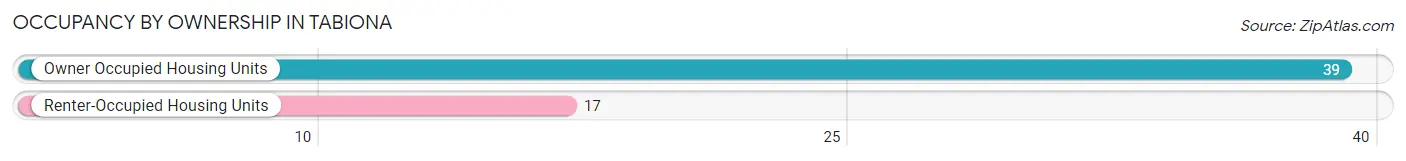
| Occupancy | # Housing Units | % Housing Units |
| Owner Occupied Housing Units | 39 | 69.6% |
| Renter-Occupied Housing Units | 17 | 30.4% |
| Total Occupied Housing Units | 56 | 100.0% |
Occupancy by Household Size in Tabiona
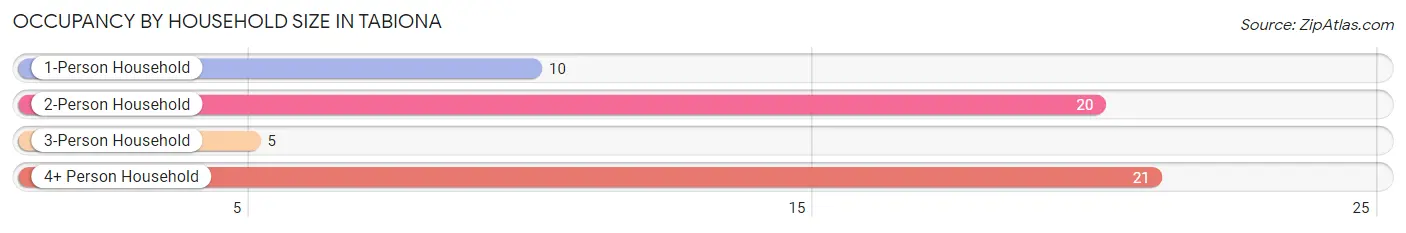
| Household Size | # Housing Units | % Housing Units |
| 1-Person Household | 10 | 17.9% |
| 2-Person Household | 20 | 35.7% |
| 3-Person Household | 5 | 8.9% |
| 4+ Person Household | 21 | 37.5% |
| Total Housing Units | 56 | 100.0% |
Occupancy by Ownership by Household Size in Tabiona
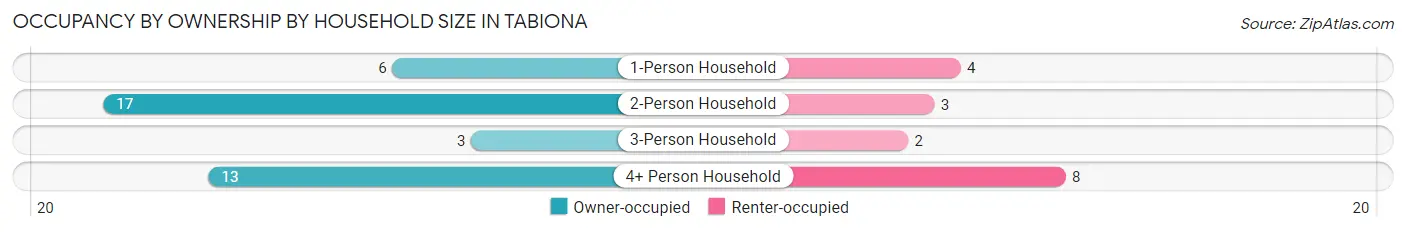
| Household Size | Owner-occupied | Renter-occupied |
| 1-Person Household | 6 (60.0%) | 4 (40.0%) |
| 2-Person Household | 17 (85.0%) | 3 (15.0%) |
| 3-Person Household | 3 (60.0%) | 2 (40.0%) |
| 4+ Person Household | 13 (61.9%) | 8 (38.1%) |
| Total Housing Units | 39 (69.6%) | 17 (30.4%) |
Occupancy by Educational Attainment in Tabiona
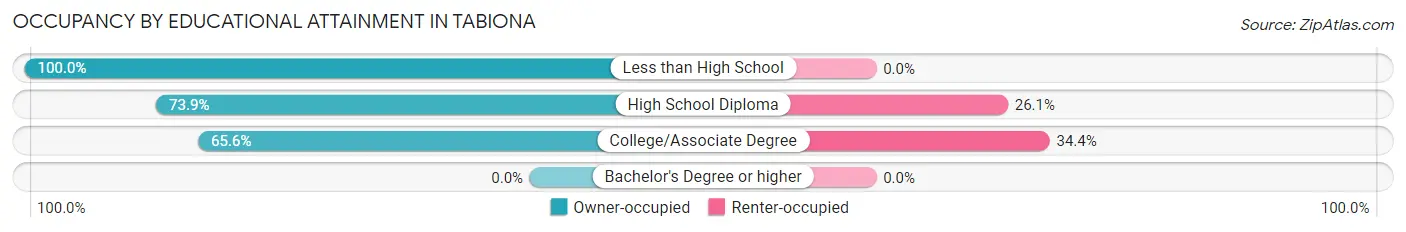
| Household Size | Owner-occupied | Renter-occupied |
| Less than High School | 1 (100.0%) | 0 (0.0%) |
| High School Diploma | 17 (73.9%) | 6 (26.1%) |
| College/Associate Degree | 21 (65.6%) | 11 (34.4%) |
| Bachelor's Degree or higher | 0 (0.0%) | 0 (0.0%) |
Occupancy by Age of Householder in Tabiona
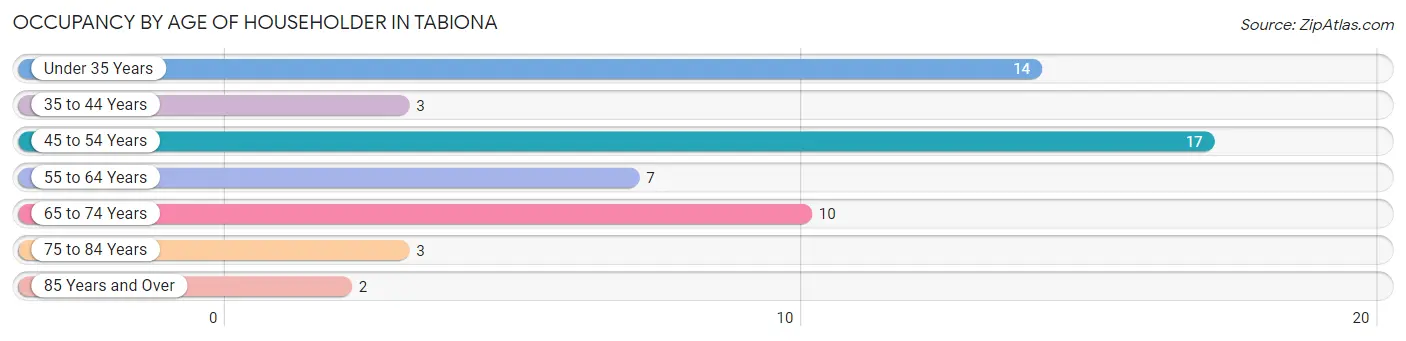
| Age Bracket | # Households | % Households |
| Under 35 Years | 14 | 25.0% |
| 35 to 44 Years | 3 | 5.4% |
| 45 to 54 Years | 17 | 30.4% |
| 55 to 64 Years | 7 | 12.5% |
| 65 to 74 Years | 10 | 17.9% |
| 75 to 84 Years | 3 | 5.4% |
| 85 Years and Over | 2 | 3.6% |
| Total | 56 | 100.0% |
Housing Finances in Tabiona
Median Income by Occupancy in Tabiona
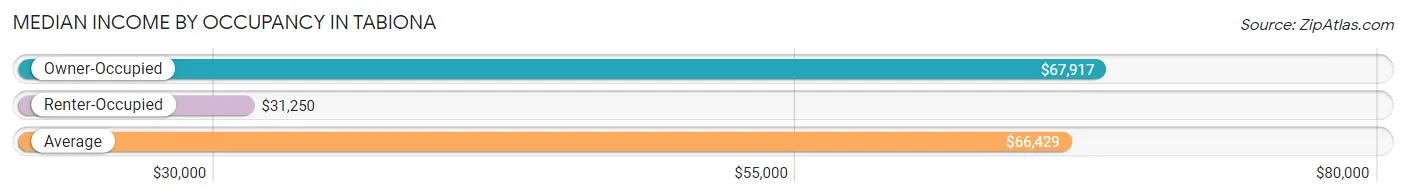
| Occupancy Type | # Households | Median Income |
| Owner-Occupied | 39 (69.6%) | $67,917 |
| Renter-Occupied | 17 (30.4%) | $31,250 |
| Average | 56 (100.0%) | $66,429 |
Occupancy by Householder Income Bracket in Tabiona
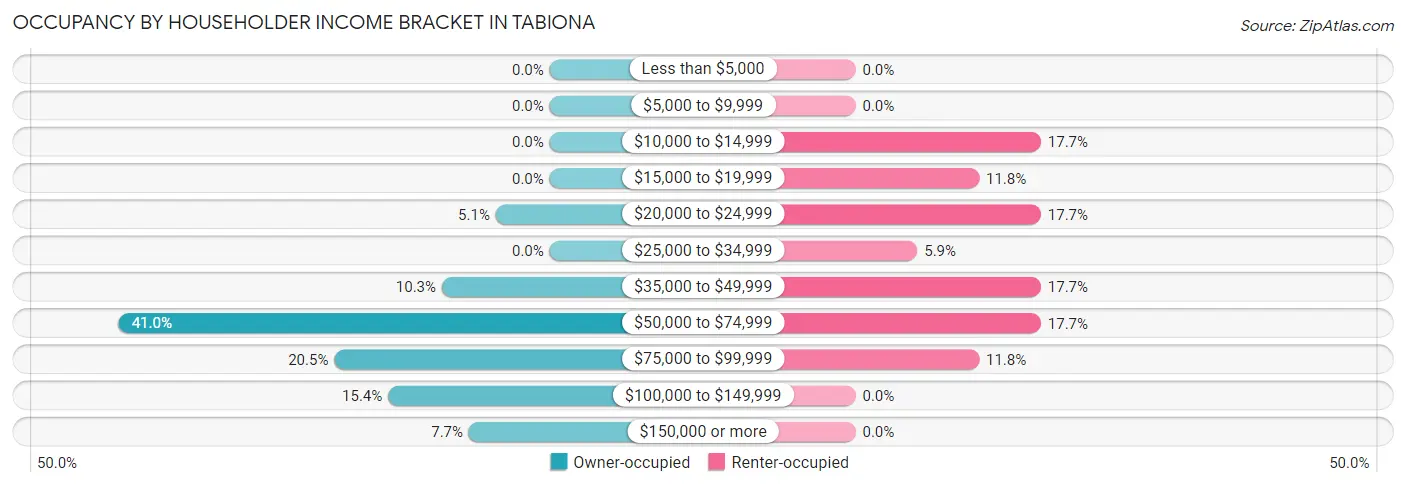
| Income Bracket | Owner-occupied | Renter-occupied |
| Less than $5,000 | 0 (0.0%) | 0 (0.0%) |
| $5,000 to $9,999 | 0 (0.0%) | 0 (0.0%) |
| $10,000 to $14,999 | 0 (0.0%) | 3 (17.6%) |
| $15,000 to $19,999 | 0 (0.0%) | 2 (11.8%) |
| $20,000 to $24,999 | 2 (5.1%) | 3 (17.6%) |
| $25,000 to $34,999 | 0 (0.0%) | 1 (5.9%) |
| $35,000 to $49,999 | 4 (10.3%) | 3 (17.6%) |
| $50,000 to $74,999 | 16 (41.0%) | 3 (17.6%) |
| $75,000 to $99,999 | 8 (20.5%) | 2 (11.8%) |
| $100,000 to $149,999 | 6 (15.4%) | 0 (0.0%) |
| $150,000 or more | 3 (7.7%) | 0 (0.0%) |
| Total | 39 (100.0%) | 17 (100.0%) |
Monthly Housing Cost Tiers in Tabiona
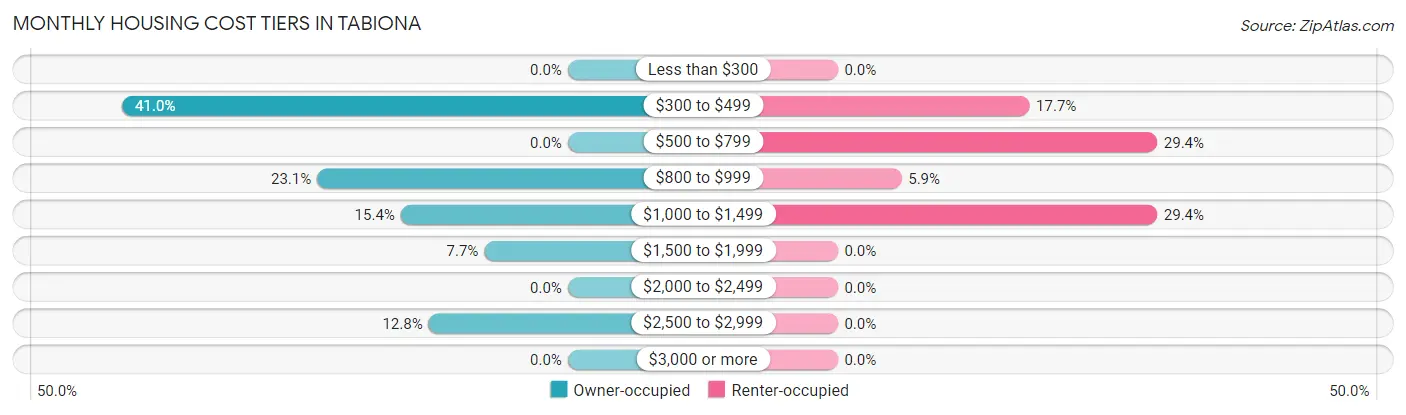
| Monthly Cost | Owner-occupied | Renter-occupied |
| Less than $300 | 0 (0.0%) | 0 (0.0%) |
| $300 to $499 | 16 (41.0%) | 3 (17.6%) |
| $500 to $799 | 0 (0.0%) | 5 (29.4%) |
| $800 to $999 | 9 (23.1%) | 1 (5.9%) |
| $1,000 to $1,499 | 6 (15.4%) | 5 (29.4%) |
| $1,500 to $1,999 | 3 (7.7%) | 0 (0.0%) |
| $2,000 to $2,499 | 0 (0.0%) | 0 (0.0%) |
| $2,500 to $2,999 | 5 (12.8%) | 0 (0.0%) |
| $3,000 or more | 0 (0.0%) | 0 (0.0%) |
| Total | 39 (100.0%) | 17 (100.0%) |
Physical Housing Characteristics in Tabiona
Housing Structures in Tabiona
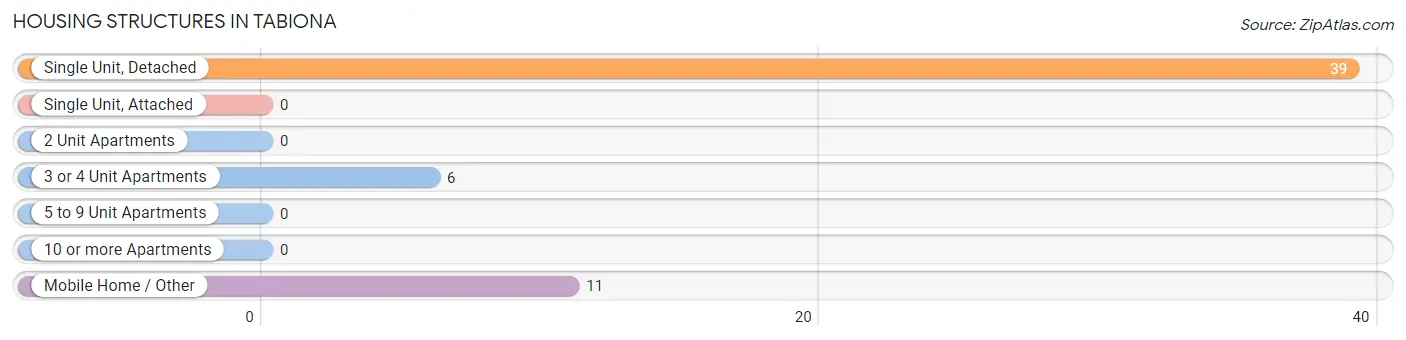
| Structure Type | # Housing Units | % Housing Units |
| Single Unit, Detached | 39 | 69.6% |
| Single Unit, Attached | 0 | 0.0% |
| 2 Unit Apartments | 0 | 0.0% |
| 3 or 4 Unit Apartments | 6 | 10.7% |
| 5 to 9 Unit Apartments | 0 | 0.0% |
| 10 or more Apartments | 0 | 0.0% |
| Mobile Home / Other | 11 | 19.6% |
| Total | 56 | 100.0% |
Housing Structures by Occupancy in Tabiona
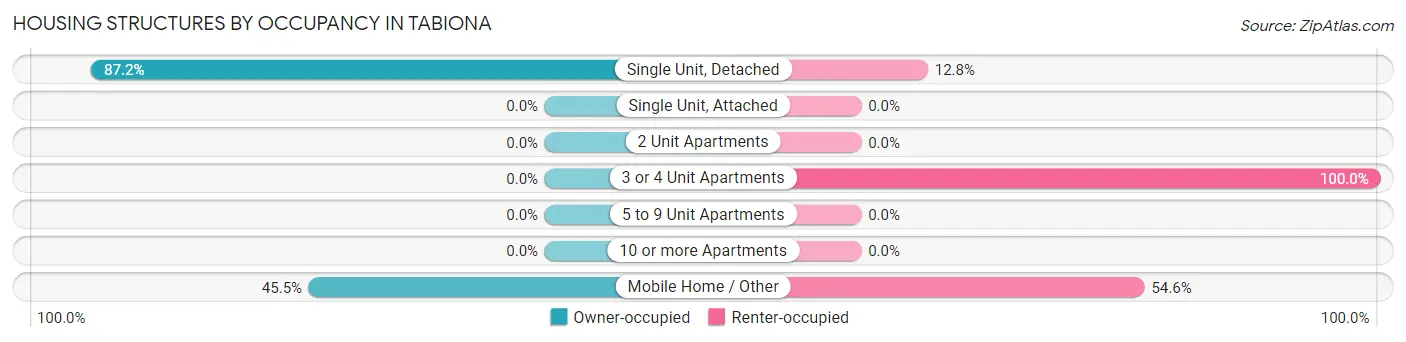
| Structure Type | Owner-occupied | Renter-occupied |
| Single Unit, Detached | 34 (87.2%) | 5 (12.8%) |
| Single Unit, Attached | 0 (0.0%) | 0 (0.0%) |
| 2 Unit Apartments | 0 (0.0%) | 0 (0.0%) |
| 3 or 4 Unit Apartments | 0 (0.0%) | 6 (100.0%) |
| 5 to 9 Unit Apartments | 0 (0.0%) | 0 (0.0%) |
| 10 or more Apartments | 0 (0.0%) | 0 (0.0%) |
| Mobile Home / Other | 5 (45.5%) | 6 (54.5%) |
| Total | 39 (69.6%) | 17 (30.4%) |
Housing Structures by Number of Rooms in Tabiona
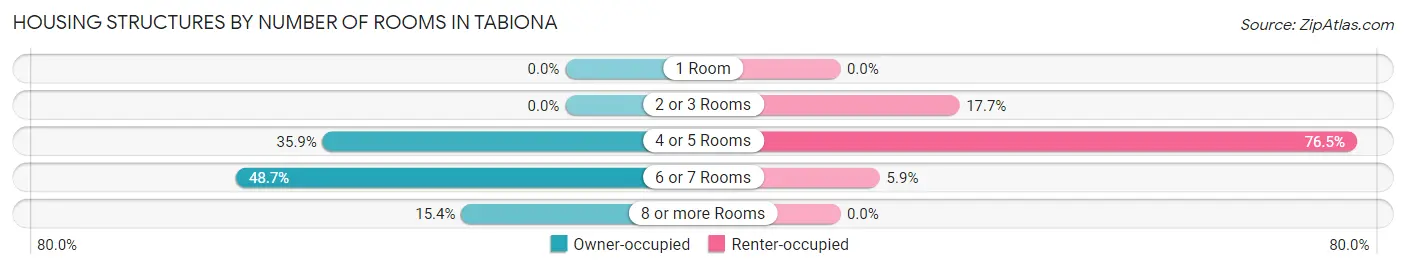
| Number of Rooms | Owner-occupied | Renter-occupied |
| 1 Room | 0 (0.0%) | 0 (0.0%) |
| 2 or 3 Rooms | 0 (0.0%) | 3 (17.6%) |
| 4 or 5 Rooms | 14 (35.9%) | 13 (76.5%) |
| 6 or 7 Rooms | 19 (48.7%) | 1 (5.9%) |
| 8 or more Rooms | 6 (15.4%) | 0 (0.0%) |
| Total | 39 (100.0%) | 17 (100.0%) |
Housing Structure by Heating Type in Tabiona
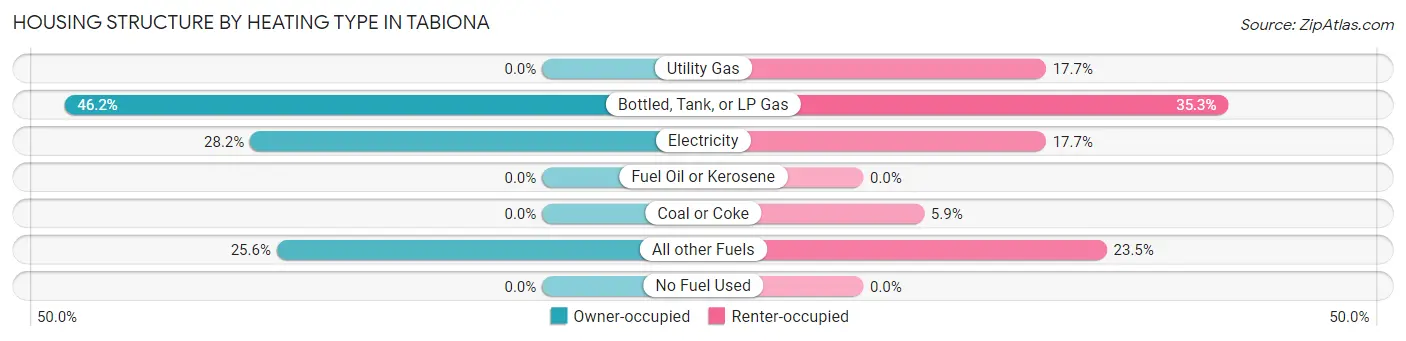
| Heating Type | Owner-occupied | Renter-occupied |
| Utility Gas | 0 (0.0%) | 3 (17.6%) |
| Bottled, Tank, or LP Gas | 18 (46.2%) | 6 (35.3%) |
| Electricity | 11 (28.2%) | 3 (17.6%) |
| Fuel Oil or Kerosene | 0 (0.0%) | 0 (0.0%) |
| Coal or Coke | 0 (0.0%) | 1 (5.9%) |
| All other Fuels | 10 (25.6%) | 4 (23.5%) |
| No Fuel Used | 0 (0.0%) | 0 (0.0%) |
| Total | 39 (100.0%) | 17 (100.0%) |
Household Vehicle Usage in Tabiona
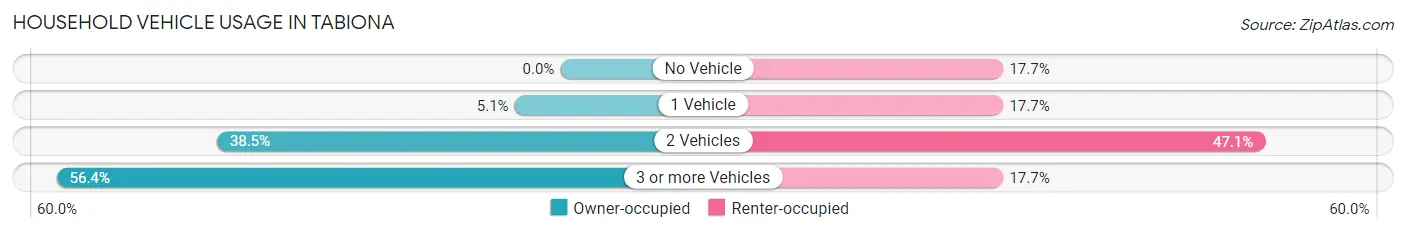
| Vehicles per Household | Owner-occupied | Renter-occupied |
| No Vehicle | 0 (0.0%) | 3 (17.6%) |
| 1 Vehicle | 2 (5.1%) | 3 (17.6%) |
| 2 Vehicles | 15 (38.5%) | 8 (47.1%) |
| 3 or more Vehicles | 22 (56.4%) | 3 (17.6%) |
| Total | 39 (100.0%) | 17 (100.0%) |
Real Estate & Mortgages in Tabiona
Real Estate and Mortgage Overview in Tabiona
| Characteristic | Without Mortgage | With Mortgage |
| Housing Units | 16 | 23 |
| Median Property Value | $250,000 | $212,500 |
| Median Household Income | $53,750 | $3 |
| Monthly Housing Costs | $344 | $0 |
| Real Estate Taxes | $1,031 | $2 |
Property Value by Mortgage Status in Tabiona
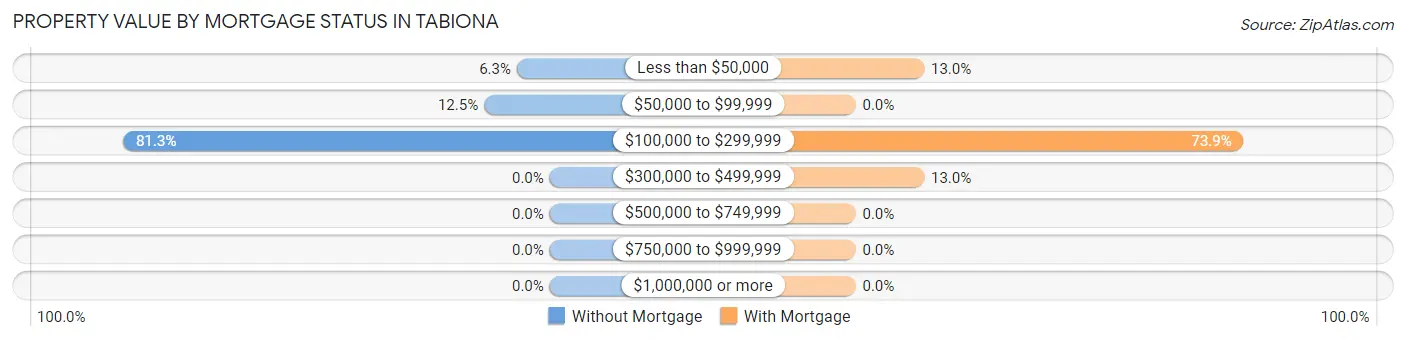
| Property Value | Without Mortgage | With Mortgage |
| Less than $50,000 | 1 (6.2%) | 3 (13.0%) |
| $50,000 to $99,999 | 2 (12.5%) | 0 (0.0%) |
| $100,000 to $299,999 | 13 (81.2%) | 17 (73.9%) |
| $300,000 to $499,999 | 0 (0.0%) | 3 (13.0%) |
| $500,000 to $749,999 | 0 (0.0%) | 0 (0.0%) |
| $750,000 to $999,999 | 0 (0.0%) | 0 (0.0%) |
| $1,000,000 or more | 0 (0.0%) | 0 (0.0%) |
| Total | 16 (100.0%) | 23 (100.0%) |
Household Income by Mortgage Status in Tabiona
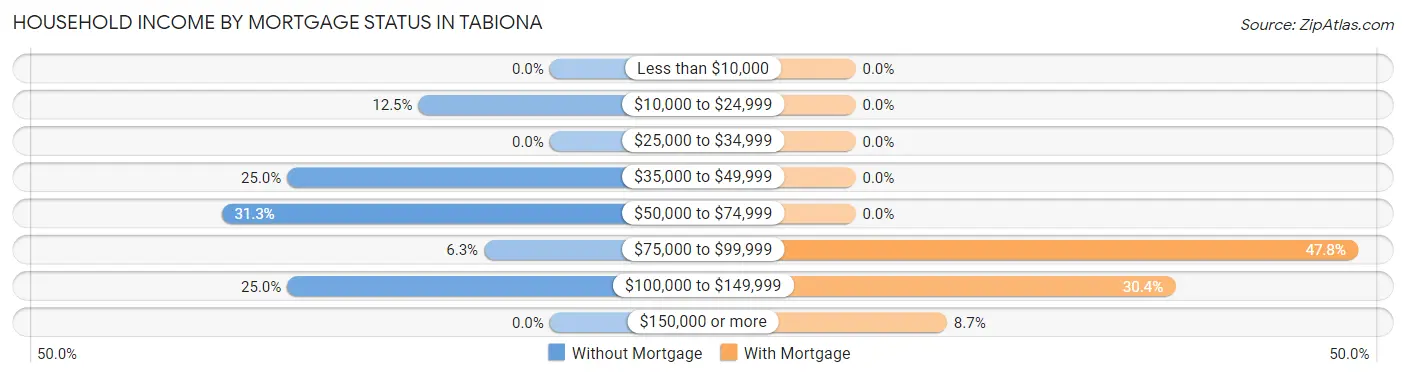
| Household Income | Without Mortgage | With Mortgage |
| Less than $10,000 | 0 (0.0%) | 0 (0.0%) |
| $10,000 to $24,999 | 2 (12.5%) | 0 (0.0%) |
| $25,000 to $34,999 | 0 (0.0%) | 0 (0.0%) |
| $35,000 to $49,999 | 4 (25.0%) | 0 (0.0%) |
| $50,000 to $74,999 | 5 (31.2%) | 0 (0.0%) |
| $75,000 to $99,999 | 1 (6.2%) | 11 (47.8%) |
| $100,000 to $149,999 | 4 (25.0%) | 7 (30.4%) |
| $150,000 or more | 0 (0.0%) | 2 (8.7%) |
| Total | 16 (100.0%) | 23 (100.0%) |
Property Value to Household Income Ratio in Tabiona
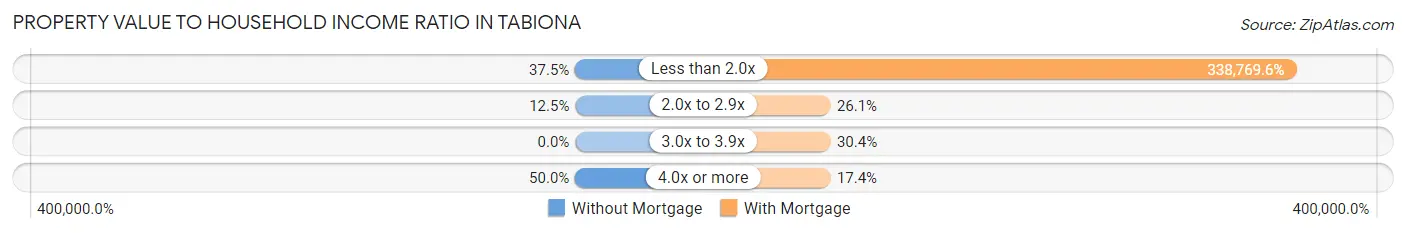
| Value-to-Income Ratio | Without Mortgage | With Mortgage |
| Less than 2.0x | 6 (37.5%) | 77,917 (338,769.6%) |
| 2.0x to 2.9x | 2 (12.5%) | 6 (26.1%) |
| 3.0x to 3.9x | 0 (0.0%) | 7 (30.4%) |
| 4.0x or more | 8 (50.0%) | 4 (17.4%) |
| Total | 16 (100.0%) | 23 (100.0%) |
Real Estate Taxes by Mortgage Status in Tabiona
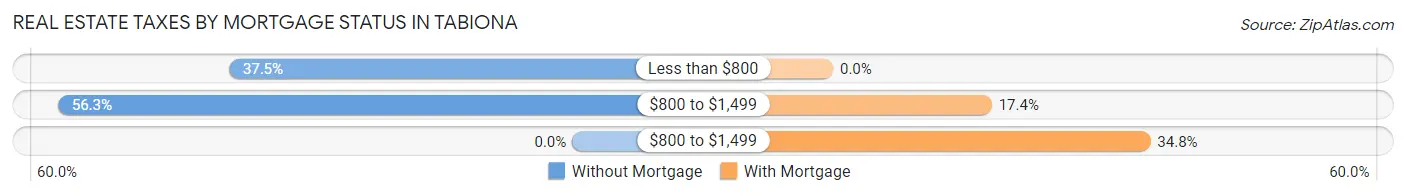
| Property Taxes | Without Mortgage | With Mortgage |
| Less than $800 | 6 (37.5%) | 0 (0.0%) |
| $800 to $1,499 | 9 (56.2%) | 4 (17.4%) |
| $800 to $1,499 | 0 (0.0%) | 8 (34.8%) |
| Total | 16 (100.0%) | 23 (100.0%) |
Health & Disability in Tabiona
Health Insurance Coverage by Age in Tabiona
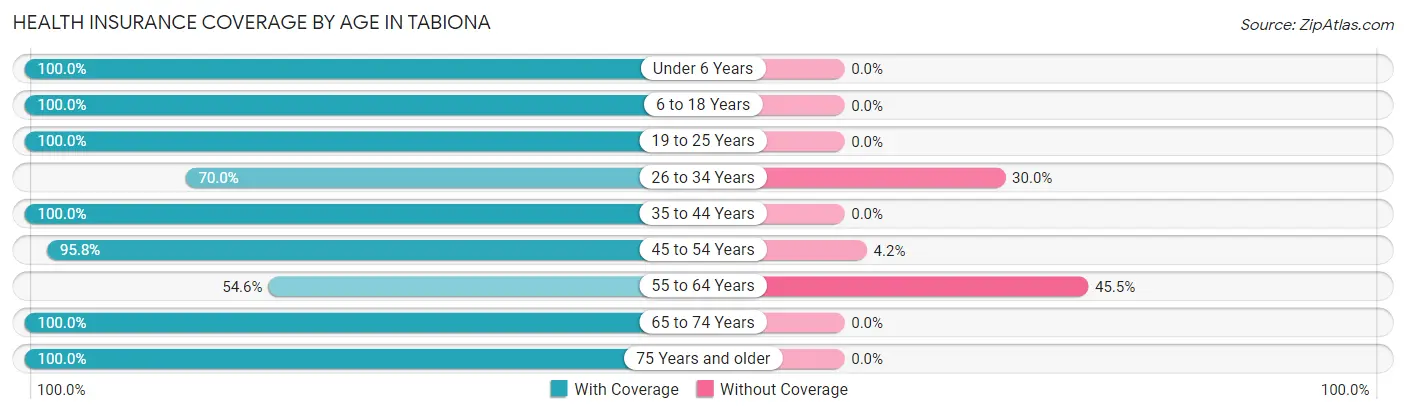
| Age Bracket | With Coverage | Without Coverage |
| Under 6 Years | 27 (100.0%) | 0 (0.0%) |
| 6 to 18 Years | 30 (100.0%) | 0 (0.0%) |
| 19 to 25 Years | 13 (100.0%) | 0 (0.0%) |
| 26 to 34 Years | 14 (70.0%) | 6 (30.0%) |
| 35 to 44 Years | 7 (100.0%) | 0 (0.0%) |
| 45 to 54 Years | 23 (95.8%) | 1 (4.2%) |
| 55 to 64 Years | 6 (54.5%) | 5 (45.5%) |
| 65 to 74 Years | 16 (100.0%) | 0 (0.0%) |
| 75 Years and older | 8 (100.0%) | 0 (0.0%) |
| Total | 144 (92.3%) | 12 (7.7%) |
Health Insurance Coverage by Citizenship Status in Tabiona
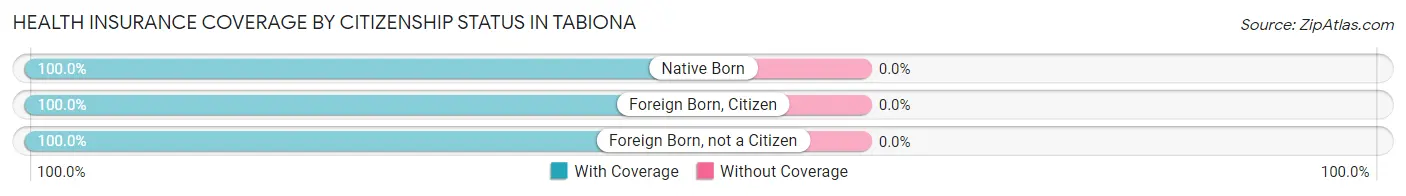
| Citizenship Status | With Coverage | Without Coverage |
| Native Born | 27 (100.0%) | 0 (0.0%) |
| Foreign Born, Citizen | 30 (100.0%) | 0 (0.0%) |
| Foreign Born, not a Citizen | 13 (100.0%) | 0 (0.0%) |
Health Insurance Coverage by Household Income in Tabiona
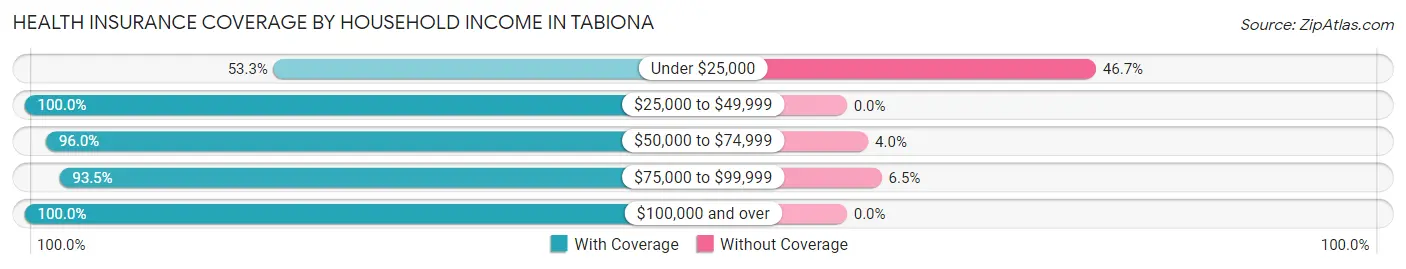
| Household Income | With Coverage | Without Coverage |
| Under $25,000 | 8 (53.3%) | 7 (46.7%) |
| $25,000 to $49,999 | 18 (100.0%) | 0 (0.0%) |
| $50,000 to $74,999 | 48 (96.0%) | 2 (4.0%) |
| $75,000 to $99,999 | 43 (93.5%) | 3 (6.5%) |
| $100,000 and over | 27 (100.0%) | 0 (0.0%) |
Public vs Private Health Insurance Coverage by Age in Tabiona
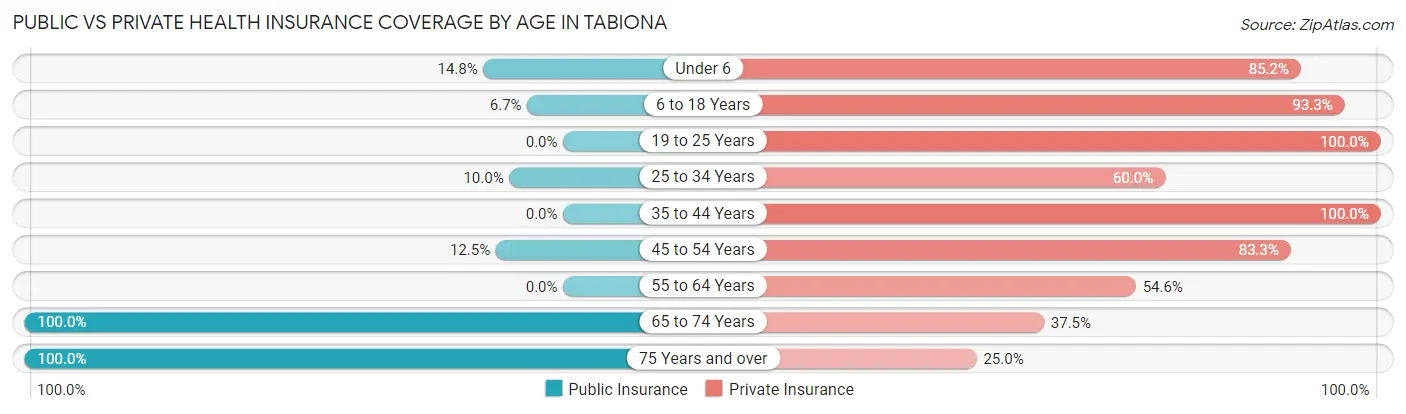
| Age Bracket | Public Insurance | Private Insurance |
| Under 6 | 4 (14.8%) | 23 (85.2%) |
| 6 to 18 Years | 2 (6.7%) | 28 (93.3%) |
| 19 to 25 Years | 0 (0.0%) | 13 (100.0%) |
| 25 to 34 Years | 2 (10.0%) | 12 (60.0%) |
| 35 to 44 Years | 0 (0.0%) | 7 (100.0%) |
| 45 to 54 Years | 3 (12.5%) | 20 (83.3%) |
| 55 to 64 Years | 0 (0.0%) | 6 (54.5%) |
| 65 to 74 Years | 16 (100.0%) | 6 (37.5%) |
| 75 Years and over | 8 (100.0%) | 2 (25.0%) |
| Total | 35 (22.4%) | 117 (75.0%) |
Disability Status by Sex by Age in Tabiona
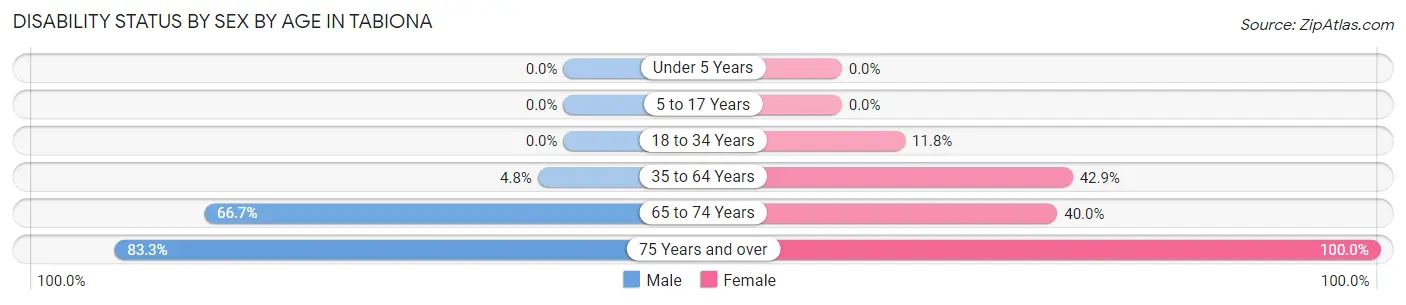
| Age Bracket | Male | Female |
| Under 5 Years | 0 (0.0%) | 0 (0.0%) |
| 5 to 17 Years | 0 (0.0%) | 0 (0.0%) |
| 18 to 34 Years | 0 (0.0%) | 2 (11.8%) |
| 35 to 64 Years | 1 (4.8%) | 9 (42.9%) |
| 65 to 74 Years | 4 (66.7%) | 4 (40.0%) |
| 75 Years and over | 5 (83.3%) | 2 (100.0%) |
Disability Class by Sex by Age in Tabiona
Disability Class: Hearing Difficulty
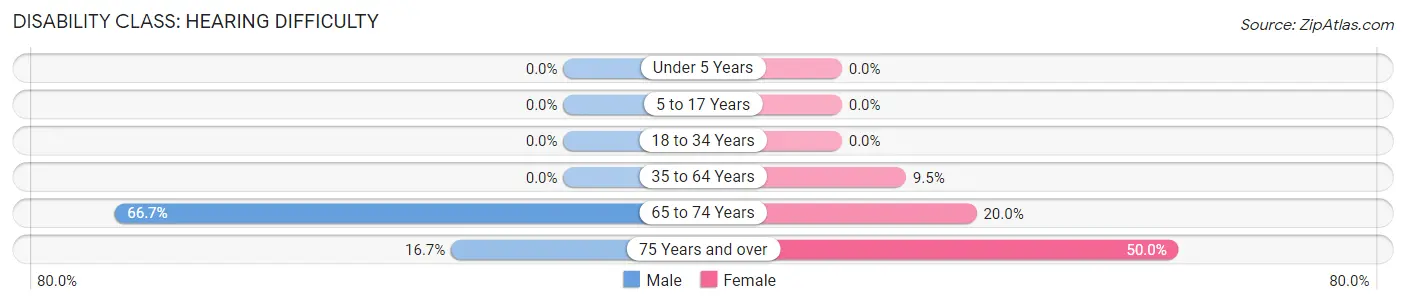
| Age Bracket | Male | Female |
| Under 5 Years | 0 (0.0%) | 0 (0.0%) |
| 5 to 17 Years | 0 (0.0%) | 0 (0.0%) |
| 18 to 34 Years | 0 (0.0%) | 0 (0.0%) |
| 35 to 64 Years | 0 (0.0%) | 2 (9.5%) |
| 65 to 74 Years | 4 (66.7%) | 2 (20.0%) |
| 75 Years and over | 1 (16.7%) | 1 (50.0%) |
Disability Class: Vision Difficulty
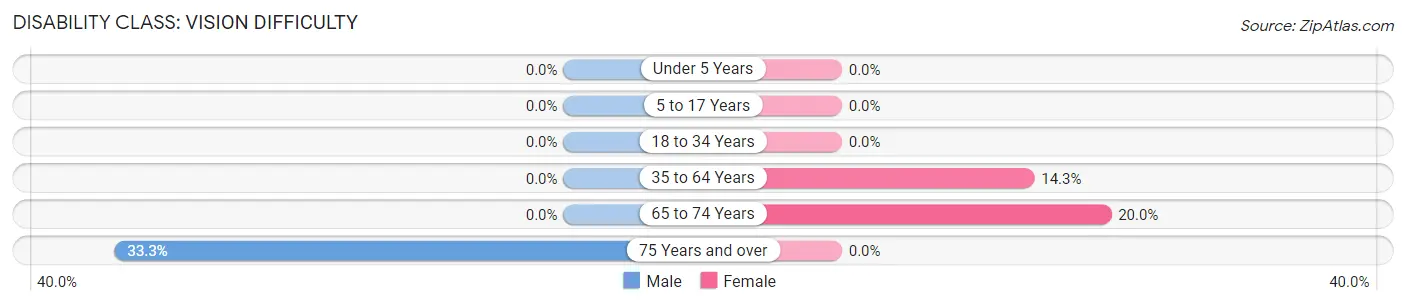
| Age Bracket | Male | Female |
| Under 5 Years | 0 (0.0%) | 0 (0.0%) |
| 5 to 17 Years | 0 (0.0%) | 0 (0.0%) |
| 18 to 34 Years | 0 (0.0%) | 0 (0.0%) |
| 35 to 64 Years | 0 (0.0%) | 3 (14.3%) |
| 65 to 74 Years | 0 (0.0%) | 2 (20.0%) |
| 75 Years and over | 2 (33.3%) | 0 (0.0%) |
Disability Class: Cognitive Difficulty
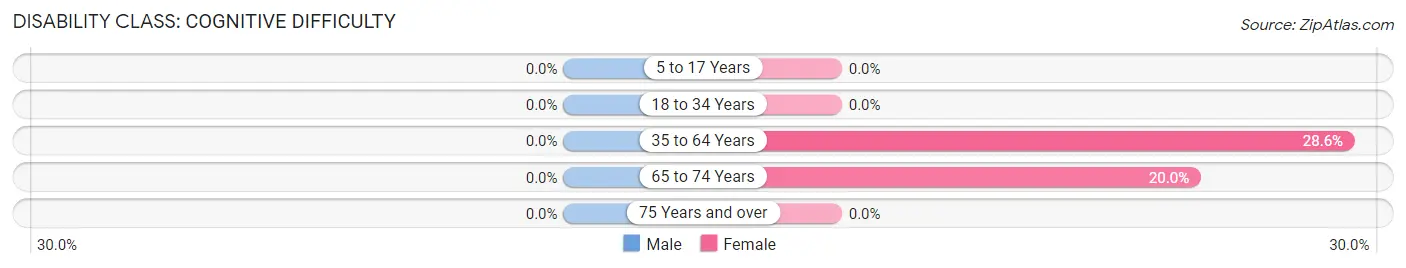
| Age Bracket | Male | Female |
| 5 to 17 Years | 0 (0.0%) | 0 (0.0%) |
| 18 to 34 Years | 0 (0.0%) | 0 (0.0%) |
| 35 to 64 Years | 0 (0.0%) | 6 (28.6%) |
| 65 to 74 Years | 0 (0.0%) | 2 (20.0%) |
| 75 Years and over | 0 (0.0%) | 0 (0.0%) |
Disability Class: Ambulatory Difficulty
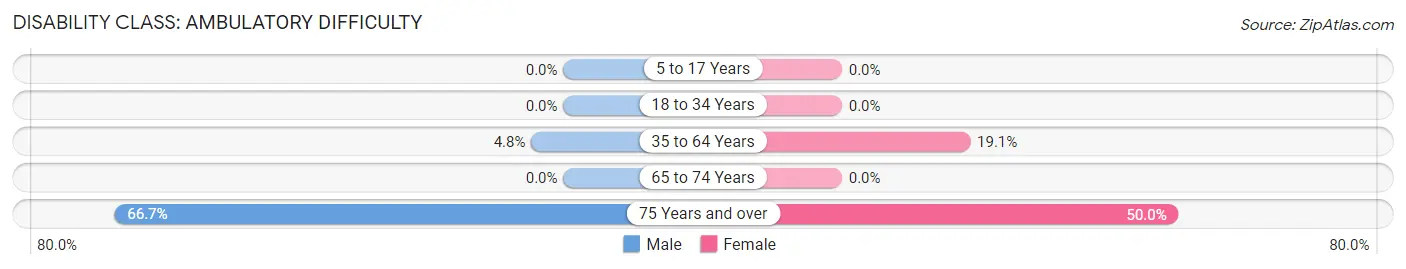
| Age Bracket | Male | Female |
| 5 to 17 Years | 0 (0.0%) | 0 (0.0%) |
| 18 to 34 Years | 0 (0.0%) | 0 (0.0%) |
| 35 to 64 Years | 1 (4.8%) | 4 (19.1%) |
| 65 to 74 Years | 0 (0.0%) | 0 (0.0%) |
| 75 Years and over | 4 (66.7%) | 1 (50.0%) |
Disability Class: Self-Care Difficulty
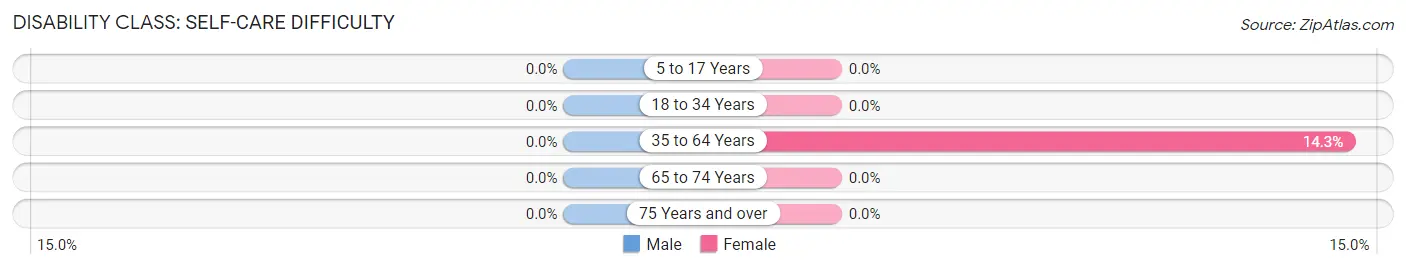
| Age Bracket | Male | Female |
| 5 to 17 Years | 0 (0.0%) | 0 (0.0%) |
| 18 to 34 Years | 0 (0.0%) | 0 (0.0%) |
| 35 to 64 Years | 0 (0.0%) | 3 (14.3%) |
| 65 to 74 Years | 0 (0.0%) | 0 (0.0%) |
| 75 Years and over | 0 (0.0%) | 0 (0.0%) |
Technology Access in Tabiona
Computing Device Access in Tabiona
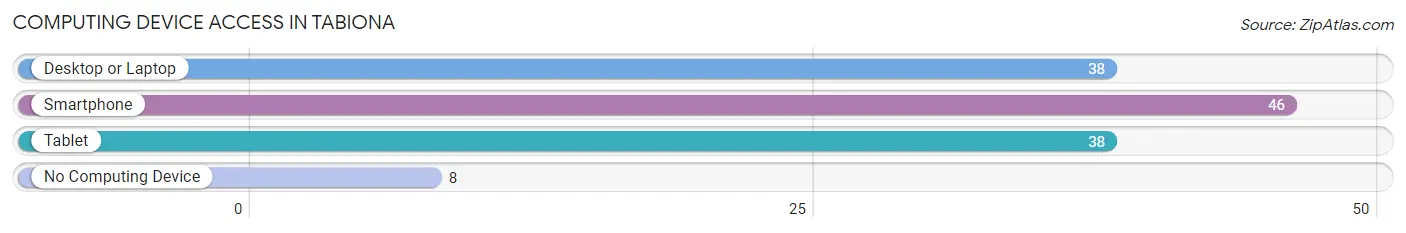
| Device Type | # Households | % Households |
| Desktop or Laptop | 38 | 67.9% |
| Smartphone | 46 | 82.1% |
| Tablet | 38 | 67.9% |
| No Computing Device | 8 | 14.3% |
| Total | 56 | 100.0% |
Internet Access in Tabiona
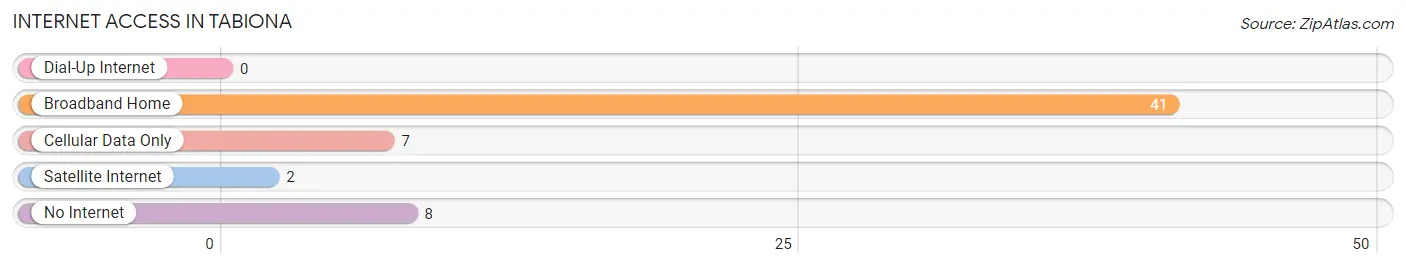
| Internet Type | # Households | % Households |
| Dial-Up Internet | 0 | 0.0% |
| Broadband Home | 41 | 73.2% |
| Cellular Data Only | 7 | 12.5% |
| Satellite Internet | 2 | 3.6% |
| No Internet | 8 | 14.3% |
| Total | 56 | 100.0% |
Tabiona Summary
Tabiona is a small town located in Duchesne County, Utah, United States. It is situated in the Uinta Mountains, at an elevation of 7,000 feet (2,134 m). The population was estimated to be around 200 in 2020.
History
Tabiona was first settled in 1876 by a group of Mormon pioneers led by John W. Van Cott. The town was named after a Native American chief, Tabby-O-Nah, who lived in the area. The settlers built a fort and a sawmill, and the town grew quickly. By 1879, Tabiona had a post office, a school, and a store.
In the early 1900s, Tabiona was a thriving community with a population of over 500. The town had a hotel, a bank, a newspaper, and several stores. The town was also home to a number of businesses, including a blacksmith shop, a livery stable, and a creamery.
In the 1920s, the population of Tabiona began to decline as people moved away to find work in larger cities. By the 1940s, the population had dropped to around 200.
Geography
Tabiona is located in the Uinta Mountains, in the Wasatch Range of Utah. The town is situated at an elevation of 7,000 feet (2,134 m). The area is known for its rugged terrain and spectacular views of the surrounding mountains.
The town is located near the headwaters of the Duchesne River, which flows south through the Uinta Mountains and into the Great Salt Lake. The area is also home to several small lakes, including Tabby Lake, which is located just north of the town.
Economy
The economy of Tabiona is largely based on agriculture and tourism. The town is home to several small farms, which produce hay, alfalfa, and other crops. The town is also a popular destination for outdoor recreation, such as fishing, hunting, and camping.
Demographics
As of the 2010 census, the population of Tabiona was estimated to be around 200. The town is predominantly white, with a small Hispanic population. The median household income is around $30,000, and the median home value is around $100,000.
Conclusion
Tabiona is a small town located in Duchesne County, Utah, United States. It is situated in the Uinta Mountains, at an elevation of 7,000 feet (2,134 m). The town was first settled in 1876 by a group of Mormon pioneers, and the population was estimated to be around 200 in 2020. The economy of Tabiona is largely based on agriculture and tourism, and the town is predominantly white, with a small Hispanic population. Tabiona is a popular destination for outdoor recreation, and the area is known for its rugged terrain and spectacular views of the surrounding mountains.
Common Questions
What is Per Capita Income in Tabiona?
Per Capita income in Tabiona is $25,138.
What is the Median Family Income in Tabiona?
Median Family Income in Tabiona is $67,500.
What is the Median Household income in Tabiona?
Median Household Income in Tabiona is $66,429.
What is Inequality or Gini Index in Tabiona?
Inequality or Gini Index in Tabiona is 0.32.
What is the Total Population of Tabiona?
Total Population of Tabiona is 156.
What is the Total Male Population of Tabiona?
Total Male Population of Tabiona is 77.
What is the Total Female Population of Tabiona?
Total Female Population of Tabiona is 79.
What is the Ratio of Males per 100 Females in Tabiona?
There are 97.47 Males per 100 Females in Tabiona.
What is the Ratio of Females per 100 Males in Tabiona?
There are 102.60 Females per 100 Males in Tabiona.
What is the Median Population Age in Tabiona?
Median Population Age in Tabiona is 28.1 Years.
What is the Average Family Size in Tabiona
Average Family Size in Tabiona is 3.2 People.
What is the Average Household Size in Tabiona
Average Household Size in Tabiona is 2.8 People.
How Large is the Labor Force in Tabiona?
There are 66 People in the Labor Forcein in Tabiona.
What is the Percentage of People in the Labor Force in Tabiona?
64.7% of People are in the Labor Force in Tabiona.
What is the Unemployment Rate in Tabiona?
Unemployment Rate in Tabiona is 3.0%.