Moroni, UT Map & Demographics
Moroni Map
Moroni Overview
$28,829
PER CAPITA INCOME
$88,056
AVG FAMILY INCOME
$69,417
AVG HOUSEHOLD INCOME
42.4%
WAGE / INCOME GAP [ % ]
57.6¢/ $1
WAGE / INCOME GAP [ $ ]
0.34
INEQUALITY / GINI INDEX
1,259
TOTAL POPULATION
614
MALE POPULATION
645
FEMALE POPULATION
95.19
MALES / 100 FEMALES
105.05
FEMALES / 100 MALES
34.6
MEDIAN AGE
3.6
AVG FAMILY SIZE
2.9
AVG HOUSEHOLD SIZE
642
LABOR FORCE [ PEOPLE ]
66.3%
PERCENT IN LABOR FORCE
2.5%
UNEMPLOYMENT RATE
Moroni Zip Codes
Moroni Area Codes
Income in Moroni
Income Overview in Moroni
Per Capita Income in Moroni is $28,829, while median incomes of families and households are $88,056 and $69,417 respectively.
| Characteristic | Number | Measure |
| Per Capita Income | 1,259 | $28,829 |
| Median Family Income | 300 | $88,056 |
| Mean Family Income | 300 | $97,574 |
| Median Household Income | 438 | $69,417 |
| Mean Household Income | 438 | $81,313 |
| Income Deficit | 300 | $0 |
| Wage / Income Gap (%) | 1,259 | 42.36% |
| Wage / Income Gap ($) | 1,259 | 57.64¢ per $1 |
| Gini / Inequality Index | 1,259 | 0.34 |
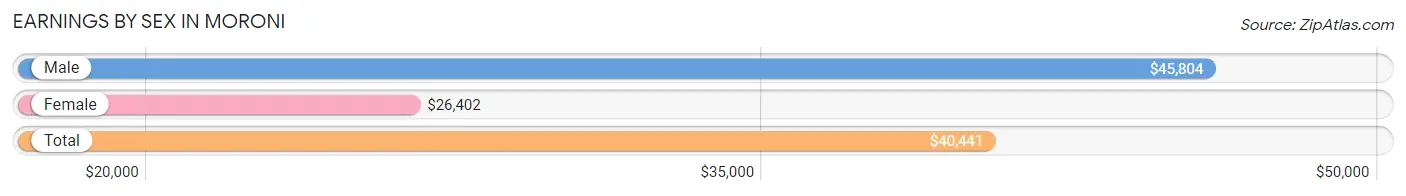
Earnings by Sex in Moroni
Average Earnings in Moroni are $40,441, $45,804 for men and $26,402 for women, a difference of 42.4%.
| Sex | Number | Average Earnings |
| Male | 381 (56.7%) | $45,804 |
| Female | 291 (43.3%) | $26,402 |
| Total | 672 (100.0%) | $40,441 |
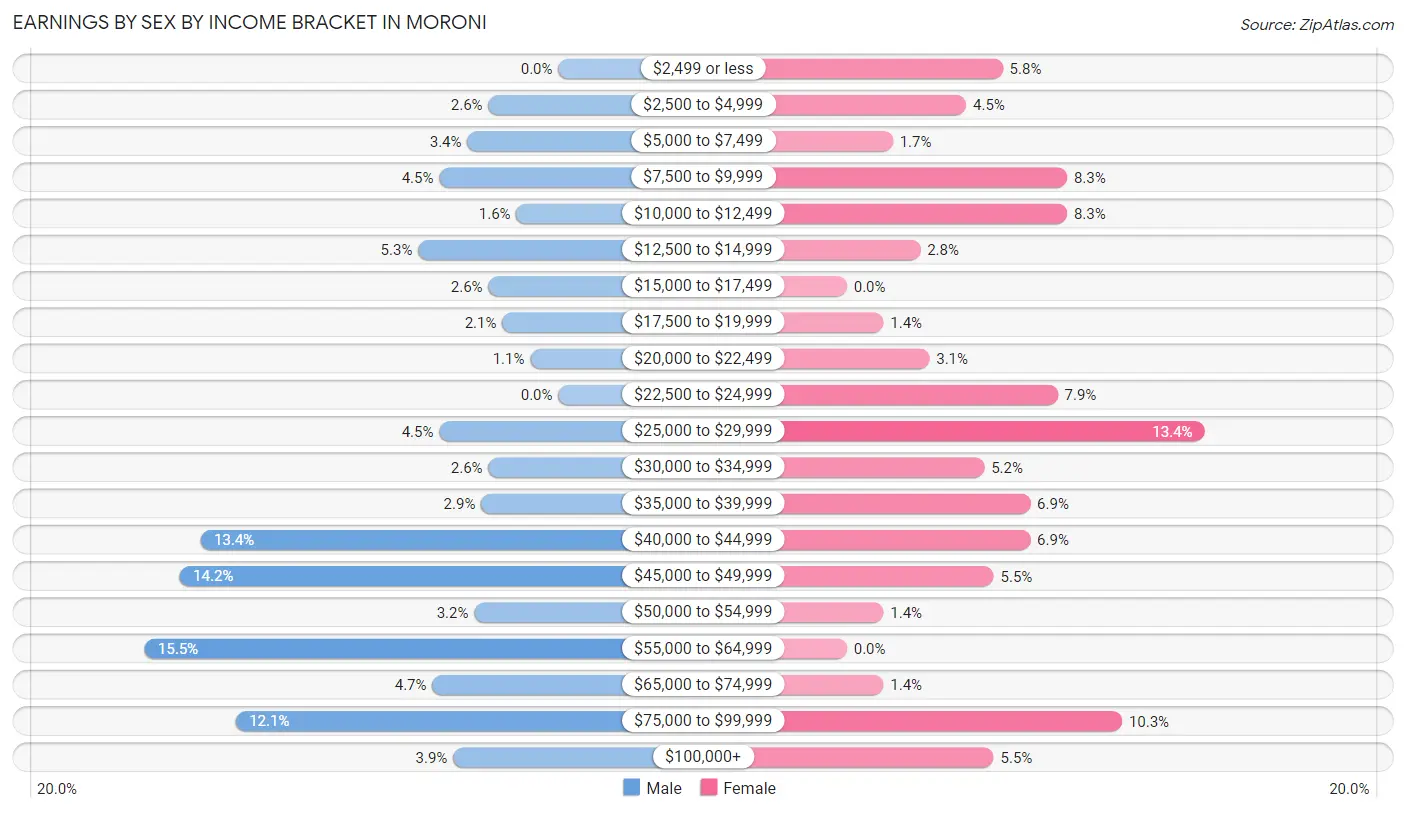
Earnings by Sex by Income Bracket in Moroni
The most common earnings brackets in Moroni are $55,000 to $64,999 for men (59 | 15.5%) and $25,000 to $29,999 for women (39 | 13.4%).
| Income | Male | Female |
| $2,499 or less | 0 (0.0%) | 17 (5.8%) |
| $2,500 to $4,999 | 10 (2.6%) | 13 (4.5%) |
| $5,000 to $7,499 | 13 (3.4%) | 5 (1.7%) |
| $7,500 to $9,999 | 17 (4.5%) | 24 (8.3%) |
| $10,000 to $12,499 | 6 (1.6%) | 24 (8.3%) |
| $12,500 to $14,999 | 20 (5.2%) | 8 (2.8%) |
| $15,000 to $17,499 | 10 (2.6%) | 0 (0.0%) |
| $17,500 to $19,999 | 8 (2.1%) | 4 (1.4%) |
| $20,000 to $22,499 | 4 (1.1%) | 9 (3.1%) |
| $22,500 to $24,999 | 0 (0.0%) | 23 (7.9%) |
| $25,000 to $29,999 | 17 (4.5%) | 39 (13.4%) |
| $30,000 to $34,999 | 10 (2.6%) | 15 (5.1%) |
| $35,000 to $39,999 | 11 (2.9%) | 20 (6.9%) |
| $40,000 to $44,999 | 51 (13.4%) | 20 (6.9%) |
| $45,000 to $49,999 | 54 (14.2%) | 16 (5.5%) |
| $50,000 to $54,999 | 12 (3.2%) | 4 (1.4%) |
| $55,000 to $64,999 | 59 (15.5%) | 0 (0.0%) |
| $65,000 to $74,999 | 18 (4.7%) | 4 (1.4%) |
| $75,000 to $99,999 | 46 (12.1%) | 30 (10.3%) |
| $100,000+ | 15 (3.9%) | 16 (5.5%) |
| Total | 381 (100.0%) | 291 (100.0%) |
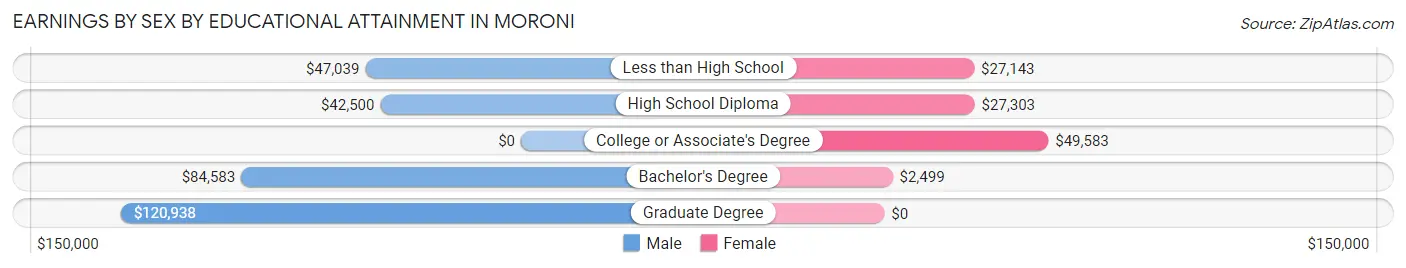
Earnings by Sex by Educational Attainment in Moroni
Average earnings in Moroni are $47,260 for men and $30,208 for women, a difference of 36.1%. Men with an educational attainment of graduate degree enjoy the highest average annual earnings of $120,938, while those with high school diploma education earn the least with $42,500. Women with an educational attainment of college or associate's degree earn the most with the average annual earnings of $49,583, while those with bachelor's degree education have the smallest earnings of $2,499.
| Educational Attainment | Male Income | Female Income |
| Less than High School | $47,039 | $27,143 |
| High School Diploma | $42,500 | $27,303 |
| College or Associate's Degree | - | - |
| Bachelor's Degree | $84,583 | $2,499 |
| Graduate Degree | $120,938 | $0 |
| Total | $47,260 | $30,208 |
Family Income in Moroni
Family Income Brackets in Moroni
According to the Moroni family income data, there are 93 families falling into the $100,000 to $149,999 income range, which is the most common income bracket and makes up 31.0% of all families.
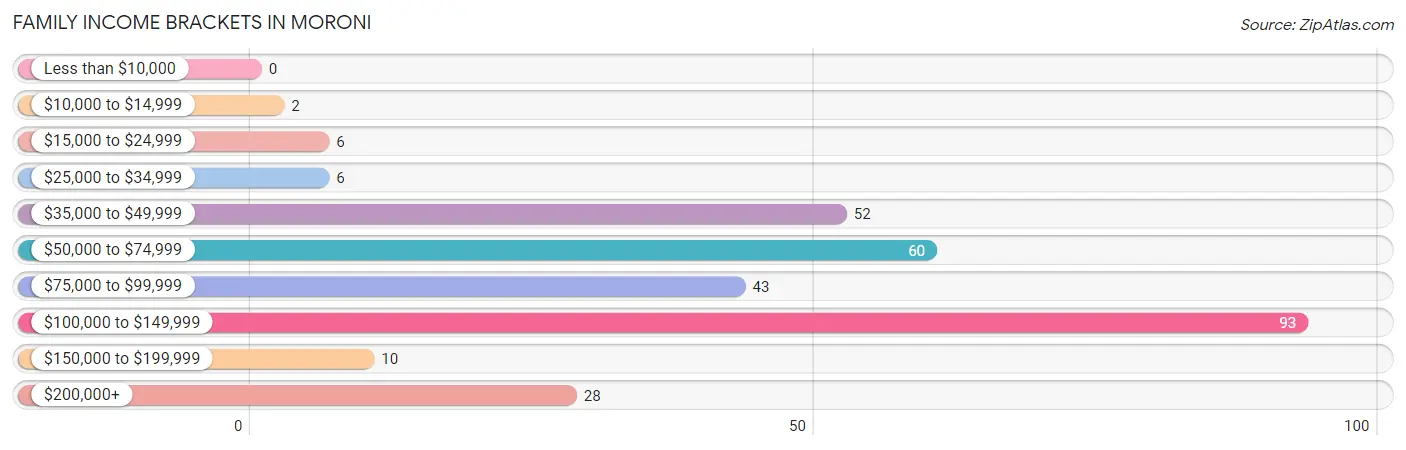
| Income Bracket | # Families | % Families |
| Less than $10,000 | 0 | 0.0% |
| $10,000 to $14,999 | 2 | 0.7% |
| $15,000 to $24,999 | 6 | 2.0% |
| $25,000 to $34,999 | 6 | 2.0% |
| $35,000 to $49,999 | 52 | 17.3% |
| $50,000 to $74,999 | 60 | 20.0% |
| $75,000 to $99,999 | 43 | 14.3% |
| $100,000 to $149,999 | 93 | 31.0% |
| $150,000 to $199,999 | 10 | 3.3% |
| $200,000+ | 28 | 9.3% |
Family Income by Famaliy Size in Moroni
4-person families (60 | 20.0%) account for the highest median family income in Moroni with $128,750 per family, while 4-person families (60 | 20.0%) have the highest median income of $32,188 per family member.
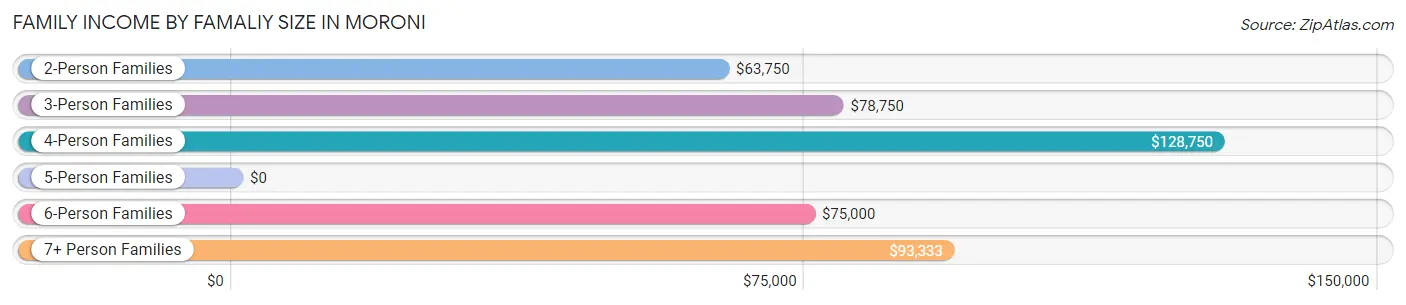
| Income Bracket | # Families | Median Income |
| 2-Person Families | 94 (31.3%) | $63,750 |
| 3-Person Families | 90 (30.0%) | $78,750 |
| 4-Person Families | 60 (20.0%) | $128,750 |
| 5-Person Families | 16 (5.3%) | $0 |
| 6-Person Families | 12 (4.0%) | $75,000 |
| 7+ Person Families | 28 (9.3%) | $93,333 |
| Total | 300 (100.0%) | $88,056 |
Family Income by Number of Earners in Moroni
The median family income in Moroni is $88,056, with families comprising 3+ earners (78) having the highest median family income of $116,429, while families with no earners (39) have the lowest median family income of $47,125, accounting for 26.0% and 13.0% of families, respectively.
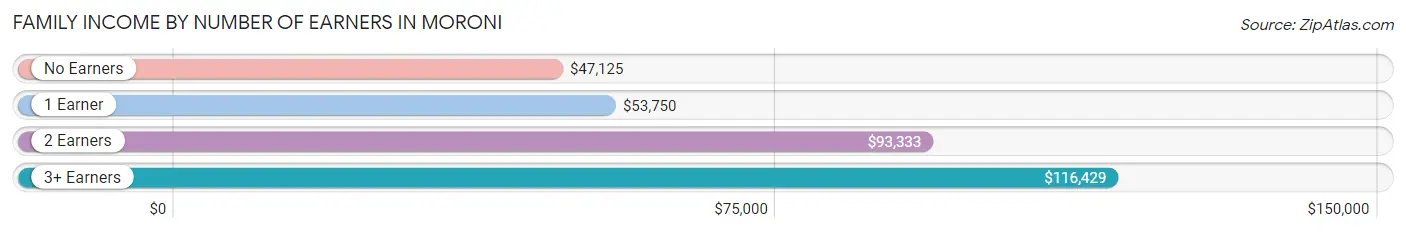
| Number of Earners | # Families | Median Income |
| No Earners | 39 (13.0%) | $47,125 |
| 1 Earner | 71 (23.7%) | $53,750 |
| 2 Earners | 112 (37.3%) | $93,333 |
| 3+ Earners | 78 (26.0%) | $116,429 |
| Total | 300 (100.0%) | $88,056 |
Household Income in Moroni
Household Income Brackets in Moroni
With 93 households falling in the category, the $100,000 to $149,999 income range is the most frequent in Moroni, accounting for 21.2% of all households. In contrast, only 9 households (2.1%) fall into the $10,000 to $14,999 income bracket, making it the least populous group.
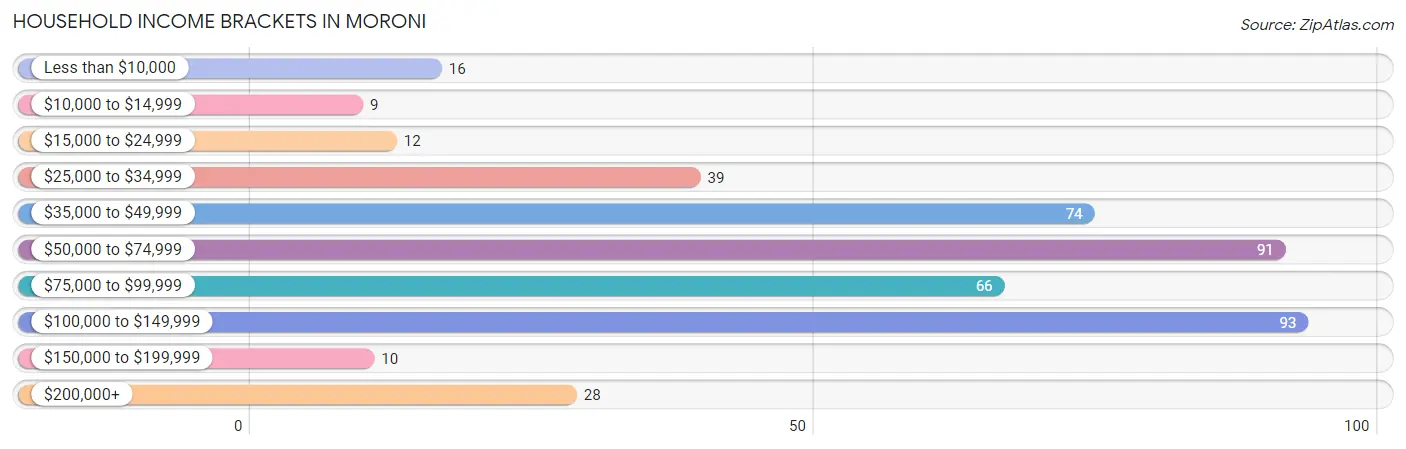
| Income Bracket | # Households | % Households |
| Less than $10,000 | 16 | 3.7% |
| $10,000 to $14,999 | 9 | 2.1% |
| $15,000 to $24,999 | 12 | 2.7% |
| $25,000 to $34,999 | 39 | 8.9% |
| $35,000 to $49,999 | 74 | 16.9% |
| $50,000 to $74,999 | 91 | 20.8% |
| $75,000 to $99,999 | 66 | 15.1% |
| $100,000 to $149,999 | 93 | 21.2% |
| $150,000 to $199,999 | 10 | 2.3% |
| $200,000+ | 28 | 6.4% |
Household Income by Householder Age in Moroni
The median household income in Moroni is $69,417, with the highest median household income of $102,794 found in the 45 to 64 years age bracket for the primary householder. A total of 182 households (41.5%) fall into this category. Meanwhile, the 65+ years age bracket for the primary householder has the lowest median household income of $44,732, with 131 households (29.9%) in this group.
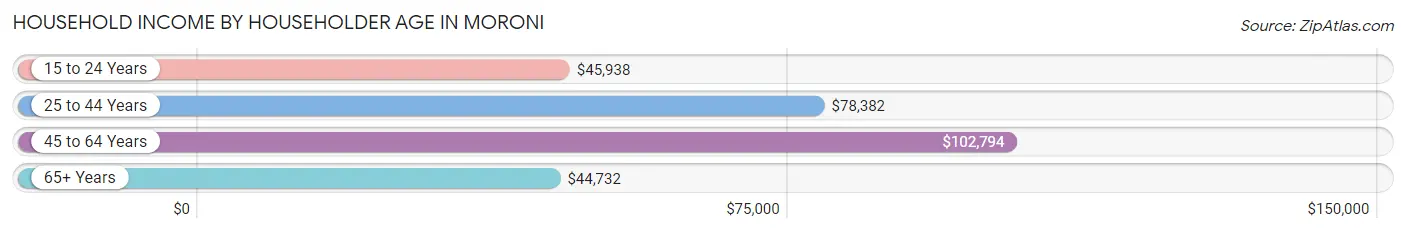
| Income Bracket | # Households | Median Income |
| 15 to 24 Years | 11 (2.5%) | $45,938 |
| 25 to 44 Years | 114 (26.0%) | $78,382 |
| 45 to 64 Years | 182 (41.5%) | $102,794 |
| 65+ Years | 131 (29.9%) | $44,732 |
| Total | 438 (100.0%) | $69,417 |
Poverty in Moroni
Income Below Poverty by Sex and Age in Moroni
With 4.5% poverty level for males and 3.6% for females among the residents of Moroni, 45 to 54 year old males and 5 year old females are the most vulnerable to poverty, with 18 males (27.7%) and 2 females (100.0%) in their respective age groups living below the poverty level.
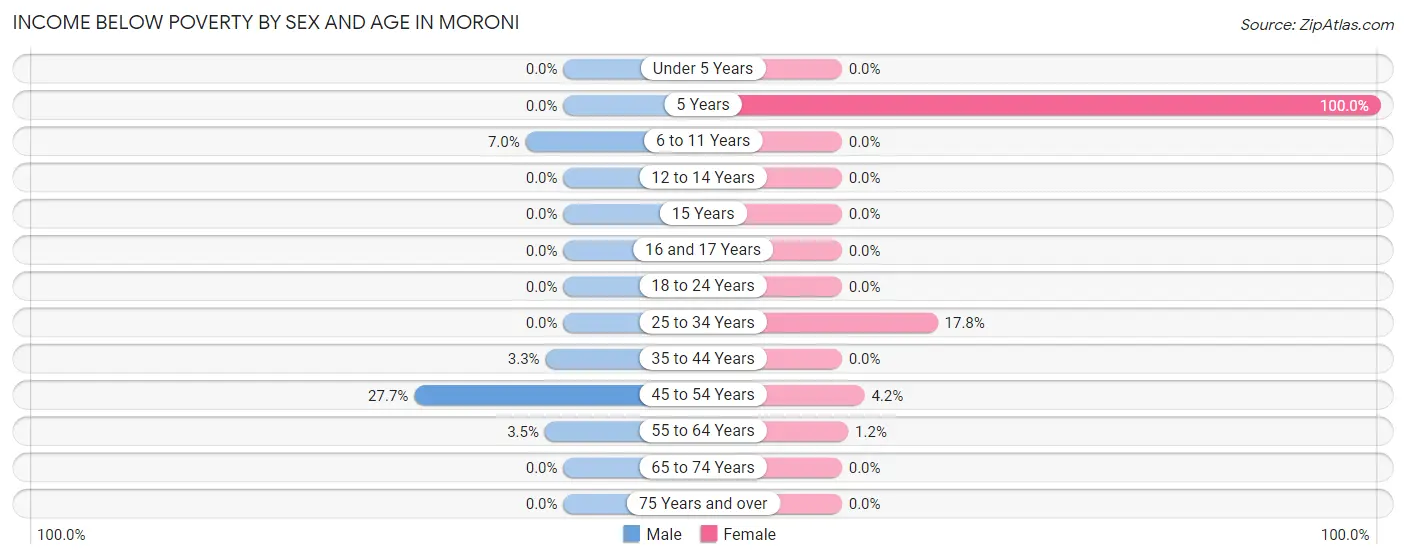
| Age Bracket | Male | Female |
| Under 5 Years | 0 (0.0%) | 0 (0.0%) |
| 5 Years | 0 (0.0%) | 2 (100.0%) |
| 6 to 11 Years | 4 (7.0%) | 0 (0.0%) |
| 12 to 14 Years | 0 (0.0%) | 0 (0.0%) |
| 15 Years | 0 (0.0%) | 0 (0.0%) |
| 16 and 17 Years | 0 (0.0%) | 0 (0.0%) |
| 18 to 24 Years | 0 (0.0%) | 0 (0.0%) |
| 25 to 34 Years | 0 (0.0%) | 16 (17.8%) |
| 35 to 44 Years | 2 (3.3%) | 0 (0.0%) |
| 45 to 54 Years | 18 (27.7%) | 4 (4.2%) |
| 55 to 64 Years | 3 (3.5%) | 1 (1.2%) |
| 65 to 74 Years | 0 (0.0%) | 0 (0.0%) |
| 75 Years and over | 0 (0.0%) | 0 (0.0%) |
| Total | 27 (4.5%) | 23 (3.6%) |
Income Above Poverty by Sex and Age in Moroni
According to the poverty statistics in Moroni, males aged under 5 years and females aged under 5 years are the age groups that are most secure financially, with 100.0% of males and 100.0% of females in these age groups living above the poverty line.
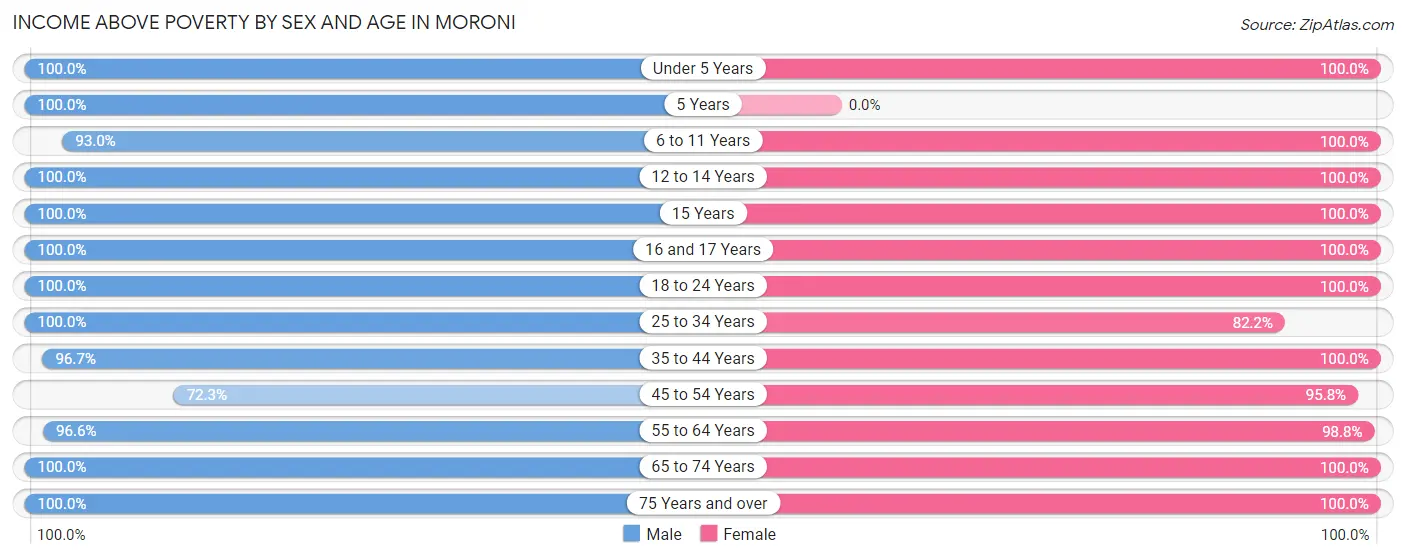
| Age Bracket | Male | Female |
| Under 5 Years | 26 (100.0%) | 55 (100.0%) |
| 5 Years | 10 (100.0%) | 0 (0.0%) |
| 6 to 11 Years | 53 (93.0%) | 27 (100.0%) |
| 12 to 14 Years | 17 (100.0%) | 40 (100.0%) |
| 15 Years | 9 (100.0%) | 31 (100.0%) |
| 16 and 17 Years | 13 (100.0%) | 24 (100.0%) |
| 18 to 24 Years | 98 (100.0%) | 72 (100.0%) |
| 25 to 34 Years | 51 (100.0%) | 74 (82.2%) |
| 35 to 44 Years | 58 (96.7%) | 56 (100.0%) |
| 45 to 54 Years | 47 (72.3%) | 91 (95.8%) |
| 55 to 64 Years | 84 (96.6%) | 84 (98.8%) |
| 65 to 74 Years | 77 (100.0%) | 37 (100.0%) |
| 75 Years and over | 28 (100.0%) | 31 (100.0%) |
| Total | 571 (95.5%) | 622 (96.4%) |
Income Below Poverty Among Married-Couple Families in Moroni
The poverty statistics for married-couple families in Moroni show that 1.8% or 5 of the total 286 families live below the poverty line. Families with 3 or 4 children have the highest poverty rate of 8.6%, comprising of 3 families. On the other hand, families with 1 or 2 children have the lowest poverty rate of 0.0%, which includes 0 families.
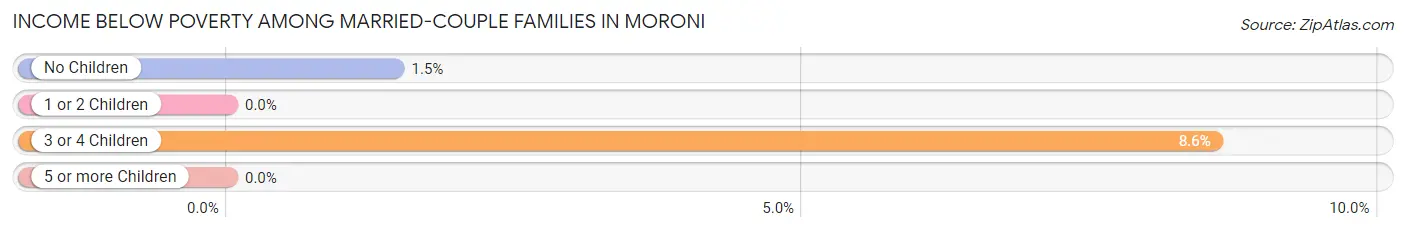
| Children | Above Poverty | Below Poverty |
| No Children | 136 (98.6%) | 2 (1.5%) |
| 1 or 2 Children | 98 (100.0%) | 0 (0.0%) |
| 3 or 4 Children | 32 (91.4%) | 3 (8.6%) |
| 5 or more Children | 15 (100.0%) | 0 (0.0%) |
| Total | 281 (98.3%) | 5 (1.8%) |
Income Below Poverty Among Single-Parent Households in Moroni
| Children | Single Father | Single Mother |
| No Children | 0 (0.0%) | 0 (0.0%) |
| 1 or 2 Children | 0 (0.0%) | 0 (0.0%) |
| 3 or 4 Children | 0 (0.0%) | 0 (0.0%) |
| 5 or more Children | 0 (0.0%) | 0 (0.0%) |
| Total | 0 (0.0%) | 0 (0.0%) |
Income Below Poverty Among Married-Couple vs Single-Parent Households in Moroni
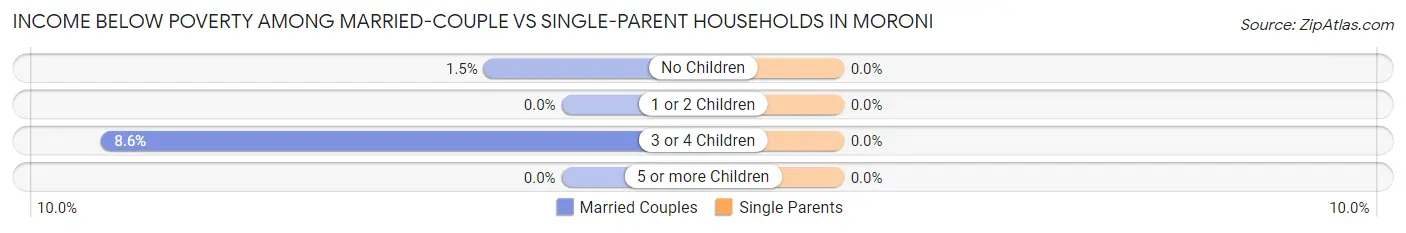
| Children | Married-Couple Families | Single-Parent Households |
| No Children | 2 (1.5%) | 0 (0.0%) |
| 1 or 2 Children | 0 (0.0%) | 0 (0.0%) |
| 3 or 4 Children | 3 (8.6%) | 0 (0.0%) |
| 5 or more Children | 0 (0.0%) | 0 (0.0%) |
| Total | 5 (1.8%) | 0 (0.0%) |
Race in Moroni
The most populous races in Moroni are White / Caucasian (837 | 66.5%), Hispanic or Latino (380 | 30.2%), and Some other Race (316 | 25.1%).
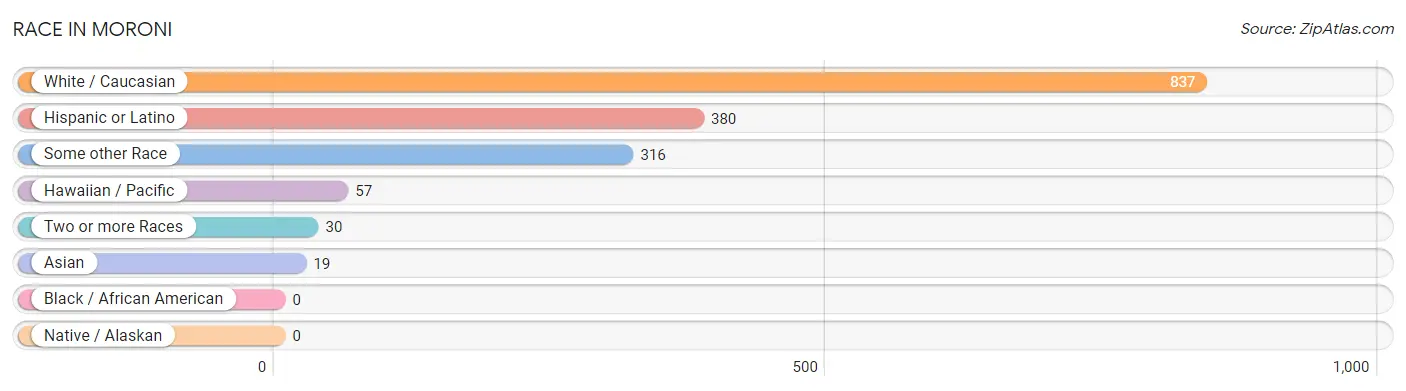
| Race | # Population | % Population |
| Asian | 19 | 1.5% |
| Black / African American | 0 | 0.0% |
| Hawaiian / Pacific | 57 | 4.5% |
| Hispanic or Latino | 380 | 30.2% |
| Native / Alaskan | 0 | 0.0% |
| White / Caucasian | 837 | 66.5% |
| Two or more Races | 30 | 2.4% |
| Some other Race | 316 | 25.1% |
| Total | 1,259 | 100.0% |
Ancestry in Moroni
The most populous ancestries reported in Moroni are Mexican (367 | 29.1%), English (210 | 16.7%), Danish (130 | 10.3%), German (74 | 5.9%), and Dutch (54 | 4.3%), together accounting for 66.3% of all Moroni residents.
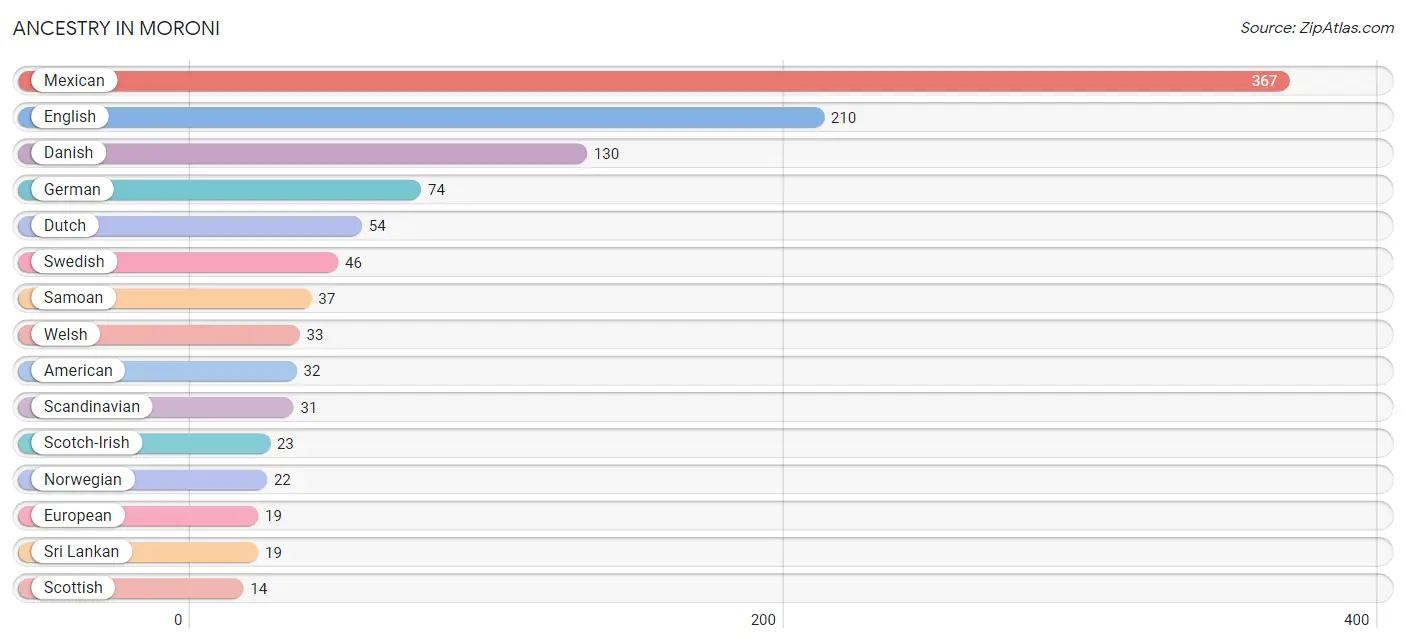
| Ancestry | # Population | % Population |
| American | 32 | 2.5% |
| British | 7 | 0.6% |
| Danish | 130 | 10.3% |
| Dutch | 54 | 4.3% |
| English | 210 | 16.7% |
| European | 19 | 1.5% |
| German | 74 | 5.9% |
| Inupiat | 3 | 0.2% |
| Irish | 6 | 0.5% |
| Mexican | 367 | 29.1% |
| Norwegian | 22 | 1.8% |
| Polish | 3 | 0.2% |
| Portuguese | 4 | 0.3% |
| Puerto Rican | 7 | 0.6% |
| Samoan | 37 | 2.9% |
| Scandinavian | 31 | 2.5% |
| Scotch-Irish | 23 | 1.8% |
| Scottish | 14 | 1.1% |
| Slovene | 3 | 0.2% |
| Sri Lankan | 19 | 1.5% |
| Swedish | 46 | 3.6% |
| Welsh | 33 | 2.6% | View All 22 Rows |
Immigrants in Moroni
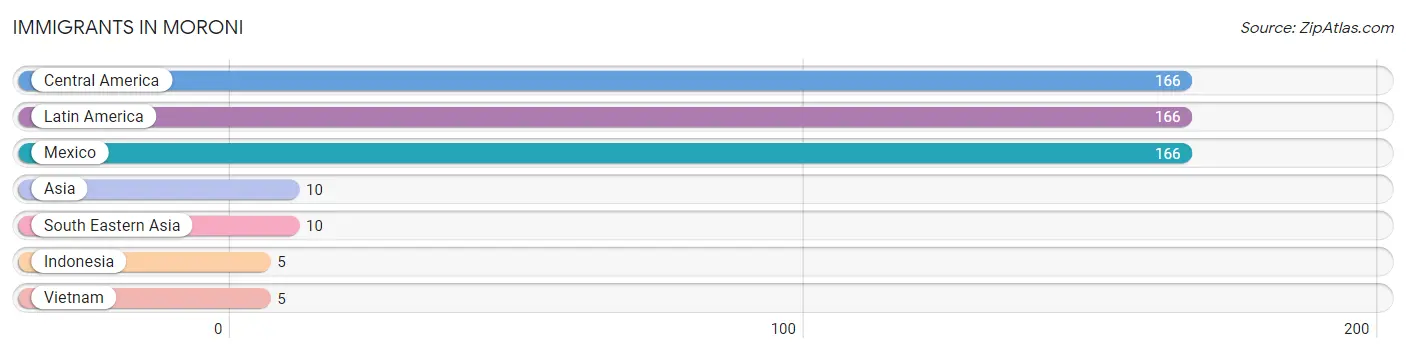
The most numerous immigrant groups reported in Moroni came from Central America (166 | 13.2%), Latin America (166 | 13.2%), Mexico (166 | 13.2%), Asia (10 | 0.8%), and South Eastern Asia (10 | 0.8%), together accounting for 41.1% of all Moroni residents.
| Immigration Origin | # Population | % Population |
| Asia | 10 | 0.8% |
| Central America | 166 | 13.2% |
| Indonesia | 5 | 0.4% |
| Latin America | 166 | 13.2% |
| Mexico | 166 | 13.2% |
| South Eastern Asia | 10 | 0.8% |
| Vietnam | 5 | 0.4% | View All 7 Rows |
Sex and Age in Moroni
Sex and Age in Moroni
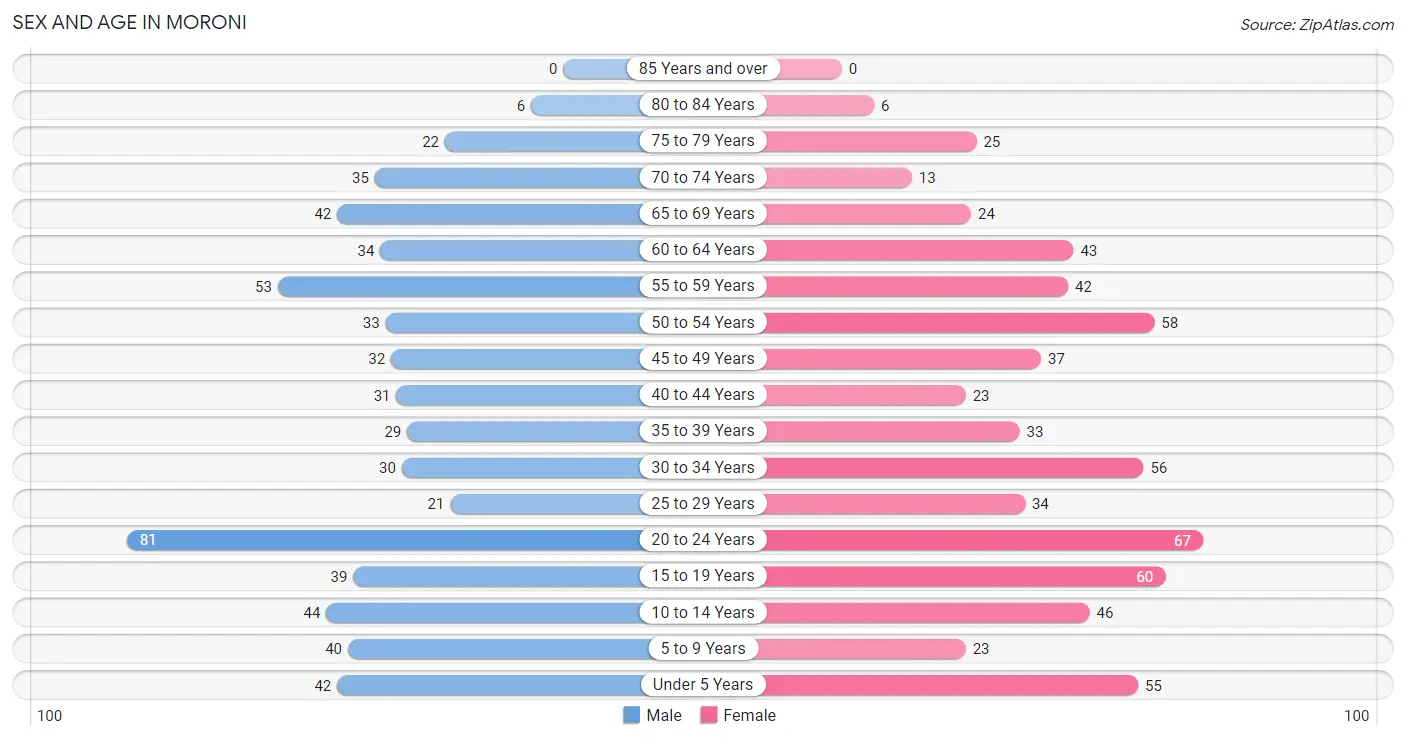
The most populous age groups in Moroni are 20 to 24 Years (81 | 13.2%) for men and 20 to 24 Years (67 | 10.4%) for women.
| Age Bracket | Male | Female |
| Under 5 Years | 42 (6.8%) | 55 (8.5%) |
| 5 to 9 Years | 40 (6.5%) | 23 (3.6%) |
| 10 to 14 Years | 44 (7.2%) | 46 (7.1%) |
| 15 to 19 Years | 39 (6.4%) | 60 (9.3%) |
| 20 to 24 Years | 81 (13.2%) | 67 (10.4%) |
| 25 to 29 Years | 21 (3.4%) | 34 (5.3%) |
| 30 to 34 Years | 30 (4.9%) | 56 (8.7%) |
| 35 to 39 Years | 29 (4.7%) | 33 (5.1%) |
| 40 to 44 Years | 31 (5.1%) | 23 (3.6%) |
| 45 to 49 Years | 32 (5.2%) | 37 (5.7%) |
| 50 to 54 Years | 33 (5.4%) | 58 (9.0%) |
| 55 to 59 Years | 53 (8.6%) | 42 (6.5%) |
| 60 to 64 Years | 34 (5.5%) | 43 (6.7%) |
| 65 to 69 Years | 42 (6.8%) | 24 (3.7%) |
| 70 to 74 Years | 35 (5.7%) | 13 (2.0%) |
| 75 to 79 Years | 22 (3.6%) | 25 (3.9%) |
| 80 to 84 Years | 6 (1.0%) | 6 (0.9%) |
| 85 Years and over | 0 (0.0%) | 0 (0.0%) |
| Total | 614 (100.0%) | 645 (100.0%) |
Families and Households in Moroni
Median Family Size in Moroni
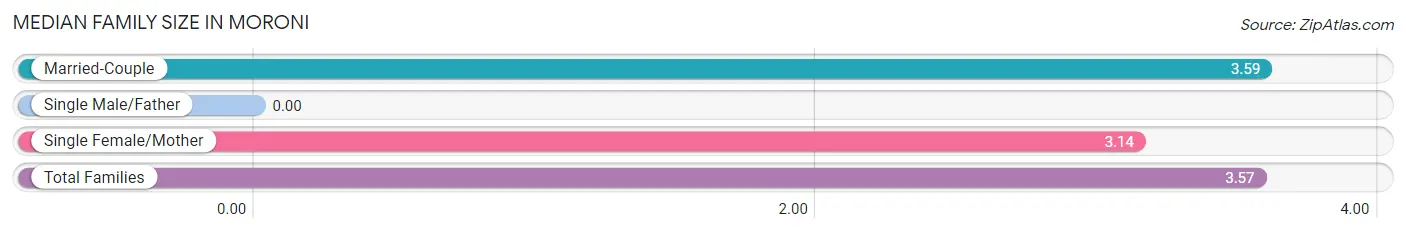
| Family Type | # Families | Family Size |
| Married-Couple | 286 (95.3%) | 3.59 |
| Single Male/Father | 0 (0.0%) | - |
| Single Female/Mother | 14 (4.7%) | 3.14 |
| Total Families | 300 (100.0%) | 3.57 |
Median Household Size in Moroni
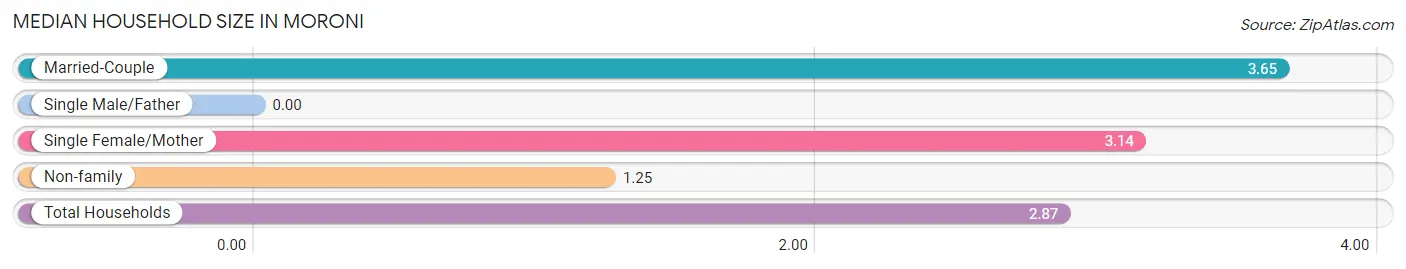
| Household Type | # Households | Household Size |
| Married-Couple | 286 (65.3%) | 3.65 |
| Single Male/Father | 0 (0.0%) | - |
| Single Female/Mother | 14 (3.2%) | 3.14 |
| Non-family | 138 (31.5%) | 1.25 |
| Total Households | 438 (100.0%) | 2.87 |
Household Size by Marriage Status in Moroni
Out of a total of 438 households in Moroni, 300 (68.5%) are family households, while 138 (31.5%) are nonfamily households. The most numerous type of family households are 2-person households, comprising 94, and the most common type of nonfamily households are 1-person households, comprising 114.
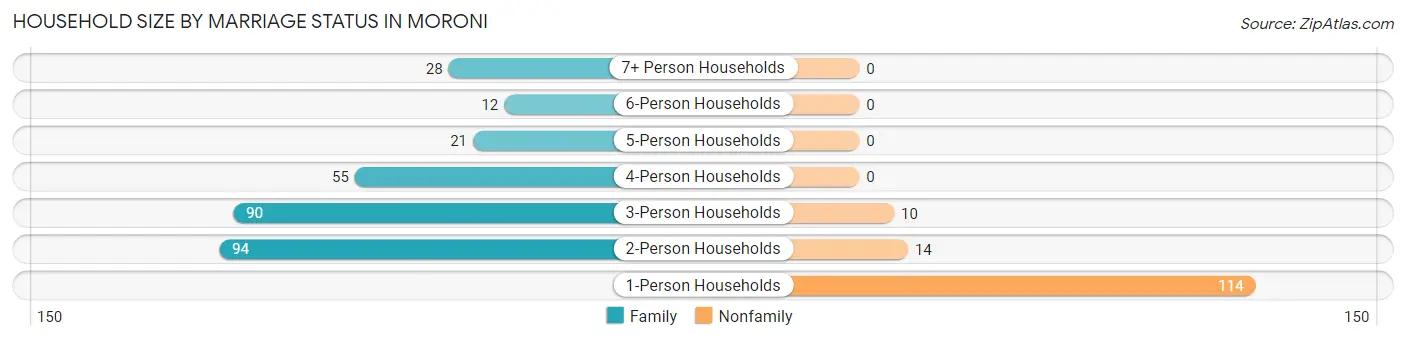
| Household Size | Family Households | Nonfamily Households |
| 1-Person Households | - | 114 (26.0%) |
| 2-Person Households | 94 (21.5%) | 14 (3.2%) |
| 3-Person Households | 90 (20.5%) | 10 (2.3%) |
| 4-Person Households | 55 (12.6%) | 0 (0.0%) |
| 5-Person Households | 21 (4.8%) | 0 (0.0%) |
| 6-Person Households | 12 (2.7%) | 0 (0.0%) |
| 7+ Person Households | 28 (6.4%) | 0 (0.0%) |
| Total | 300 (68.5%) | 138 (31.5%) |
Female Fertility in Moroni
Fertility by Age in Moroni
Average fertility rate in Moroni is 133.0 births per 1,000 women. Women in the age bracket of 20 to 34 years have the highest fertility rate with 197.0 births per 1,000 women. Women in the age bracket of 20 to 34 years acount for 72.1% of all women with births.
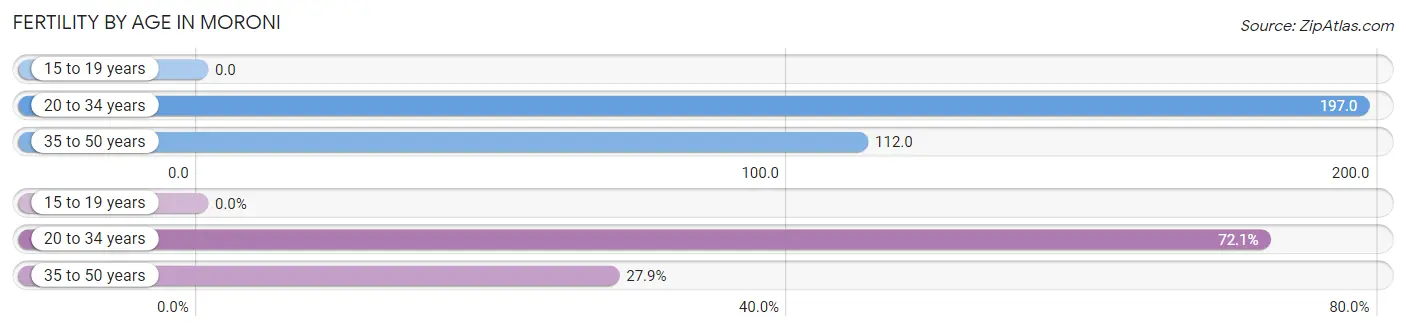
| Age Bracket | Women with Births | Births / 1,000 Women |
| 15 to 19 years | 0 (0.0%) | 0.0 |
| 20 to 34 years | 31 (72.1%) | 197.0 |
| 35 to 50 years | 12 (27.9%) | 112.0 |
| Total | 43 (100.0%) | 133.0 |
Fertility by Age by Marriage Status in Moroni
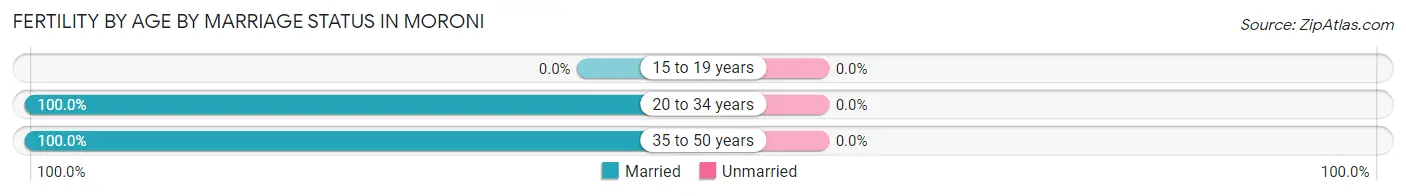
| Age Bracket | Married | Unmarried |
| 15 to 19 years | 0 (0.0%) | 0 (0.0%) |
| 20 to 34 years | 31 (100.0%) | 0 (0.0%) |
| 35 to 50 years | 12 (100.0%) | 0 (0.0%) |
| Total | 43 (100.0%) | 0 (0.0%) |
Fertility by Education in Moroni
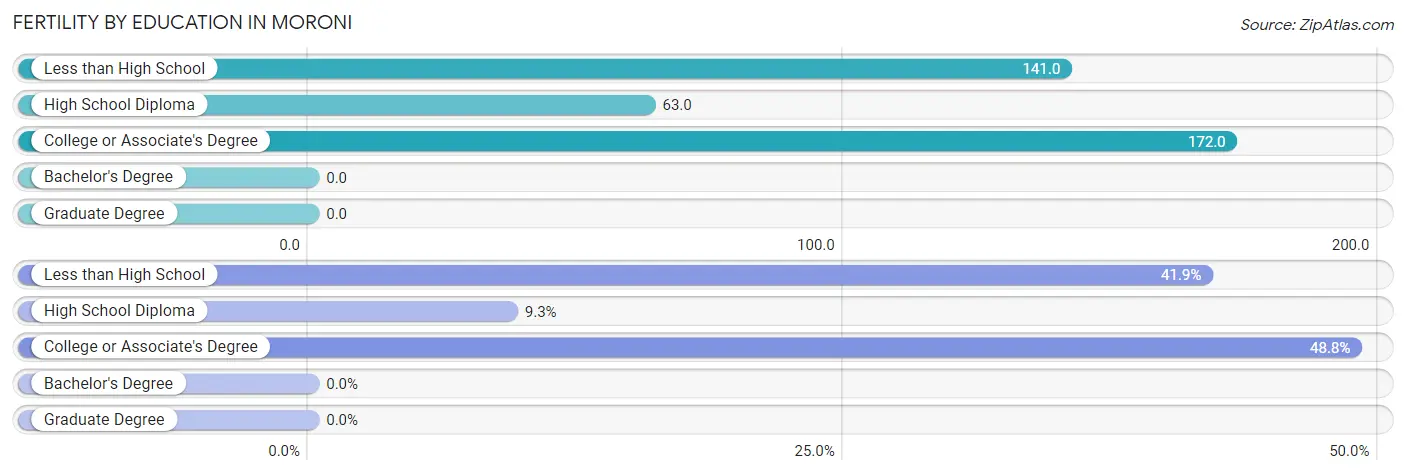
| Educational Attainment | Women with Births | Births / 1,000 Women |
| Less than High School | 18 (41.9%) | 141.0 |
| High School Diploma | 4 (9.3%) | 63.0 |
| College or Associate's Degree | 21 (48.8%) | 172.0 |
| Bachelor's Degree | 0 (0.0%) | 0.0 |
| Graduate Degree | 0 (0.0%) | 0.0 |
| Total | 43 (100.0%) | 133.0 |
Fertility by Education by Marriage Status in Moroni
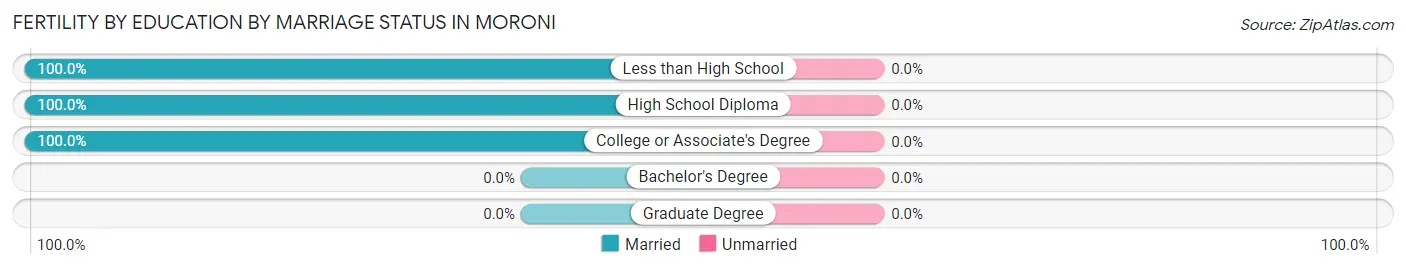
| Educational Attainment | Married | Unmarried |
| Less than High School | 18 (100.0%) | 0 (0.0%) |
| High School Diploma | 4 (100.0%) | 0 (0.0%) |
| College or Associate's Degree | 21 (100.0%) | 0 (0.0%) |
| Bachelor's Degree | 0 (0.0%) | 0 (0.0%) |
| Graduate Degree | 0 (0.0%) | 0 (0.0%) |
| Total | 43 (100.0%) | 0 (0.0%) |
Employment Characteristics in Moroni
Employment by Class of Employer in Moroni
Among the 602 employed individuals in Moroni, private company employees (434 | 72.1%), state government employees (51 | 8.5%), and self-employed (not incorporated) (37 | 6.1%) make up the most common classes of employment.
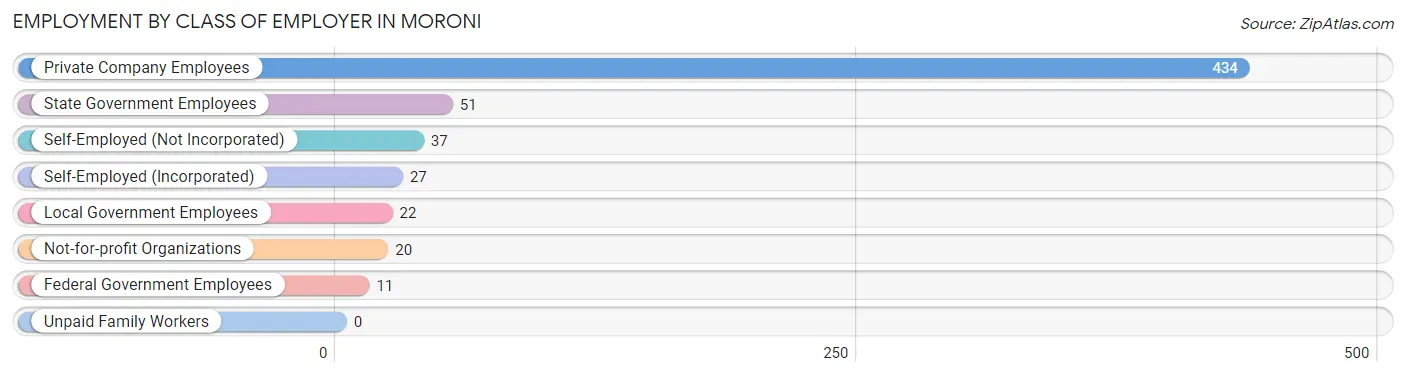
| Employer Class | # Employees | % Employees |
| Private Company Employees | 434 | 72.1% |
| Self-Employed (Incorporated) | 27 | 4.5% |
| Self-Employed (Not Incorporated) | 37 | 6.1% |
| Not-for-profit Organizations | 20 | 3.3% |
| Local Government Employees | 22 | 3.6% |
| State Government Employees | 51 | 8.5% |
| Federal Government Employees | 11 | 1.8% |
| Unpaid Family Workers | 0 | 0.0% |
| Total | 602 | 100.0% |
Employment Status by Age in Moroni
According to the labor force statistics for Moroni, out of the total population over 16 years of age (969), 66.3% or 642 individuals are in the labor force, with 2.5% or 16 of them unemployed. The age group with the highest labor force participation rate is 30 to 34 years, with 91.9% or 79 individuals in the labor force. Within the labor force, the 30 to 34 years age range has the highest percentage of unemployed individuals, with 20.3% or 16 of them being unemployed.
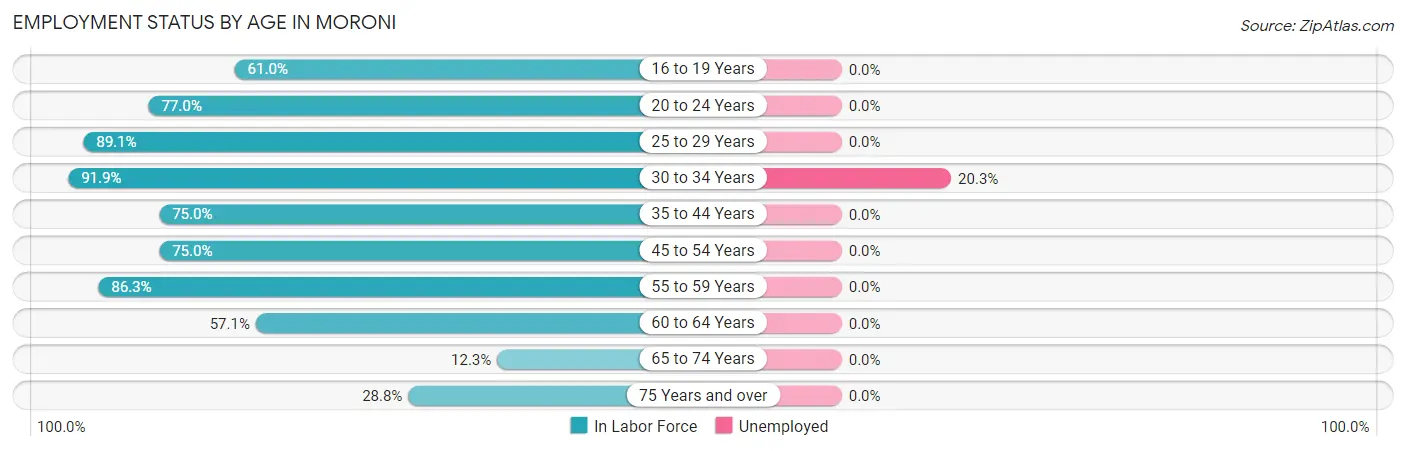
| Age Bracket | In Labor Force | Unemployed |
| 16 to 19 Years | 36 (61.0%) | 0 (0.0%) |
| 20 to 24 Years | 114 (77.0%) | 0 (0.0%) |
| 25 to 29 Years | 49 (89.1%) | 0 (0.0%) |
| 30 to 34 Years | 79 (91.9%) | 16 (20.3%) |
| 35 to 44 Years | 87 (75.0%) | 0 (0.0%) |
| 45 to 54 Years | 120 (75.0%) | 0 (0.0%) |
| 55 to 59 Years | 82 (86.3%) | 0 (0.0%) |
| 60 to 64 Years | 44 (57.1%) | 0 (0.0%) |
| 65 to 74 Years | 14 (12.3%) | 0 (0.0%) |
| 75 Years and over | 17 (28.8%) | 0 (0.0%) |
| Total | 642 (66.3%) | 16 (2.5%) |
Employment Status by Educational Attainment in Moroni
According to labor force statistics for Moroni, 78.3% of individuals (461) out of the total population between 25 and 64 years of age (589) are in the labor force, with 3.5% or 16 of them being unemployed. The group with the highest labor force participation rate are those with the educational attainment of high school diploma, with 87.9% or 152 individuals in the labor force. Within the labor force, individuals with less than high school education have the highest percentage of unemployment, with 8.0% or 13 of them being unemployed.
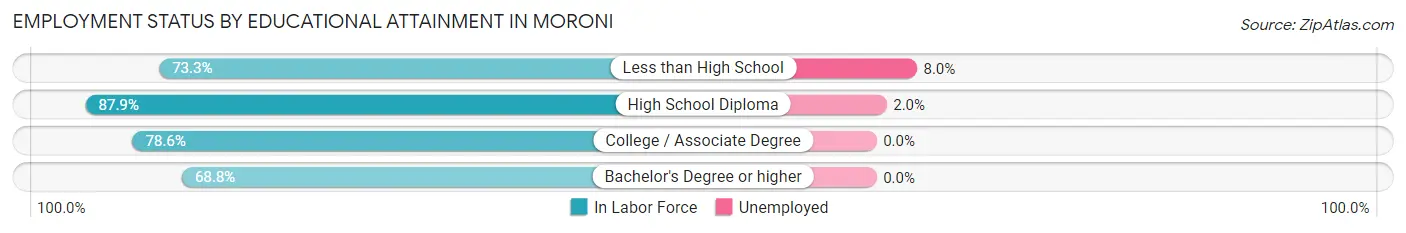
| Educational Attainment | In Labor Force | Unemployed |
| Less than High School | 162 (73.3%) | 18 (8.0%) |
| High School Diploma | 152 (87.9%) | 3 (2.0%) |
| College / Associate Degree | 103 (78.6%) | 0 (0.0%) |
| Bachelor's Degree or higher | 44 (68.8%) | 0 (0.0%) |
| Total | 461 (78.3%) | 21 (3.5%) |
Employment Occupations by Sex in Moroni
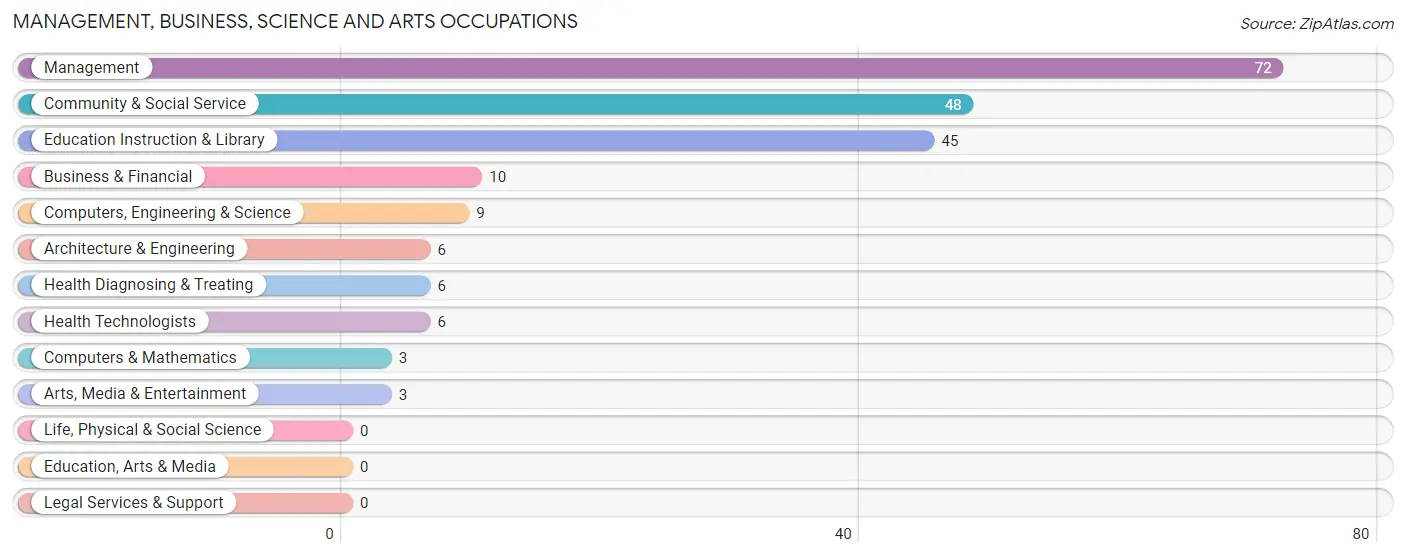
Management, Business, Science and Arts Occupations
The most common Management, Business, Science and Arts occupations in Moroni are Management (72 | 11.5%), Community & Social Service (48 | 7.7%), Education Instruction & Library (45 | 7.2%), Business & Financial (10 | 1.6%), and Computers, Engineering & Science (9 | 1.4%).
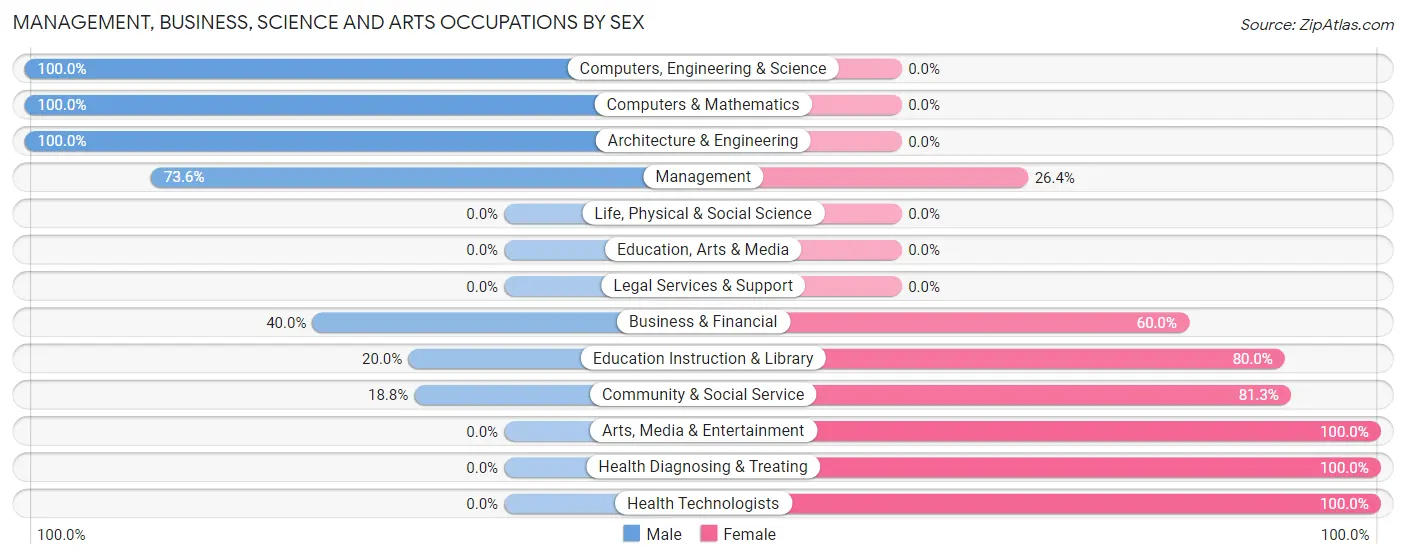
Management, Business, Science and Arts Occupations by Sex
Within the Management, Business, Science and Arts occupations in Moroni, the most male-oriented occupations are Computers, Engineering & Science (100.0%), Computers & Mathematics (100.0%), and Architecture & Engineering (100.0%), while the most female-oriented occupations are Arts, Media & Entertainment (100.0%), Health Diagnosing & Treating (100.0%), and Health Technologists (100.0%).
| Occupation | Male | Female |
| Management | 53 (73.6%) | 19 (26.4%) |
| Business & Financial | 4 (40.0%) | 6 (60.0%) |
| Computers, Engineering & Science | 9 (100.0%) | 0 (0.0%) |
| Computers & Mathematics | 3 (100.0%) | 0 (0.0%) |
| Architecture & Engineering | 6 (100.0%) | 0 (0.0%) |
| Life, Physical & Social Science | 0 (0.0%) | 0 (0.0%) |
| Community & Social Service | 9 (18.8%) | 39 (81.2%) |
| Education, Arts & Media | 0 (0.0%) | 0 (0.0%) |
| Legal Services & Support | 0 (0.0%) | 0 (0.0%) |
| Education Instruction & Library | 9 (20.0%) | 36 (80.0%) |
| Arts, Media & Entertainment | 0 (0.0%) | 3 (100.0%) |
| Health Diagnosing & Treating | 0 (0.0%) | 6 (100.0%) |
| Health Technologists | 0 (0.0%) | 6 (100.0%) |
| Total (Category) | 75 (51.7%) | 70 (48.3%) |
| Total (Overall) | 376 (60.1%) | 250 (39.9%) |
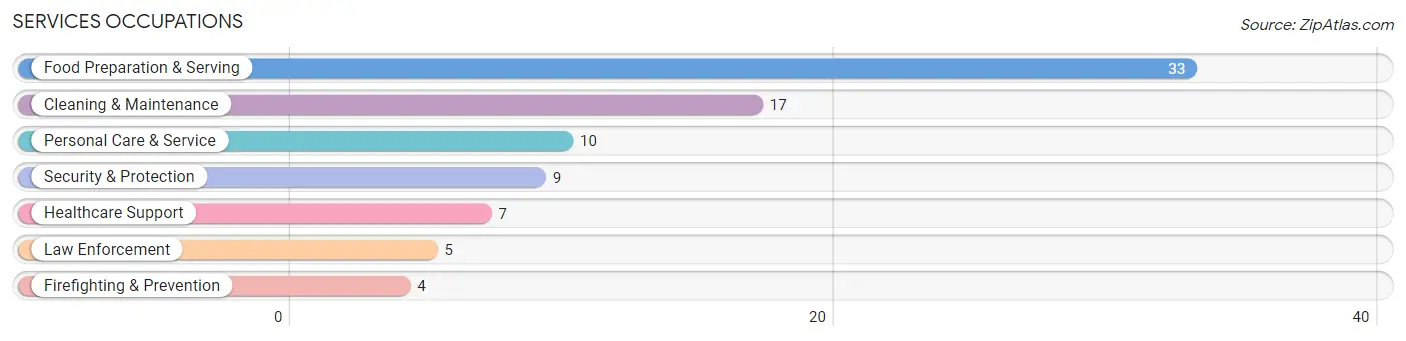
Services Occupations
The most common Services occupations in Moroni are Food Preparation & Serving (33 | 5.3%), Cleaning & Maintenance (17 | 2.7%), Personal Care & Service (10 | 1.6%), Security & Protection (9 | 1.4%), and Healthcare Support (7 | 1.1%).
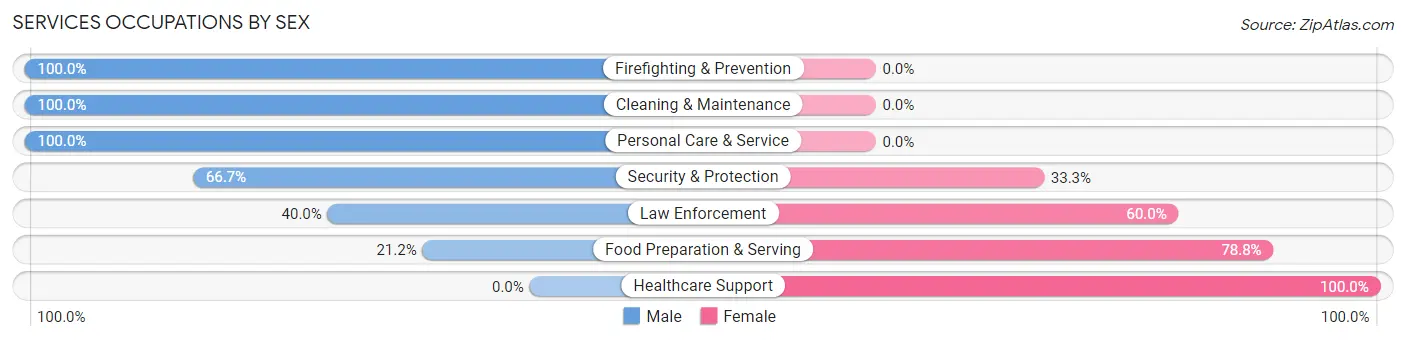
Services Occupations by Sex
Within the Services occupations in Moroni, the most male-oriented occupations are Firefighting & Prevention (100.0%), Cleaning & Maintenance (100.0%), and Personal Care & Service (100.0%), while the most female-oriented occupations are Healthcare Support (100.0%), Food Preparation & Serving (78.8%), and Law Enforcement (60.0%).
| Occupation | Male | Female |
| Healthcare Support | 0 (0.0%) | 7 (100.0%) |
| Security & Protection | 6 (66.7%) | 3 (33.3%) |
| Firefighting & Prevention | 4 (100.0%) | 0 (0.0%) |
| Law Enforcement | 2 (40.0%) | 3 (60.0%) |
| Food Preparation & Serving | 7 (21.2%) | 26 (78.8%) |
| Cleaning & Maintenance | 17 (100.0%) | 0 (0.0%) |
| Personal Care & Service | 10 (100.0%) | 0 (0.0%) |
| Total (Category) | 40 (52.6%) | 36 (47.4%) |
| Total (Overall) | 376 (60.1%) | 250 (39.9%) |
Sales and Office Occupations
The most common Sales and Office occupations in Moroni are Office & Administration (90 | 14.4%), and Sales & Related (20 | 3.2%).
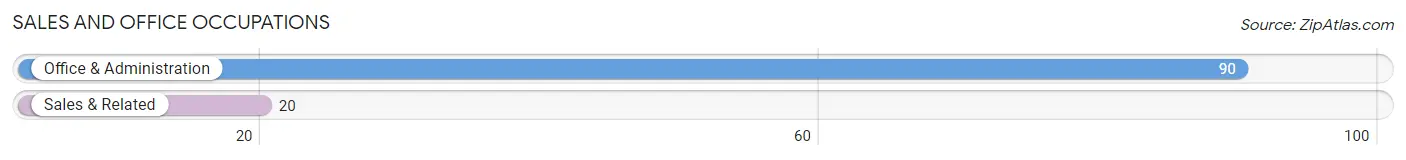
Sales and Office Occupations by Sex
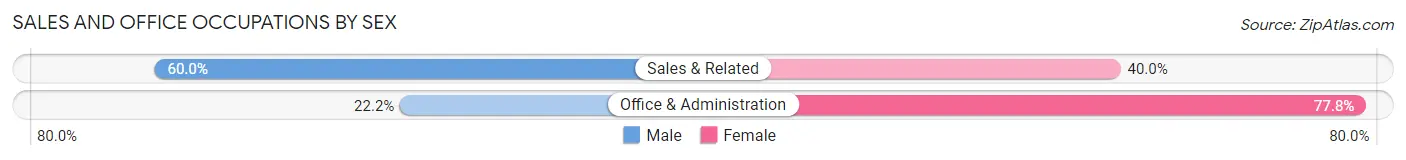
| Occupation | Male | Female |
| Sales & Related | 12 (60.0%) | 8 (40.0%) |
| Office & Administration | 20 (22.2%) | 70 (77.8%) |
| Total (Category) | 32 (29.1%) | 78 (70.9%) |
| Total (Overall) | 376 (60.1%) | 250 (39.9%) |
Natural Resources, Construction and Maintenance Occupations
The most common Natural Resources, Construction and Maintenance occupations in Moroni are Construction & Extraction (50 | 8.0%), Installation, Maintenance & Repair (29 | 4.6%), and Farming, Fishing & Forestry (25 | 4.0%).
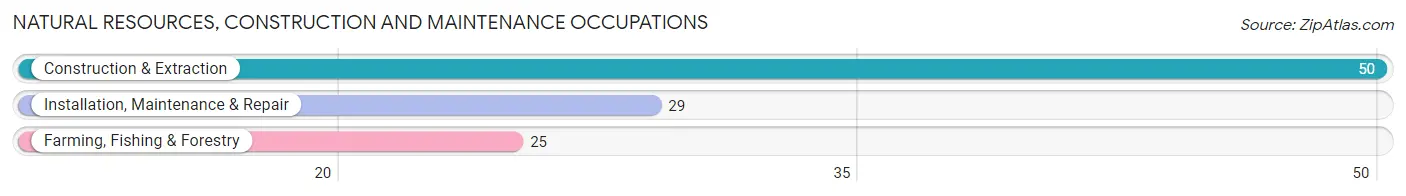
Natural Resources, Construction and Maintenance Occupations by Sex
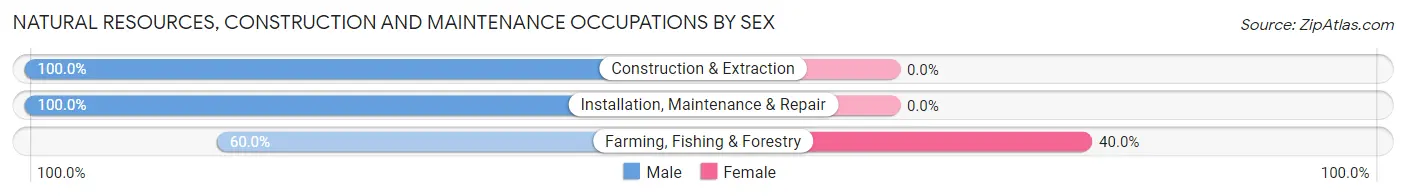
| Occupation | Male | Female |
| Farming, Fishing & Forestry | 15 (60.0%) | 10 (40.0%) |
| Construction & Extraction | 50 (100.0%) | 0 (0.0%) |
| Installation, Maintenance & Repair | 29 (100.0%) | 0 (0.0%) |
| Total (Category) | 94 (90.4%) | 10 (9.6%) |
| Total (Overall) | 376 (60.1%) | 250 (39.9%) |
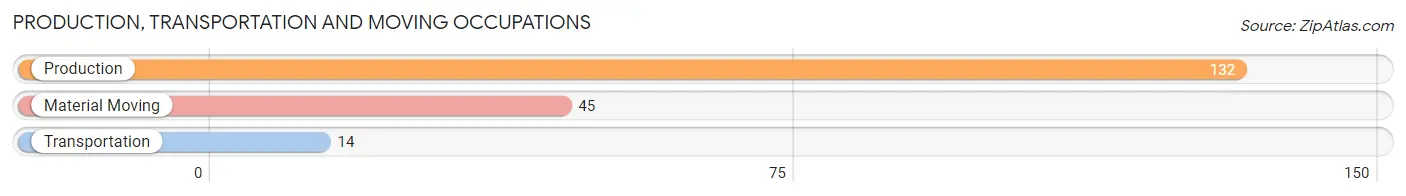
Production, Transportation and Moving Occupations
The most common Production, Transportation and Moving occupations in Moroni are Production (132 | 21.1%), Material Moving (45 | 7.2%), and Transportation (14 | 2.2%).
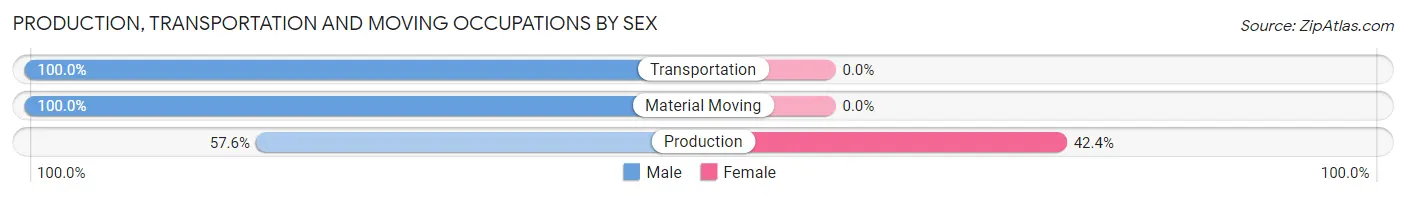
Production, Transportation and Moving Occupations by Sex
| Occupation | Male | Female |
| Production | 76 (57.6%) | 56 (42.4%) |
| Transportation | 14 (100.0%) | 0 (0.0%) |
| Material Moving | 45 (100.0%) | 0 (0.0%) |
| Total (Category) | 135 (70.7%) | 56 (29.3%) |
| Total (Overall) | 376 (60.1%) | 250 (39.9%) |
Employment Industries by Sex in Moroni
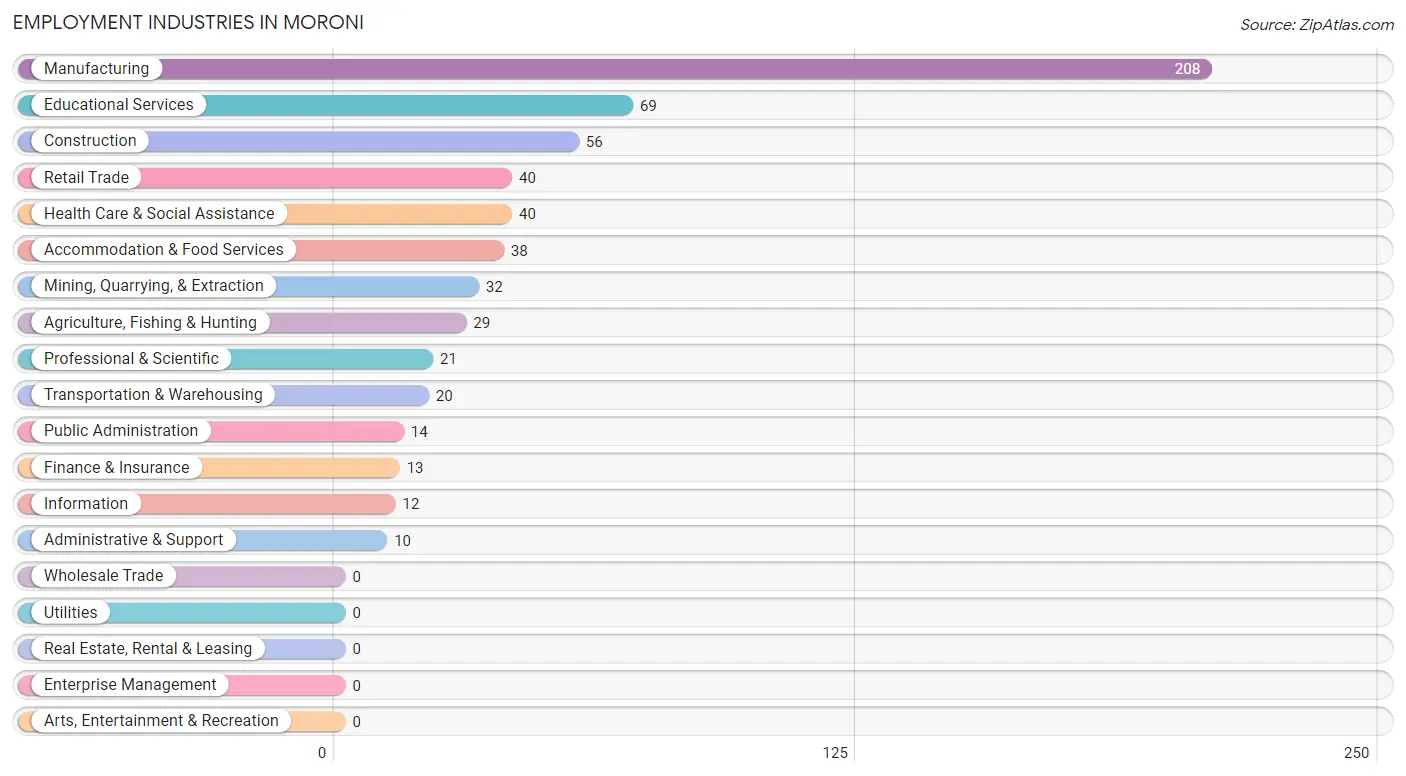
Employment Industries in Moroni
The major employment industries in Moroni include Manufacturing (208 | 33.2%), Educational Services (69 | 11.0%), Construction (56 | 8.9%), Retail Trade (40 | 6.4%), and Health Care & Social Assistance (40 | 6.4%).
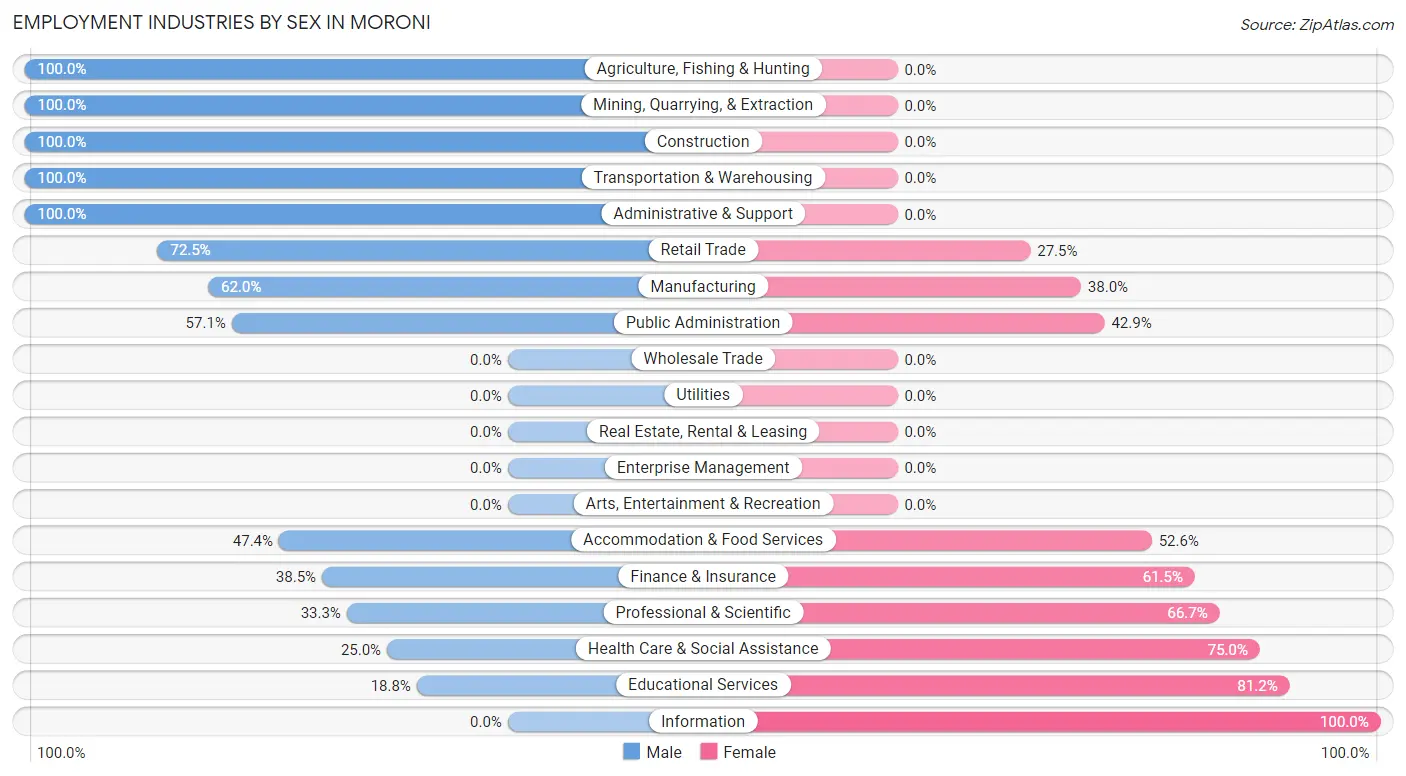
Employment Industries by Sex in Moroni
The Moroni industries that see more men than women are Agriculture, Fishing & Hunting (100.0%), Mining, Quarrying, & Extraction (100.0%), and Construction (100.0%), whereas the industries that tend to have a higher number of women are Information (100.0%), Educational Services (81.2%), and Health Care & Social Assistance (75.0%).
| Industry | Male | Female |
| Agriculture, Fishing & Hunting | 29 (100.0%) | 0 (0.0%) |
| Mining, Quarrying, & Extraction | 32 (100.0%) | 0 (0.0%) |
| Construction | 56 (100.0%) | 0 (0.0%) |
| Manufacturing | 129 (62.0%) | 79 (38.0%) |
| Wholesale Trade | 0 (0.0%) | 0 (0.0%) |
| Retail Trade | 29 (72.5%) | 11 (27.5%) |
| Transportation & Warehousing | 20 (100.0%) | 0 (0.0%) |
| Utilities | 0 (0.0%) | 0 (0.0%) |
| Information | 0 (0.0%) | 12 (100.0%) |
| Finance & Insurance | 5 (38.5%) | 8 (61.5%) |
| Real Estate, Rental & Leasing | 0 (0.0%) | 0 (0.0%) |
| Professional & Scientific | 7 (33.3%) | 14 (66.7%) |
| Enterprise Management | 0 (0.0%) | 0 (0.0%) |
| Administrative & Support | 10 (100.0%) | 0 (0.0%) |
| Educational Services | 13 (18.8%) | 56 (81.2%) |
| Health Care & Social Assistance | 10 (25.0%) | 30 (75.0%) |
| Arts, Entertainment & Recreation | 0 (0.0%) | 0 (0.0%) |
| Accommodation & Food Services | 18 (47.4%) | 20 (52.6%) |
| Public Administration | 8 (57.1%) | 6 (42.9%) |
| Total | 376 (60.1%) | 250 (39.9%) |
Education in Moroni
School Enrollment in Moroni
The most common levels of schooling among the 274 students in Moroni are high school (100 | 36.5%), middle school (60 | 21.9%), and elementary school (58 | 21.2%).
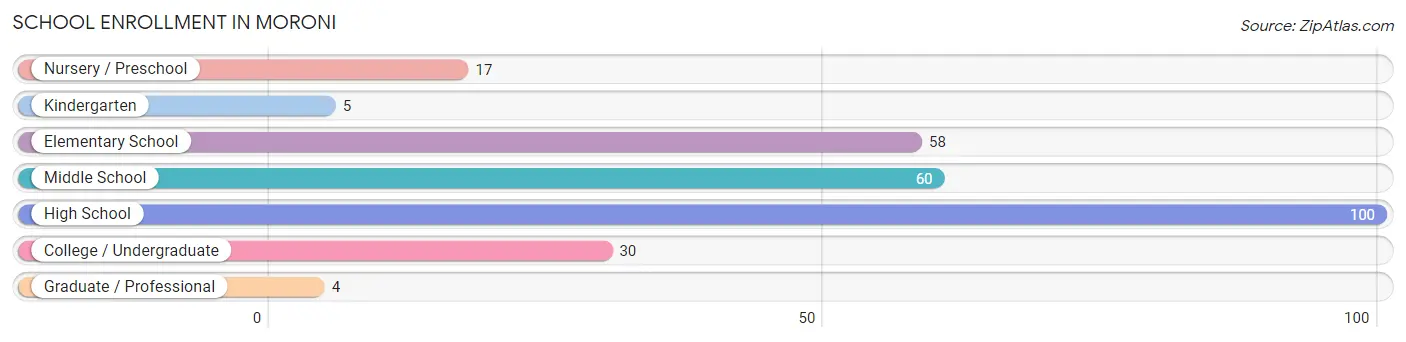
| School Level | # Students | % Students |
| Nursery / Preschool | 17 | 6.2% |
| Kindergarten | 5 | 1.8% |
| Elementary School | 58 | 21.2% |
| Middle School | 60 | 21.9% |
| High School | 100 | 36.5% |
| College / Undergraduate | 30 | 11.0% |
| Graduate / Professional | 4 | 1.5% |
| Total | 274 | 100.0% |
School Enrollment by Age by Funding Source in Moroni
Out of a total of 274 students who are enrolled in schools in Moroni, 17 (6.2%) attend a private institution, while the remaining 257 (93.8%) are enrolled in public schools. The age group of 20 to 24 year olds has the highest likelihood of being enrolled in private schools, with 5 (22.7% in the age bracket) enrolled. Conversely, the age group of 3 to 4 year olds has the lowest likelihood of being enrolled in a private school, with 5 (100.0% in the age bracket) attending a public institution.
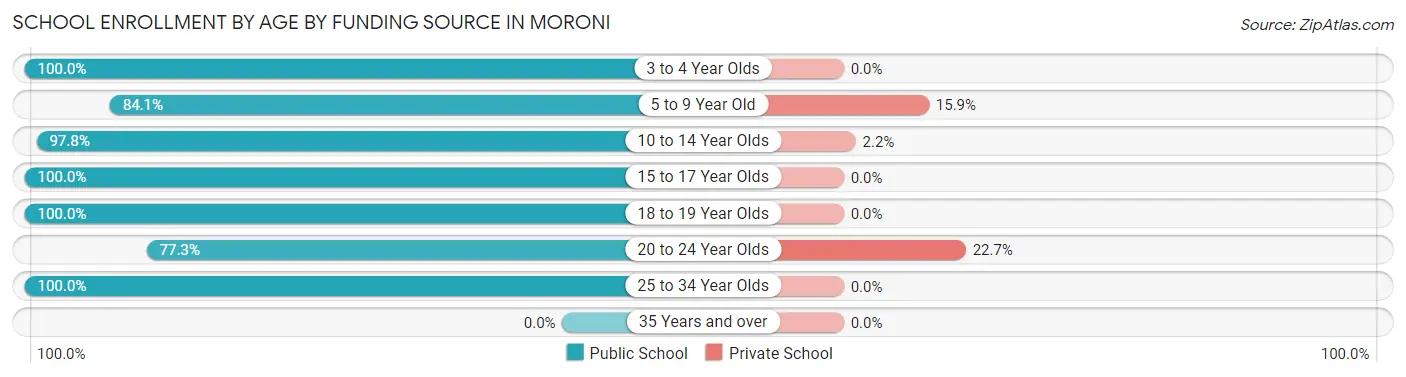
| Age Bracket | Public School | Private School |
| 3 to 4 Year Olds | 5 (100.0%) | 0 (0.0%) |
| 5 to 9 Year Old | 53 (84.1%) | 10 (15.9%) |
| 10 to 14 Year Olds | 88 (97.8%) | 2 (2.2%) |
| 15 to 17 Year Olds | 77 (100.0%) | 0 (0.0%) |
| 18 to 19 Year Olds | 5 (100.0%) | 0 (0.0%) |
| 20 to 24 Year Olds | 17 (77.3%) | 5 (22.7%) |
| 25 to 34 Year Olds | 12 (100.0%) | 0 (0.0%) |
| 35 Years and over | 0 (0.0%) | 0 (0.0%) |
| Total | 257 (93.8%) | 17 (6.2%) |
Educational Attainment by Field of Study in Moroni
Business (27 | 32.1%), computers & mathematics (12 | 14.3%), science & technology (8 | 9.5%), education (8 | 9.5%), and engineering (6 | 7.1%) are the most common fields of study among 84 individuals in Moroni who have obtained a bachelor's degree or higher.
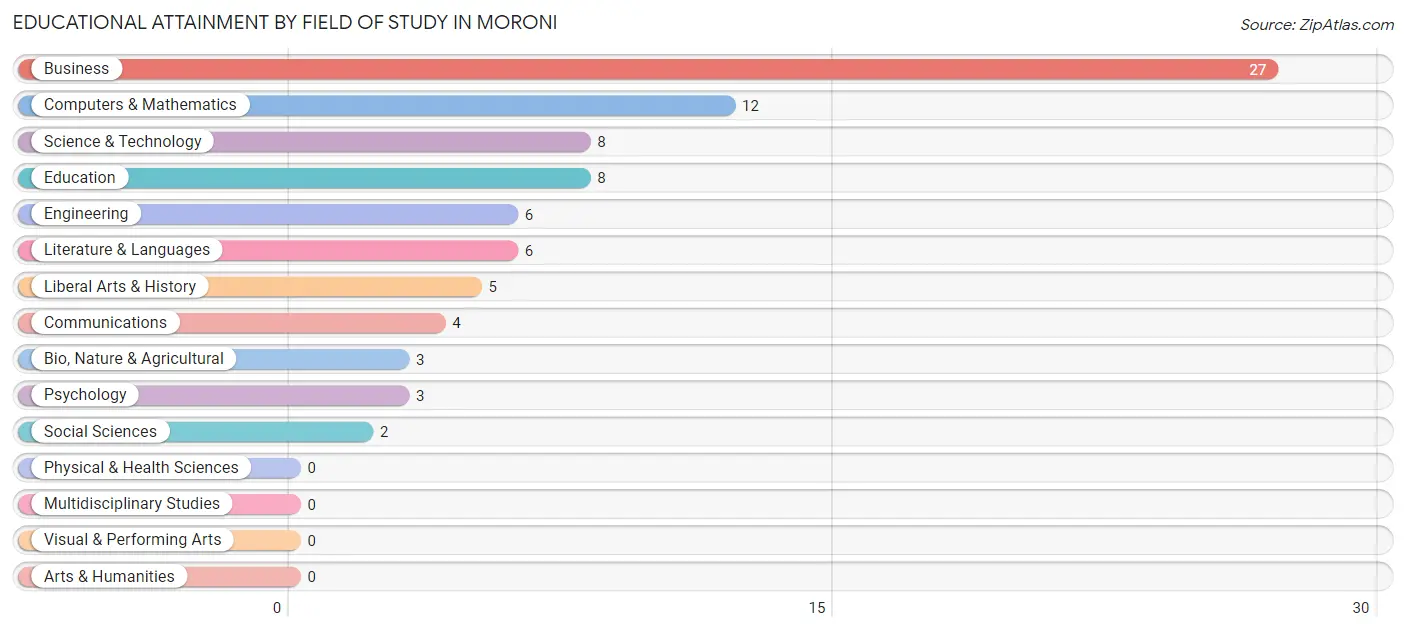
| Field of Study | # Graduates | % Graduates |
| Computers & Mathematics | 12 | 14.3% |
| Bio, Nature & Agricultural | 3 | 3.6% |
| Physical & Health Sciences | 0 | 0.0% |
| Psychology | 3 | 3.6% |
| Social Sciences | 2 | 2.4% |
| Engineering | 6 | 7.1% |
| Multidisciplinary Studies | 0 | 0.0% |
| Science & Technology | 8 | 9.5% |
| Business | 27 | 32.1% |
| Education | 8 | 9.5% |
| Literature & Languages | 6 | 7.1% |
| Liberal Arts & History | 5 | 5.9% |
| Visual & Performing Arts | 0 | 0.0% |
| Communications | 4 | 4.8% |
| Arts & Humanities | 0 | 0.0% |
| Total | 84 | 100.0% |
Transportation & Commute in Moroni
Vehicle Availability by Sex in Moroni
The most prevalent vehicle ownership categories in Moroni are males with 3 vehicles (99, accounting for 26.8%) and females with 3 vehicles (71, making up 42.5%).
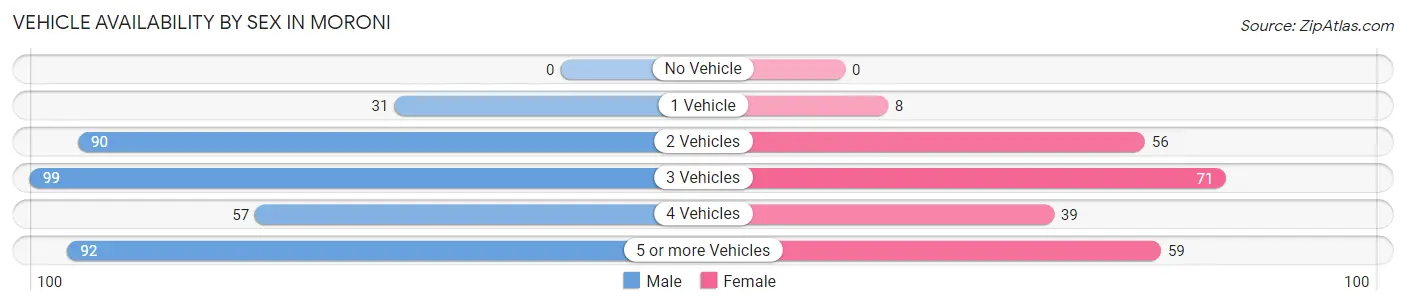
| Vehicles Available | Male | Female |
| No Vehicle | 0 (0.0%) | 0 (0.0%) |
| 1 Vehicle | 31 (8.4%) | 8 (3.4%) |
| 2 Vehicles | 90 (24.4%) | 56 (24.0%) |
| 3 Vehicles | 99 (26.8%) | 71 (30.5%) |
| 4 Vehicles | 57 (15.4%) | 39 (16.7%) |
| 5 or more Vehicles | 92 (24.9%) | 59 (25.3%) |
| Total | 369 (100.0%) | 233 (100.0%) |
Commute Time in Moroni
The most frequently occuring commute durations in Moroni are 5 to 9 minutes (165 commuters, 29.2%), less than 5 minutes (133 commuters, 23.5%), and 60 to 89 minutes (73 commuters, 12.9%).
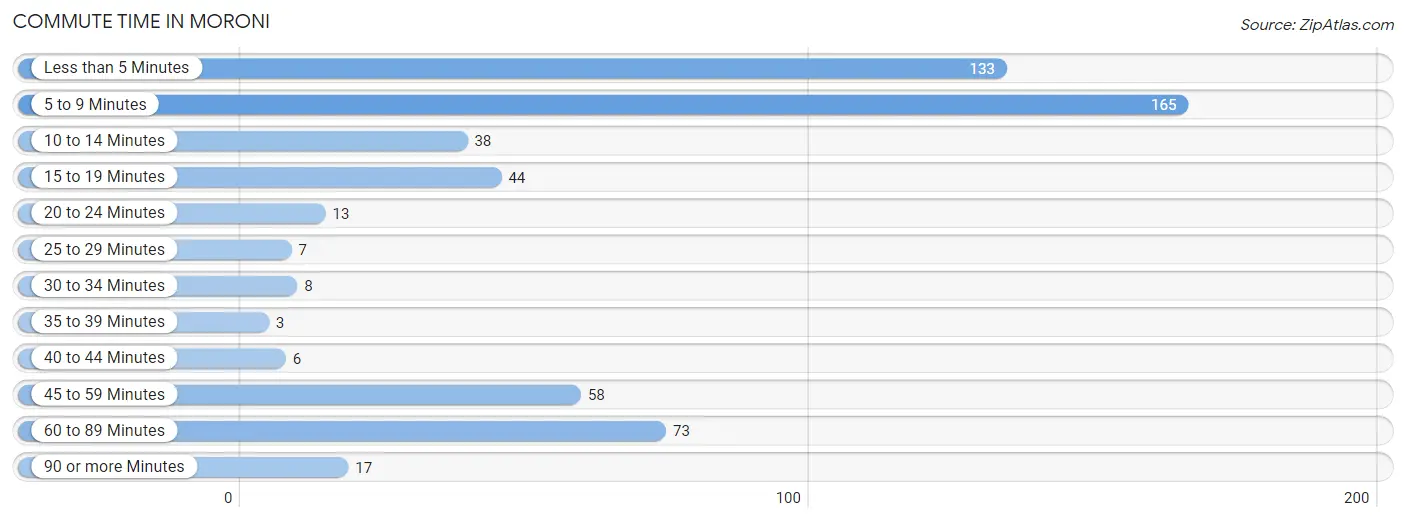
| Commute Time | # Commuters | % Commuters |
| Less than 5 Minutes | 133 | 23.5% |
| 5 to 9 Minutes | 165 | 29.2% |
| 10 to 14 Minutes | 38 | 6.7% |
| 15 to 19 Minutes | 44 | 7.8% |
| 20 to 24 Minutes | 13 | 2.3% |
| 25 to 29 Minutes | 7 | 1.2% |
| 30 to 34 Minutes | 8 | 1.4% |
| 35 to 39 Minutes | 3 | 0.5% |
| 40 to 44 Minutes | 6 | 1.1% |
| 45 to 59 Minutes | 58 | 10.3% |
| 60 to 89 Minutes | 73 | 12.9% |
| 90 or more Minutes | 17 | 3.0% |
Commute Time by Sex in Moroni
The most common commute times in Moroni are 5 to 9 minutes (73 commuters, 20.3%) for males and 5 to 9 minutes (92 commuters, 44.9%) for females.
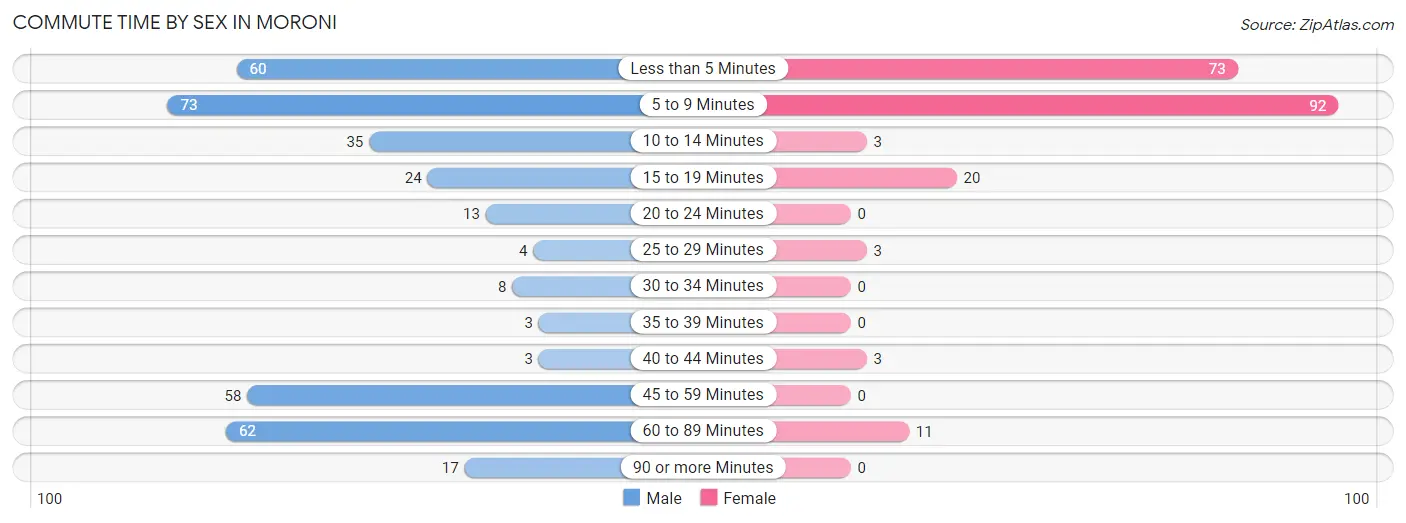
| Commute Time | Male | Female |
| Less than 5 Minutes | 60 (16.7%) | 73 (35.6%) |
| 5 to 9 Minutes | 73 (20.3%) | 92 (44.9%) |
| 10 to 14 Minutes | 35 (9.7%) | 3 (1.5%) |
| 15 to 19 Minutes | 24 (6.7%) | 20 (9.8%) |
| 20 to 24 Minutes | 13 (3.6%) | 0 (0.0%) |
| 25 to 29 Minutes | 4 (1.1%) | 3 (1.5%) |
| 30 to 34 Minutes | 8 (2.2%) | 0 (0.0%) |
| 35 to 39 Minutes | 3 (0.8%) | 0 (0.0%) |
| 40 to 44 Minutes | 3 (0.8%) | 3 (1.5%) |
| 45 to 59 Minutes | 58 (16.1%) | 0 (0.0%) |
| 60 to 89 Minutes | 62 (17.2%) | 11 (5.4%) |
| 90 or more Minutes | 17 (4.7%) | 0 (0.0%) |
Time of Departure to Work by Sex in Moroni
The most frequent times of departure to work in Moroni are 12:00 AM to 4:59 AM (87, 24.2%) for males and 8:00 AM to 8:29 AM (46, 22.4%) for females.
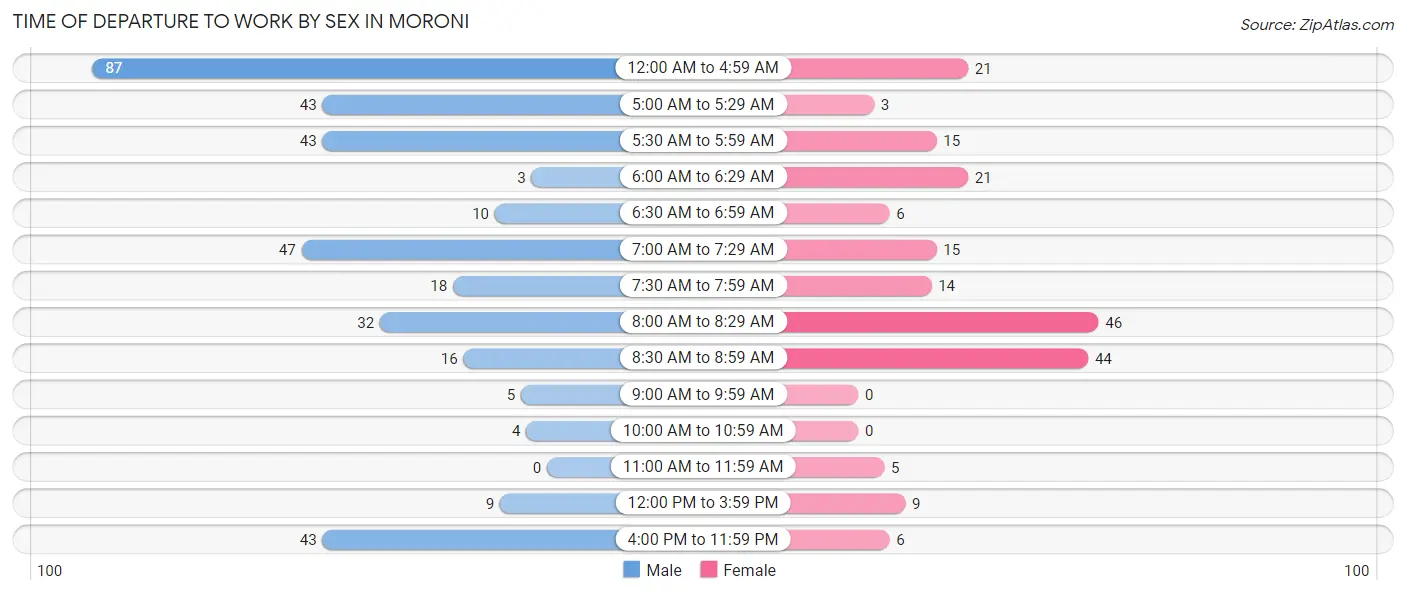
| Time of Departure | Male | Female |
| 12:00 AM to 4:59 AM | 87 (24.2%) | 21 (10.2%) |
| 5:00 AM to 5:29 AM | 43 (11.9%) | 3 (1.5%) |
| 5:30 AM to 5:59 AM | 43 (11.9%) | 15 (7.3%) |
| 6:00 AM to 6:29 AM | 3 (0.8%) | 21 (10.2%) |
| 6:30 AM to 6:59 AM | 10 (2.8%) | 6 (2.9%) |
| 7:00 AM to 7:29 AM | 47 (13.1%) | 15 (7.3%) |
| 7:30 AM to 7:59 AM | 18 (5.0%) | 14 (6.8%) |
| 8:00 AM to 8:29 AM | 32 (8.9%) | 46 (22.4%) |
| 8:30 AM to 8:59 AM | 16 (4.4%) | 44 (21.5%) |
| 9:00 AM to 9:59 AM | 5 (1.4%) | 0 (0.0%) |
| 10:00 AM to 10:59 AM | 4 (1.1%) | 0 (0.0%) |
| 11:00 AM to 11:59 AM | 0 (0.0%) | 5 (2.4%) |
| 12:00 PM to 3:59 PM | 9 (2.5%) | 9 (4.4%) |
| 4:00 PM to 11:59 PM | 43 (11.9%) | 6 (2.9%) |
| Total | 360 (100.0%) | 205 (100.0%) |
Housing Occupancy in Moroni
Occupancy by Ownership in Moroni
Of the total 438 dwellings in Moroni, owner-occupied units account for 418 (95.4%), while renter-occupied units make up 20 (4.6%).
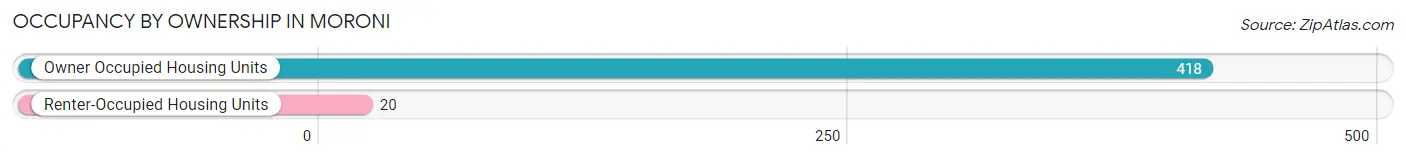
| Occupancy | # Housing Units | % Housing Units |
| Owner Occupied Housing Units | 418 | 95.4% |
| Renter-Occupied Housing Units | 20 | 4.6% |
| Total Occupied Housing Units | 438 | 100.0% |
Occupancy by Household Size in Moroni
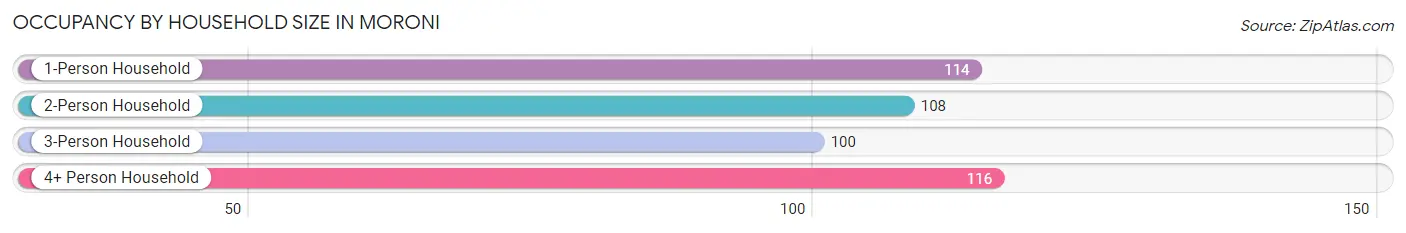
| Household Size | # Housing Units | % Housing Units |
| 1-Person Household | 114 | 26.0% |
| 2-Person Household | 108 | 24.7% |
| 3-Person Household | 100 | 22.8% |
| 4+ Person Household | 116 | 26.5% |
| Total Housing Units | 438 | 100.0% |
Occupancy by Ownership by Household Size in Moroni
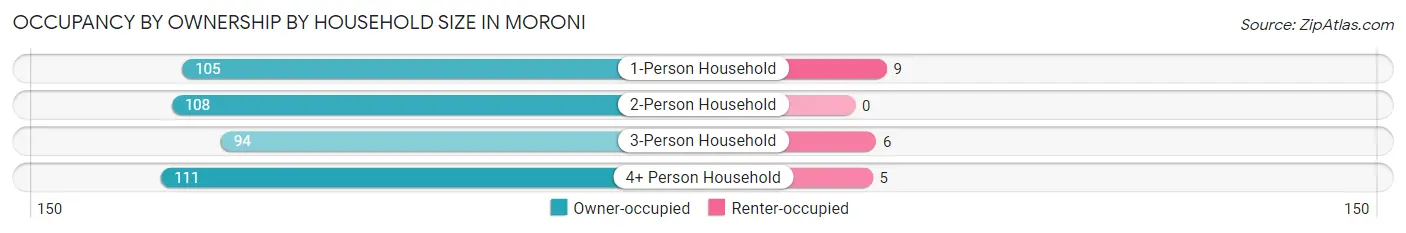
| Household Size | Owner-occupied | Renter-occupied |
| 1-Person Household | 105 (92.1%) | 9 (7.9%) |
| 2-Person Household | 108 (100.0%) | 0 (0.0%) |
| 3-Person Household | 94 (94.0%) | 6 (6.0%) |
| 4+ Person Household | 111 (95.7%) | 5 (4.3%) |
| Total Housing Units | 418 (95.4%) | 20 (4.6%) |
Occupancy by Educational Attainment in Moroni
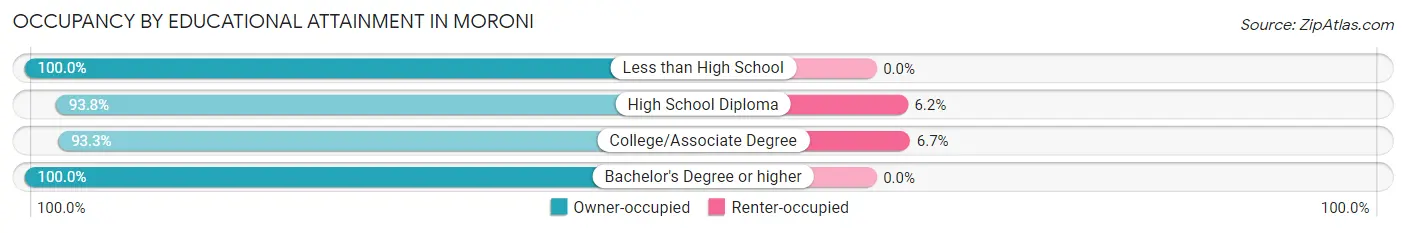
| Household Size | Owner-occupied | Renter-occupied |
| Less than High School | 94 (100.0%) | 0 (0.0%) |
| High School Diploma | 121 (93.8%) | 8 (6.2%) |
| College/Associate Degree | 168 (93.3%) | 12 (6.7%) |
| Bachelor's Degree or higher | 35 (100.0%) | 0 (0.0%) |
Occupancy by Age of Householder in Moroni
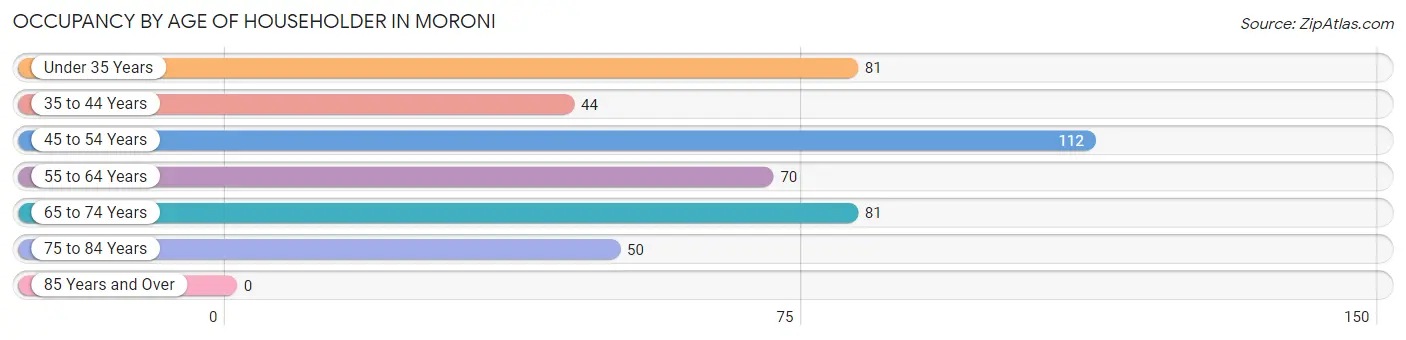
| Age Bracket | # Households | % Households |
| Under 35 Years | 81 | 18.5% |
| 35 to 44 Years | 44 | 10.1% |
| 45 to 54 Years | 112 | 25.6% |
| 55 to 64 Years | 70 | 16.0% |
| 65 to 74 Years | 81 | 18.5% |
| 75 to 84 Years | 50 | 11.4% |
| 85 Years and Over | 0 | 0.0% |
| Total | 438 | 100.0% |
Housing Finances in Moroni
Median Income by Occupancy in Moroni
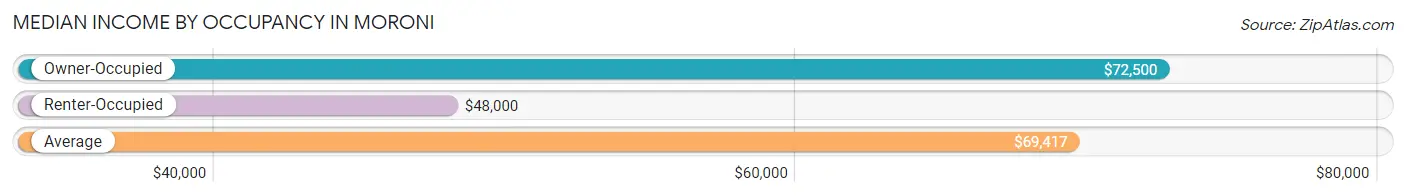
| Occupancy Type | # Households | Median Income |
| Owner-Occupied | 418 (95.4%) | $72,500 |
| Renter-Occupied | 20 (4.6%) | $48,000 |
| Average | 438 (100.0%) | $69,417 |
Occupancy by Householder Income Bracket in Moroni
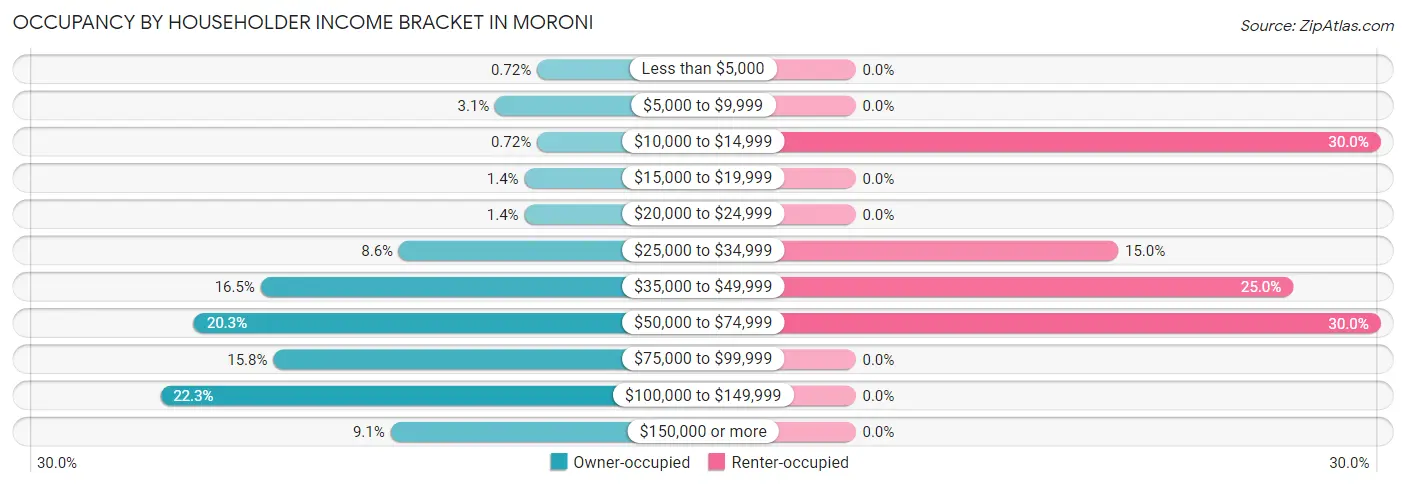
| Income Bracket | Owner-occupied | Renter-occupied |
| Less than $5,000 | 3 (0.7%) | 0 (0.0%) |
| $5,000 to $9,999 | 13 (3.1%) | 0 (0.0%) |
| $10,000 to $14,999 | 3 (0.7%) | 6 (30.0%) |
| $15,000 to $19,999 | 6 (1.4%) | 0 (0.0%) |
| $20,000 to $24,999 | 6 (1.4%) | 0 (0.0%) |
| $25,000 to $34,999 | 36 (8.6%) | 3 (15.0%) |
| $35,000 to $49,999 | 69 (16.5%) | 5 (25.0%) |
| $50,000 to $74,999 | 85 (20.3%) | 6 (30.0%) |
| $75,000 to $99,999 | 66 (15.8%) | 0 (0.0%) |
| $100,000 to $149,999 | 93 (22.3%) | 0 (0.0%) |
| $150,000 or more | 38 (9.1%) | 0 (0.0%) |
| Total | 418 (100.0%) | 20 (100.0%) |
Monthly Housing Cost Tiers in Moroni
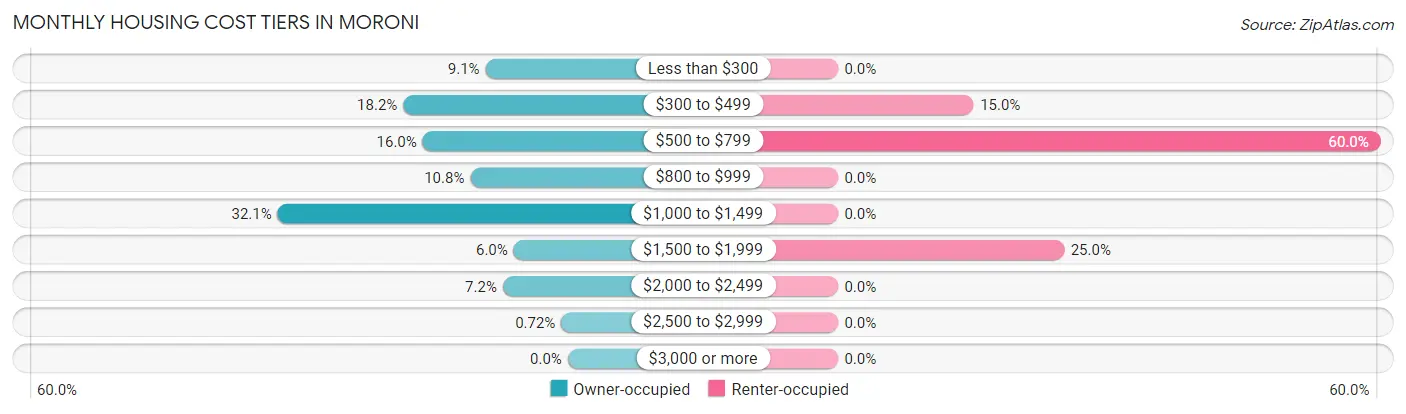
| Monthly Cost | Owner-occupied | Renter-occupied |
| Less than $300 | 38 (9.1%) | 0 (0.0%) |
| $300 to $499 | 76 (18.2%) | 3 (15.0%) |
| $500 to $799 | 67 (16.0%) | 12 (60.0%) |
| $800 to $999 | 45 (10.8%) | 0 (0.0%) |
| $1,000 to $1,499 | 134 (32.1%) | 0 (0.0%) |
| $1,500 to $1,999 | 25 (6.0%) | 5 (25.0%) |
| $2,000 to $2,499 | 30 (7.2%) | 0 (0.0%) |
| $2,500 to $2,999 | 3 (0.7%) | 0 (0.0%) |
| $3,000 or more | 0 (0.0%) | 0 (0.0%) |
| Total | 418 (100.0%) | 20 (100.0%) |
Physical Housing Characteristics in Moroni
Housing Structures in Moroni
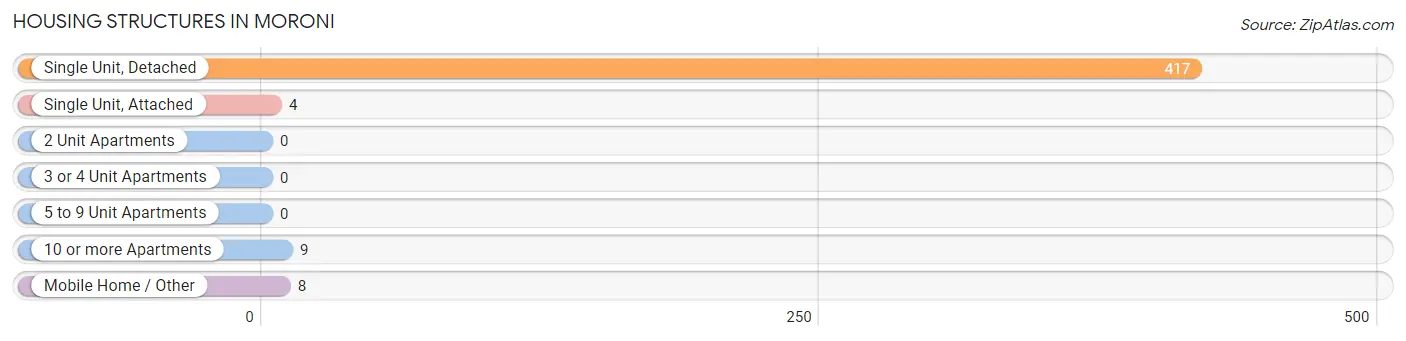
| Structure Type | # Housing Units | % Housing Units |
| Single Unit, Detached | 417 | 95.2% |
| Single Unit, Attached | 4 | 0.9% |
| 2 Unit Apartments | 0 | 0.0% |
| 3 or 4 Unit Apartments | 0 | 0.0% |
| 5 to 9 Unit Apartments | 0 | 0.0% |
| 10 or more Apartments | 9 | 2.1% |
| Mobile Home / Other | 8 | 1.8% |
| Total | 438 | 100.0% |
Housing Structures by Occupancy in Moroni
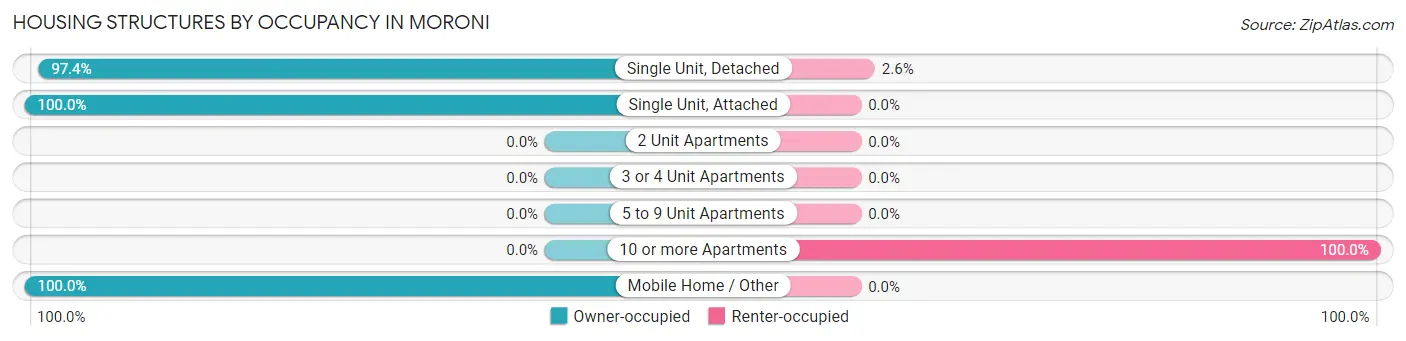
| Structure Type | Owner-occupied | Renter-occupied |
| Single Unit, Detached | 406 (97.4%) | 11 (2.6%) |
| Single Unit, Attached | 4 (100.0%) | 0 (0.0%) |
| 2 Unit Apartments | 0 (0.0%) | 0 (0.0%) |
| 3 or 4 Unit Apartments | 0 (0.0%) | 0 (0.0%) |
| 5 to 9 Unit Apartments | 0 (0.0%) | 0 (0.0%) |
| 10 or more Apartments | 0 (0.0%) | 9 (100.0%) |
| Mobile Home / Other | 8 (100.0%) | 0 (0.0%) |
| Total | 418 (95.4%) | 20 (4.6%) |
Housing Structures by Number of Rooms in Moroni
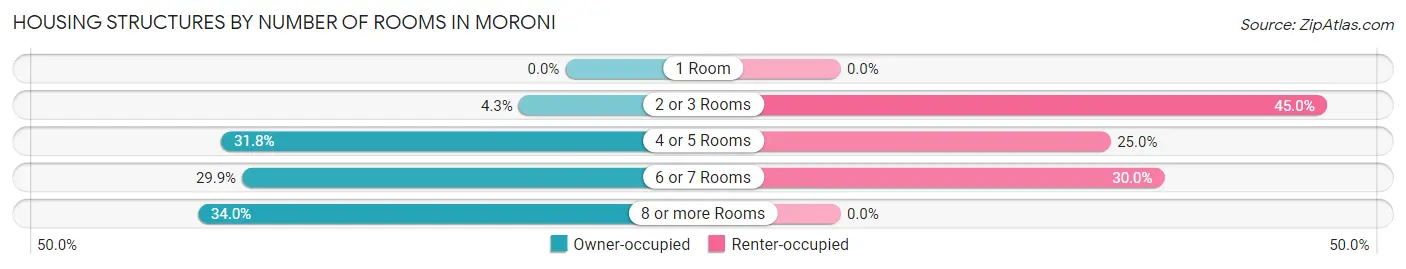
| Number of Rooms | Owner-occupied | Renter-occupied |
| 1 Room | 0 (0.0%) | 0 (0.0%) |
| 2 or 3 Rooms | 18 (4.3%) | 9 (45.0%) |
| 4 or 5 Rooms | 133 (31.8%) | 5 (25.0%) |
| 6 or 7 Rooms | 125 (29.9%) | 6 (30.0%) |
| 8 or more Rooms | 142 (34.0%) | 0 (0.0%) |
| Total | 418 (100.0%) | 20 (100.0%) |
Housing Structure by Heating Type in Moroni
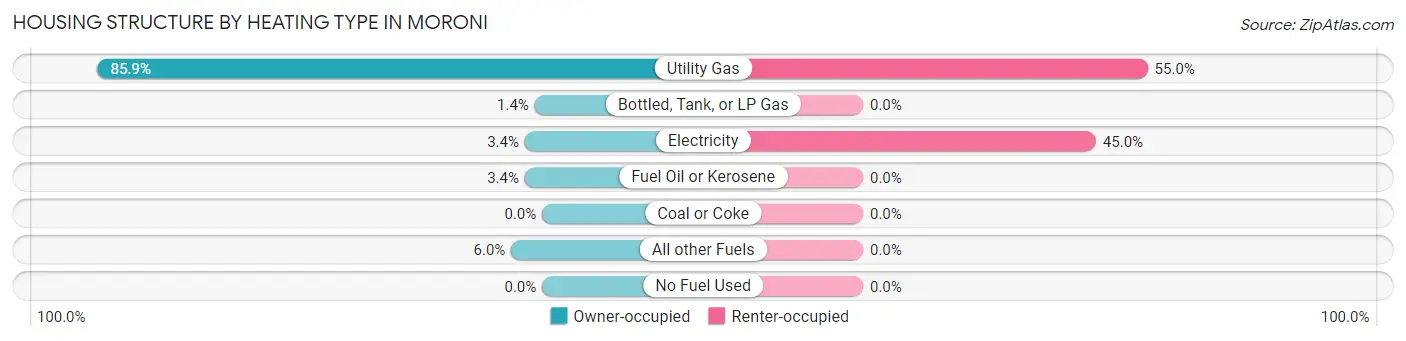
| Heating Type | Owner-occupied | Renter-occupied |
| Utility Gas | 359 (85.9%) | 11 (55.0%) |
| Bottled, Tank, or LP Gas | 6 (1.4%) | 0 (0.0%) |
| Electricity | 14 (3.4%) | 9 (45.0%) |
| Fuel Oil or Kerosene | 14 (3.4%) | 0 (0.0%) |
| Coal or Coke | 0 (0.0%) | 0 (0.0%) |
| All other Fuels | 25 (6.0%) | 0 (0.0%) |
| No Fuel Used | 0 (0.0%) | 0 (0.0%) |
| Total | 418 (100.0%) | 20 (100.0%) |
Household Vehicle Usage in Moroni
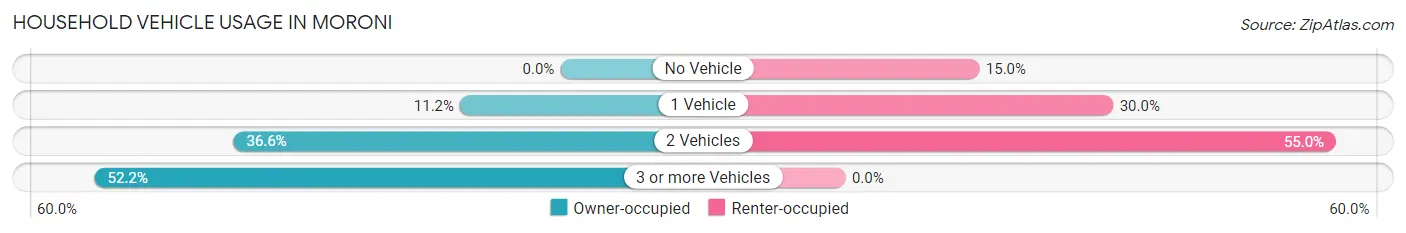
| Vehicles per Household | Owner-occupied | Renter-occupied |
| No Vehicle | 0 (0.0%) | 3 (15.0%) |
| 1 Vehicle | 47 (11.2%) | 6 (30.0%) |
| 2 Vehicles | 153 (36.6%) | 11 (55.0%) |
| 3 or more Vehicles | 218 (52.1%) | 0 (0.0%) |
| Total | 418 (100.0%) | 20 (100.0%) |
Real Estate & Mortgages in Moroni
Real Estate and Mortgage Overview in Moroni
| Characteristic | Without Mortgage | With Mortgage |
| Housing Units | 137 | 281 |
| Median Property Value | $186,400 | $232,300 |
| Median Household Income | $61,875 | $26 |
| Monthly Housing Costs | $376 | $0 |
| Real Estate Taxes | $1,125 | $10 |
Property Value by Mortgage Status in Moroni
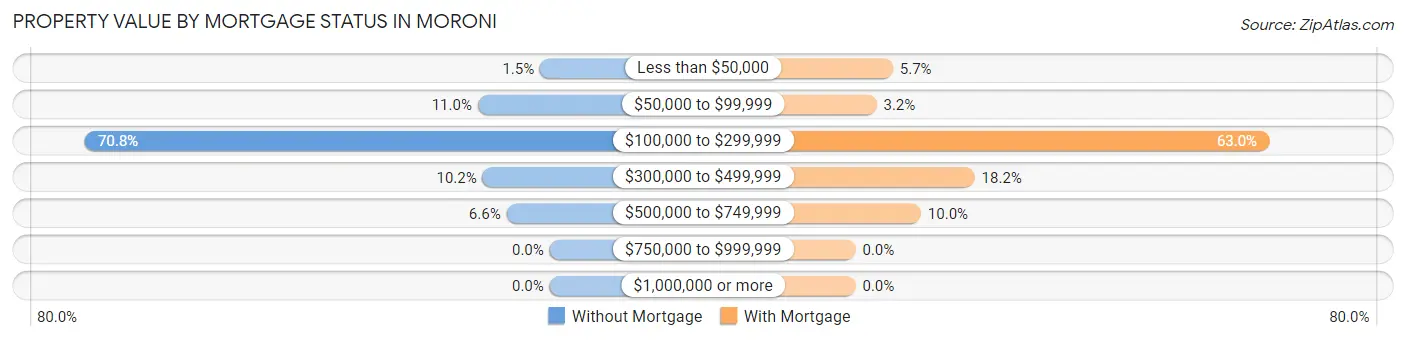
| Property Value | Without Mortgage | With Mortgage |
| Less than $50,000 | 2 (1.5%) | 16 (5.7%) |
| $50,000 to $99,999 | 15 (11.0%) | 9 (3.2%) |
| $100,000 to $299,999 | 97 (70.8%) | 177 (63.0%) |
| $300,000 to $499,999 | 14 (10.2%) | 51 (18.1%) |
| $500,000 to $749,999 | 9 (6.6%) | 28 (10.0%) |
| $750,000 to $999,999 | 0 (0.0%) | 0 (0.0%) |
| $1,000,000 or more | 0 (0.0%) | 0 (0.0%) |
| Total | 137 (100.0%) | 281 (100.0%) |
Household Income by Mortgage Status in Moroni
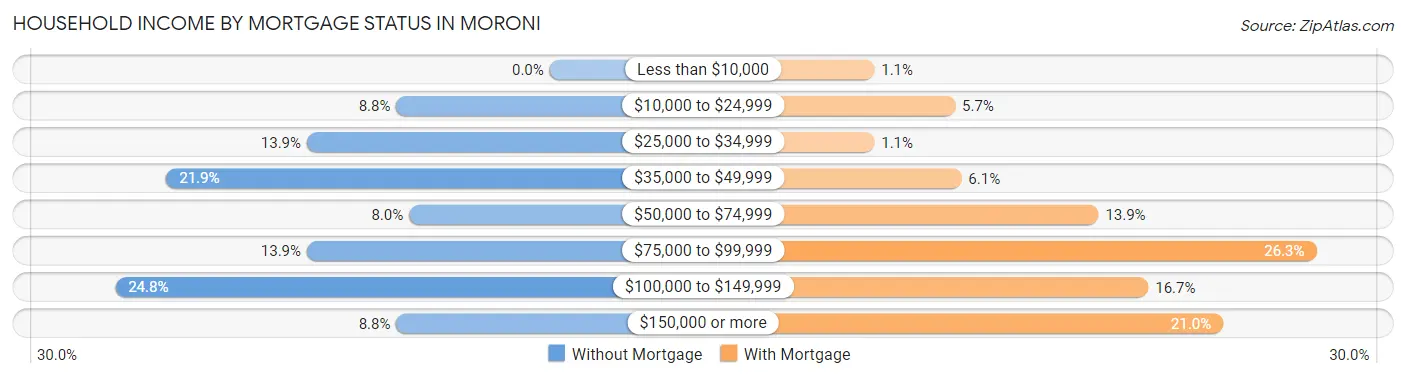
| Household Income | Without Mortgage | With Mortgage |
| Less than $10,000 | 0 (0.0%) | 3 (1.1%) |
| $10,000 to $24,999 | 12 (8.8%) | 16 (5.7%) |
| $25,000 to $34,999 | 19 (13.9%) | 3 (1.1%) |
| $35,000 to $49,999 | 30 (21.9%) | 17 (6.0%) |
| $50,000 to $74,999 | 11 (8.0%) | 39 (13.9%) |
| $75,000 to $99,999 | 19 (13.9%) | 74 (26.3%) |
| $100,000 to $149,999 | 34 (24.8%) | 47 (16.7%) |
| $150,000 or more | 12 (8.8%) | 59 (21.0%) |
| Total | 137 (100.0%) | 281 (100.0%) |
Property Value to Household Income Ratio in Moroni
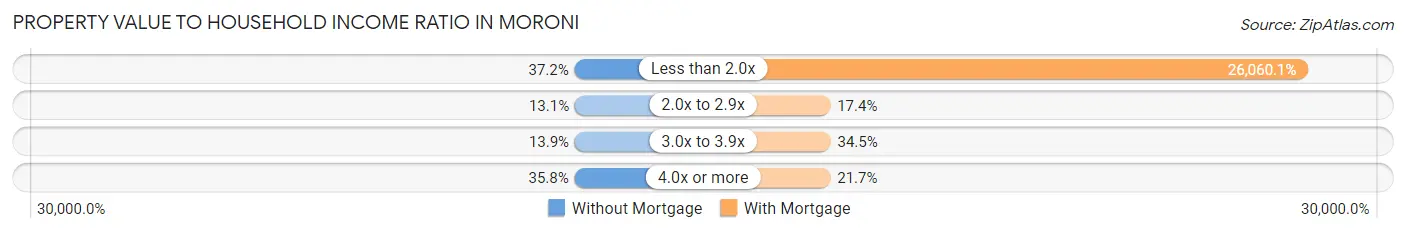
| Value-to-Income Ratio | Without Mortgage | With Mortgage |
| Less than 2.0x | 51 (37.2%) | 73,229 (26,060.1%) |
| 2.0x to 2.9x | 18 (13.1%) | 49 (17.4%) |
| 3.0x to 3.9x | 19 (13.9%) | 97 (34.5%) |
| 4.0x or more | 49 (35.8%) | 61 (21.7%) |
| Total | 137 (100.0%) | 281 (100.0%) |
Real Estate Taxes by Mortgage Status in Moroni
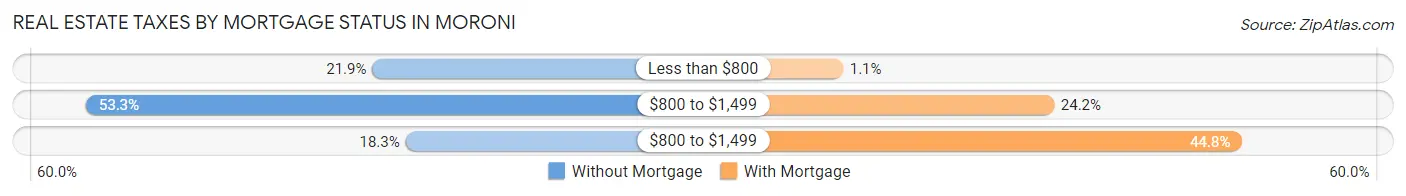
| Property Taxes | Without Mortgage | With Mortgage |
| Less than $800 | 30 (21.9%) | 3 (1.1%) |
| $800 to $1,499 | 73 (53.3%) | 68 (24.2%) |
| $800 to $1,499 | 25 (18.2%) | 126 (44.8%) |
| Total | 137 (100.0%) | 281 (100.0%) |
Health & Disability in Moroni
Health Insurance Coverage by Age in Moroni
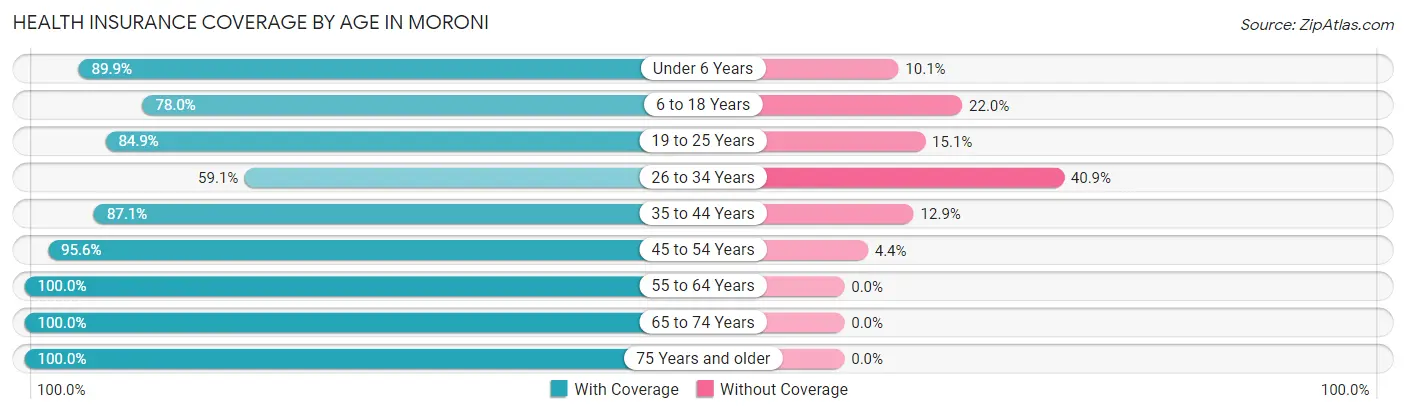
| Age Bracket | With Coverage | Without Coverage |
| Under 6 Years | 98 (89.9%) | 11 (10.1%) |
| 6 to 18 Years | 174 (78.0%) | 49 (22.0%) |
| 19 to 25 Years | 152 (84.9%) | 27 (15.1%) |
| 26 to 34 Years | 75 (59.1%) | 52 (40.9%) |
| 35 to 44 Years | 101 (87.1%) | 15 (12.9%) |
| 45 to 54 Years | 153 (95.6%) | 7 (4.4%) |
| 55 to 64 Years | 172 (100.0%) | 0 (0.0%) |
| 65 to 74 Years | 114 (100.0%) | 0 (0.0%) |
| 75 Years and older | 59 (100.0%) | 0 (0.0%) |
| Total | 1,098 (87.2%) | 161 (12.8%) |
Health Insurance Coverage by Citizenship Status in Moroni
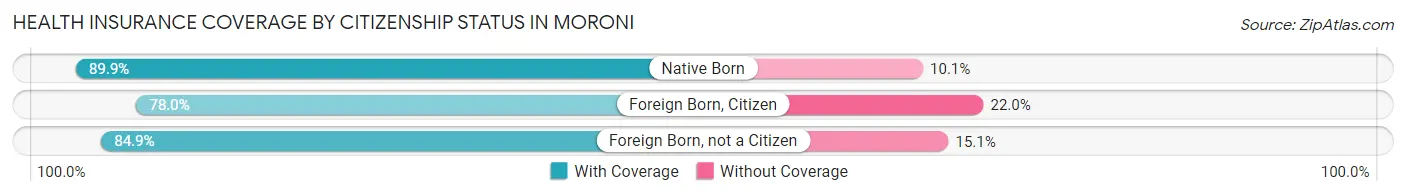
| Citizenship Status | With Coverage | Without Coverage |
| Native Born | 98 (89.9%) | 11 (10.1%) |
| Foreign Born, Citizen | 174 (78.0%) | 49 (22.0%) |
| Foreign Born, not a Citizen | 152 (84.9%) | 27 (15.1%) |
Health Insurance Coverage by Household Income in Moroni
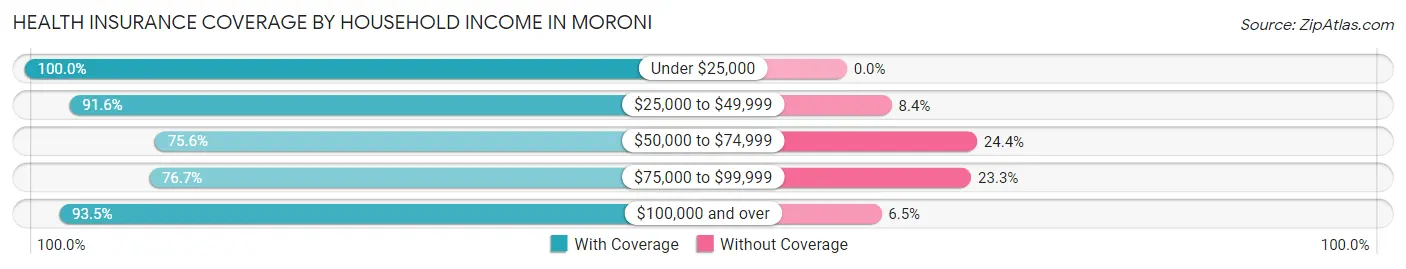
| Household Income | With Coverage | Without Coverage |
| Under $25,000 | 52 (100.0%) | 0 (0.0%) |
| $25,000 to $49,999 | 229 (91.6%) | 21 (8.4%) |
| $50,000 to $74,999 | 183 (75.6%) | 59 (24.4%) |
| $75,000 to $99,999 | 158 (76.7%) | 48 (23.3%) |
| $100,000 and over | 476 (93.5%) | 33 (6.5%) |
Public vs Private Health Insurance Coverage by Age in Moroni
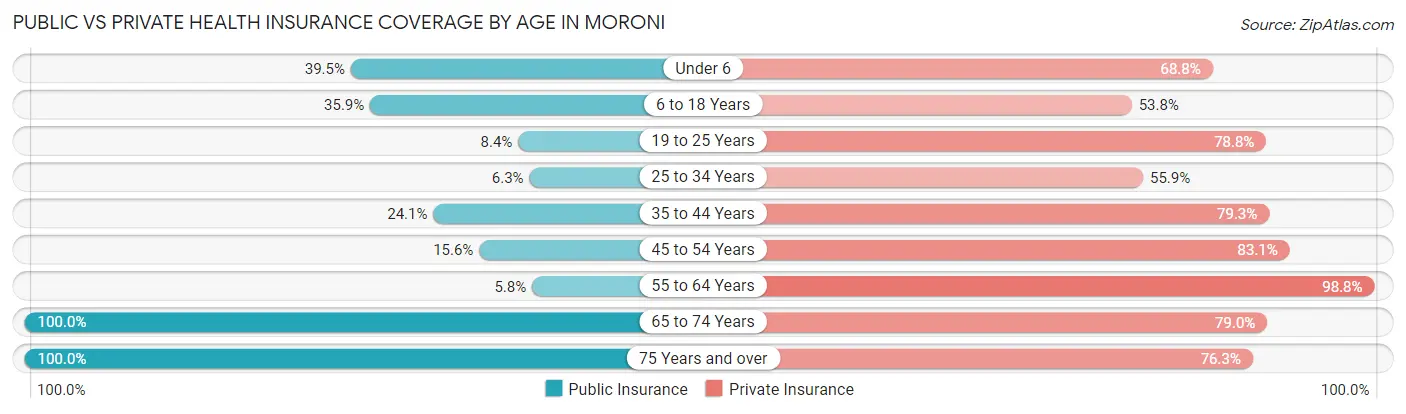
| Age Bracket | Public Insurance | Private Insurance |
| Under 6 | 43 (39.5%) | 75 (68.8%) |
| 6 to 18 Years | 80 (35.9%) | 120 (53.8%) |
| 19 to 25 Years | 15 (8.4%) | 141 (78.8%) |
| 25 to 34 Years | 8 (6.3%) | 71 (55.9%) |
| 35 to 44 Years | 28 (24.1%) | 92 (79.3%) |
| 45 to 54 Years | 25 (15.6%) | 133 (83.1%) |
| 55 to 64 Years | 10 (5.8%) | 170 (98.8%) |
| 65 to 74 Years | 114 (100.0%) | 90 (78.9%) |
| 75 Years and over | 59 (100.0%) | 45 (76.3%) |
| Total | 382 (30.3%) | 937 (74.4%) |
Disability Status by Sex by Age in Moroni
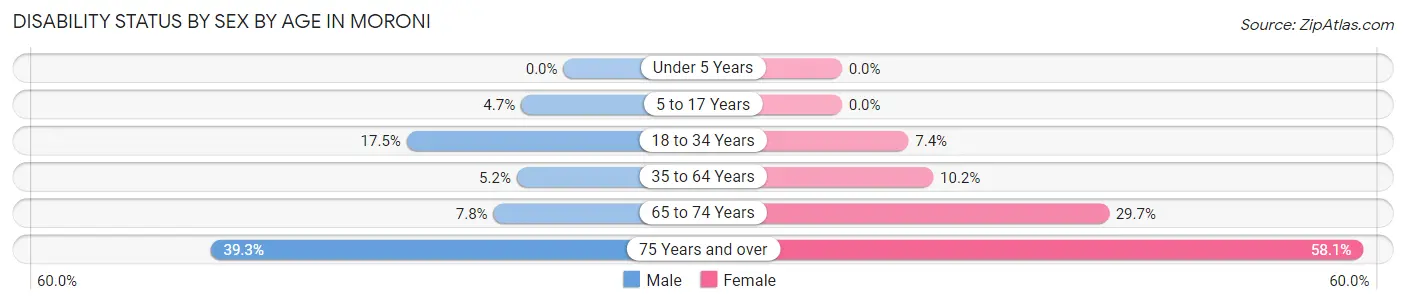
| Age Bracket | Male | Female |
| Under 5 Years | 0 (0.0%) | 0 (0.0%) |
| 5 to 17 Years | 5 (4.7%) | 0 (0.0%) |
| 18 to 34 Years | 26 (17.4%) | 12 (7.4%) |
| 35 to 64 Years | 11 (5.2%) | 24 (10.2%) |
| 65 to 74 Years | 6 (7.8%) | 11 (29.7%) |
| 75 Years and over | 11 (39.3%) | 18 (58.1%) |
Disability Class by Sex by Age in Moroni
Disability Class: Hearing Difficulty
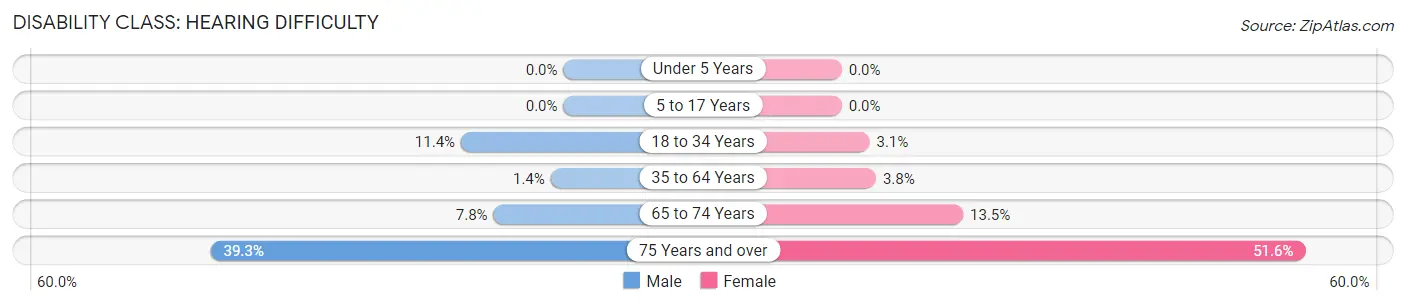
| Age Bracket | Male | Female |
| Under 5 Years | 0 (0.0%) | 0 (0.0%) |
| 5 to 17 Years | 0 (0.0%) | 0 (0.0%) |
| 18 to 34 Years | 17 (11.4%) | 5 (3.1%) |
| 35 to 64 Years | 3 (1.4%) | 9 (3.8%) |
| 65 to 74 Years | 6 (7.8%) | 5 (13.5%) |
| 75 Years and over | 11 (39.3%) | 16 (51.6%) |
Disability Class: Vision Difficulty
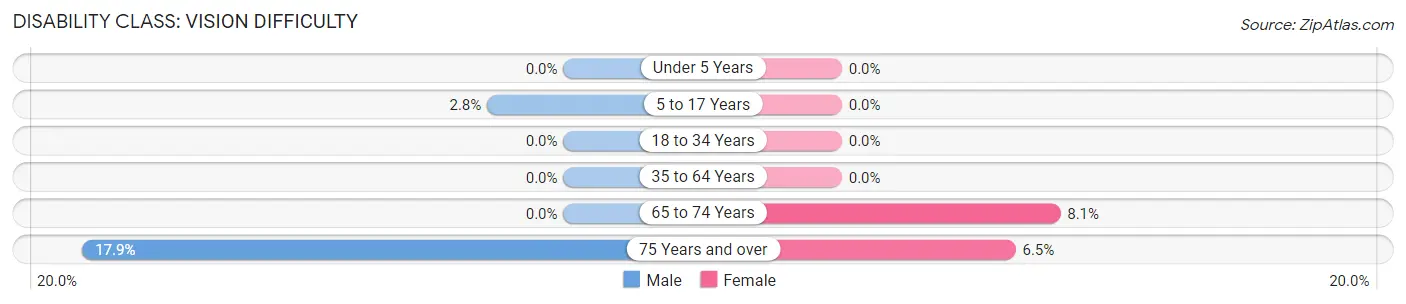
| Age Bracket | Male | Female |
| Under 5 Years | 0 (0.0%) | 0 (0.0%) |
| 5 to 17 Years | 3 (2.8%) | 0 (0.0%) |
| 18 to 34 Years | 0 (0.0%) | 0 (0.0%) |
| 35 to 64 Years | 0 (0.0%) | 0 (0.0%) |
| 65 to 74 Years | 0 (0.0%) | 3 (8.1%) |
| 75 Years and over | 5 (17.9%) | 2 (6.5%) |
Disability Class: Cognitive Difficulty
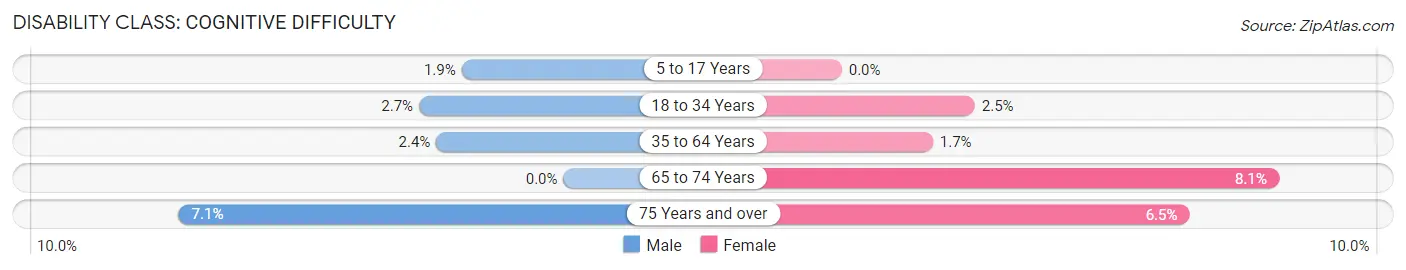
| Age Bracket | Male | Female |
| 5 to 17 Years | 2 (1.9%) | 0 (0.0%) |
| 18 to 34 Years | 4 (2.7%) | 4 (2.5%) |
| 35 to 64 Years | 5 (2.4%) | 4 (1.7%) |
| 65 to 74 Years | 0 (0.0%) | 3 (8.1%) |
| 75 Years and over | 2 (7.1%) | 2 (6.5%) |
Disability Class: Ambulatory Difficulty
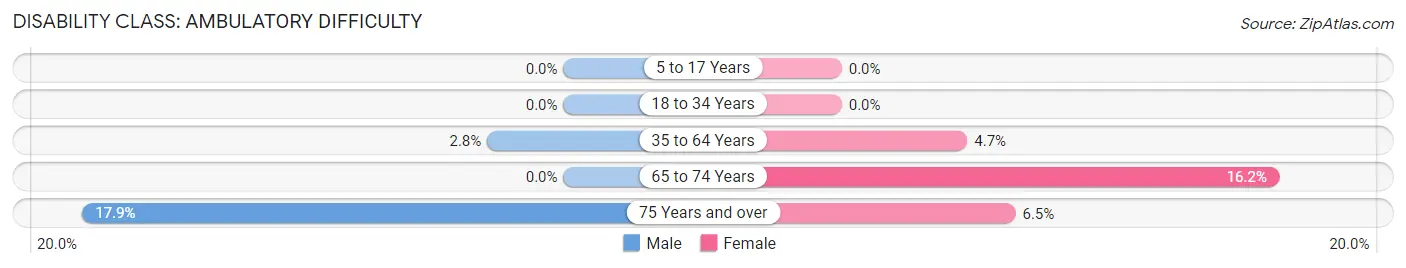
| Age Bracket | Male | Female |
| 5 to 17 Years | 0 (0.0%) | 0 (0.0%) |
| 18 to 34 Years | 0 (0.0%) | 0 (0.0%) |
| 35 to 64 Years | 6 (2.8%) | 11 (4.7%) |
| 65 to 74 Years | 0 (0.0%) | 6 (16.2%) |
| 75 Years and over | 5 (17.9%) | 2 (6.5%) |
Disability Class: Self-Care Difficulty
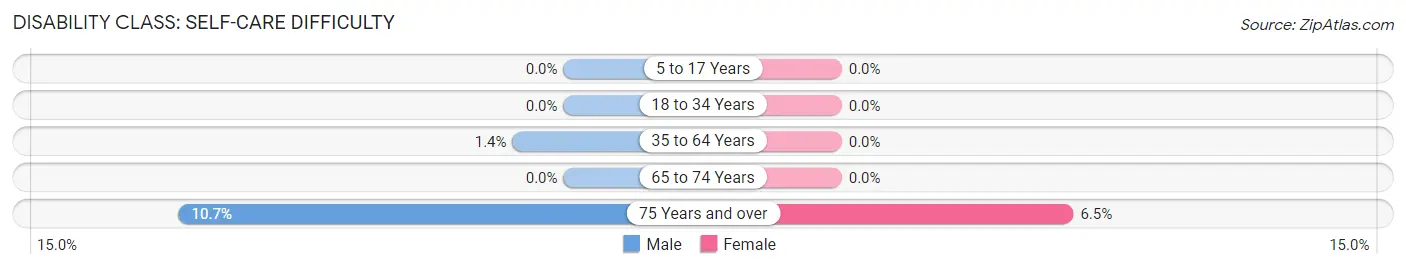
| Age Bracket | Male | Female |
| 5 to 17 Years | 0 (0.0%) | 0 (0.0%) |
| 18 to 34 Years | 0 (0.0%) | 0 (0.0%) |
| 35 to 64 Years | 3 (1.4%) | 0 (0.0%) |
| 65 to 74 Years | 0 (0.0%) | 0 (0.0%) |
| 75 Years and over | 3 (10.7%) | 2 (6.5%) |
Technology Access in Moroni
Computing Device Access in Moroni
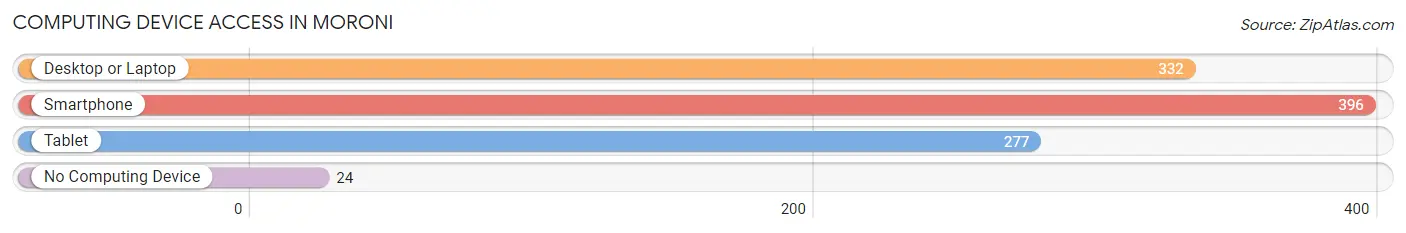
| Device Type | # Households | % Households |
| Desktop or Laptop | 332 | 75.8% |
| Smartphone | 396 | 90.4% |
| Tablet | 277 | 63.2% |
| No Computing Device | 24 | 5.5% |
| Total | 438 | 100.0% |
Internet Access in Moroni
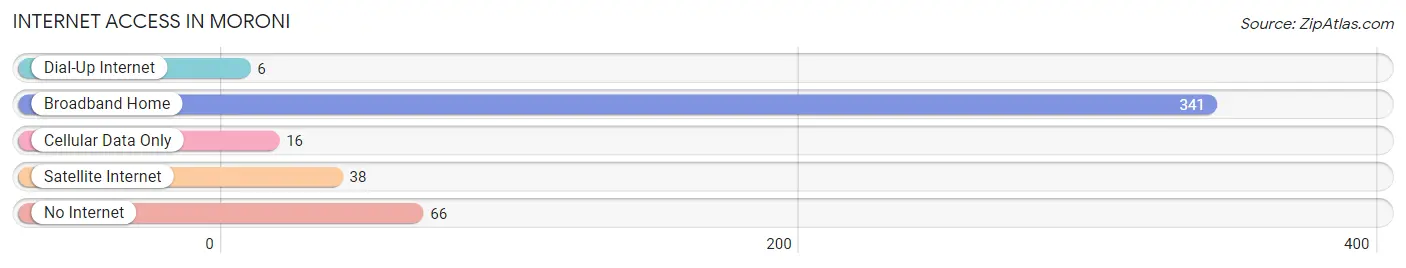
| Internet Type | # Households | % Households |
| Dial-Up Internet | 6 | 1.4% |
| Broadband Home | 341 | 77.8% |
| Cellular Data Only | 16 | 3.6% |
| Satellite Internet | 38 | 8.7% |
| No Internet | 66 | 15.1% |
| Total | 438 | 100.0% |
Moroni Summary
Moroni, Utah is a small city located in Sanpete County, Utah. It is the county seat and the largest city in the county. The city is located in the central part of the state, about 90 miles south of Salt Lake City. The population of Moroni was 1,817 at the 2010 census.
Geography
Moroni is located at the base of the Wasatch Mountains, in the Sanpete Valley. The city is situated at an elevation of 4,890 feet above sea level. The city is surrounded by mountains on all sides, with the Wasatch Range to the east and the San Pitch Mountains to the west. The city is located on the banks of the San Pitch River, which flows through the city.
Climate
Moroni has a semi-arid climate, with hot summers and cold winters. The average high temperature in the summer is around 90 degrees Fahrenheit, and the average low temperature in the winter is around 20 degrees Fahrenheit. The city receives an average of 16 inches of precipitation per year, with most of it falling in the spring and summer months.
Demographics
As of the 2010 census, there were 1,817 people, 645 households, and 463 families residing in the city. The population density was 1,092.3 people per square mile. The racial makeup of the city was 97.2% White, 0.2% African American, 0.3% Native American, 0.2% Asian, 0.1% Pacific Islander, 0.7% from other races, and 1.3% from two or more races. Hispanic or Latino of any race were 2.3% of the population.
Economy
Moroni is a small city with a limited economy. The city is home to several small businesses, including a grocery store, a hardware store, a restaurant, and a few other small businesses. The city is also home to a few manufacturing companies, including a furniture manufacturer and a plastics manufacturer. The city is also home to a few farms, which produce hay, corn, and other crops.
The city is also home to a few tourist attractions, including the Sanpete County Historical Museum, the Sanpete County Fairgrounds, and the Sanpete County Rodeo. The city is also home to a few churches, including the Church of Jesus Christ of Latter-day Saints, the Moroni United Methodist Church, and the Moroni Baptist Church.
Conclusion
Moroni, Utah is a small city located in Sanpete County, Utah. It is the county seat and the largest city in the county. The city is located in the central part of the state, about 90 miles south of Salt Lake City. The population of Moroni was 1,817 at the 2010 census. The city is surrounded by mountains on all sides, with the Wasatch Range to the east and the San Pitch Mountains to the west. The city has a semi-arid climate, with hot summers and cold winters. The city is home to several small businesses, manufacturing companies, farms, and tourist attractions. The city is also home to a few churches, including the Church of Jesus Christ of Latter-day Saints, the Moroni United Methodist Church, and the Moroni Baptist Church.
Common Questions
What is Per Capita Income in Moroni?
Per Capita income in Moroni is $28,829.
What is the Median Family Income in Moroni?
Median Family Income in Moroni is $88,056.
What is the Median Household income in Moroni?
Median Household Income in Moroni is $69,417.
What is Income or Wage Gap in Moroni?
Income or Wage Gap in Moroni is 42.4%.
Women in Moroni earn 57.6 cents for every dollar earned by a man.
What is Inequality or Gini Index in Moroni?
Inequality or Gini Index in Moroni is 0.34.
What is the Total Population of Moroni?
Total Population of Moroni is 1,259.
What is the Total Male Population of Moroni?
Total Male Population of Moroni is 614.
What is the Total Female Population of Moroni?
Total Female Population of Moroni is 645.
What is the Ratio of Males per 100 Females in Moroni?
There are 95.19 Males per 100 Females in Moroni.
What is the Ratio of Females per 100 Males in Moroni?
There are 105.05 Females per 100 Males in Moroni.
What is the Median Population Age in Moroni?
Median Population Age in Moroni is 34.6 Years.
What is the Average Family Size in Moroni
Average Family Size in Moroni is 3.6 People.
What is the Average Household Size in Moroni
Average Household Size in Moroni is 2.9 People.
How Large is the Labor Force in Moroni?
There are 642 People in the Labor Forcein in Moroni.
What is the Percentage of People in the Labor Force in Moroni?
66.3% of People are in the Labor Force in Moroni.
What is the Unemployment Rate in Moroni?
Unemployment Rate in Moroni is 2.5%.