Fairview, UT Map & Demographics
Fairview Map
Fairview Overview
$31,363
PER CAPITA INCOME
$61,944
AVG FAMILY INCOME
$57,391
AVG HOUSEHOLD INCOME
30.1%
WAGE / INCOME GAP [ % ]
69.9¢/ $1
WAGE / INCOME GAP [ $ ]
0.43
INEQUALITY / GINI INDEX
1,288
TOTAL POPULATION
638
MALE POPULATION
650
FEMALE POPULATION
98.15
MALES / 100 FEMALES
101.88
FEMALES / 100 MALES
44.2
MEDIAN AGE
3.0
AVG FAMILY SIZE
2.6
AVG HOUSEHOLD SIZE
665
LABOR FORCE [ PEOPLE ]
62.8%
PERCENT IN LABOR FORCE
4.1%
UNEMPLOYMENT RATE
Fairview Zip Codes
Fairview Area Codes
Income in Fairview
Income Overview in Fairview
Per Capita Income in Fairview is $31,363, while median incomes of families and households are $61,944 and $57,391 respectively.
| Characteristic | Number | Measure |
| Per Capita Income | 1,288 | $31,363 |
| Median Family Income | 372 | $61,944 |
| Mean Family Income | 372 | $89,510 |
| Median Household Income | 488 | $57,391 |
| Mean Household Income | 488 | $79,360 |
| Income Deficit | 372 | $0 |
| Wage / Income Gap (%) | 1,288 | 30.15% |
| Wage / Income Gap ($) | 1,288 | 69.85¢ per $1 |
| Gini / Inequality Index | 1,288 | 0.43 |
Earnings by Sex in Fairview
Average Earnings in Fairview are $39,219, $46,429 for men and $32,431 for women, a difference of 30.1%.
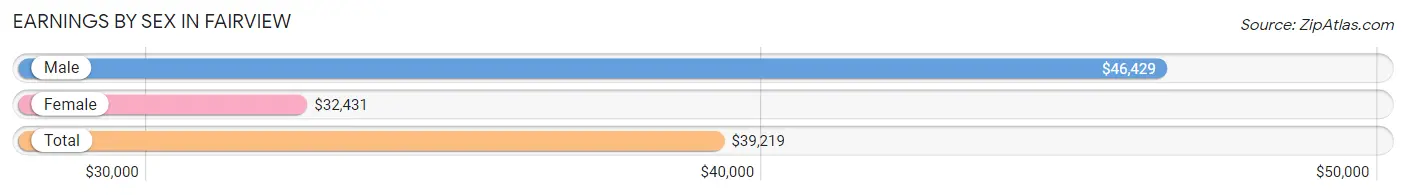
| Sex | Number | Average Earnings |
| Male | 384 (55.2%) | $46,429 |
| Female | 311 (44.8%) | $32,431 |
| Total | 695 (100.0%) | $39,219 |
Earnings by Sex by Income Bracket in Fairview
The most common earnings brackets in Fairview are $45,000 to $49,999 for men (57 | 14.8%) and $75,000 to $99,999 for women (83 | 26.7%).
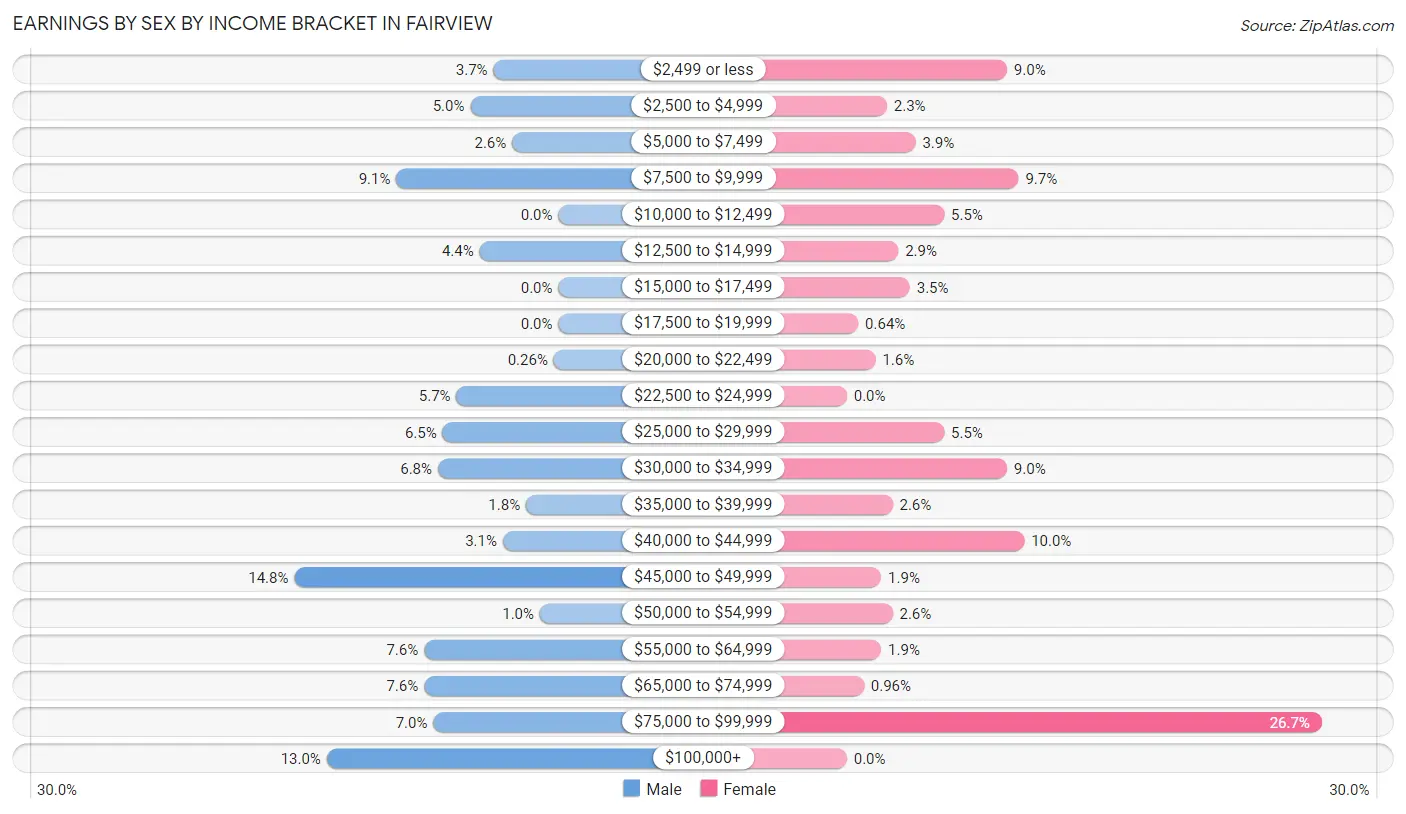
| Income | Male | Female |
| $2,499 or less | 14 (3.6%) | 28 (9.0%) |
| $2,500 to $4,999 | 19 (5.0%) | 7 (2.2%) |
| $5,000 to $7,499 | 10 (2.6%) | 12 (3.9%) |
| $7,500 to $9,999 | 35 (9.1%) | 30 (9.7%) |
| $10,000 to $12,499 | 0 (0.0%) | 17 (5.5%) |
| $12,500 to $14,999 | 17 (4.4%) | 9 (2.9%) |
| $15,000 to $17,499 | 0 (0.0%) | 11 (3.5%) |
| $17,500 to $19,999 | 0 (0.0%) | 2 (0.6%) |
| $20,000 to $22,499 | 1 (0.3%) | 5 (1.6%) |
| $22,500 to $24,999 | 22 (5.7%) | 0 (0.0%) |
| $25,000 to $29,999 | 25 (6.5%) | 17 (5.5%) |
| $30,000 to $34,999 | 26 (6.8%) | 28 (9.0%) |
| $35,000 to $39,999 | 7 (1.8%) | 8 (2.6%) |
| $40,000 to $44,999 | 12 (3.1%) | 31 (10.0%) |
| $45,000 to $49,999 | 57 (14.8%) | 6 (1.9%) |
| $50,000 to $54,999 | 4 (1.0%) | 8 (2.6%) |
| $55,000 to $64,999 | 29 (7.5%) | 6 (1.9%) |
| $65,000 to $74,999 | 29 (7.5%) | 3 (1.0%) |
| $75,000 to $99,999 | 27 (7.0%) | 83 (26.7%) |
| $100,000+ | 50 (13.0%) | 0 (0.0%) |
| Total | 384 (100.0%) | 311 (100.0%) |
Earnings by Sex by Educational Attainment in Fairview
Average earnings in Fairview are $48,925 for men and $39,375 for women, a difference of 19.5%. Men with an educational attainment of graduate degree enjoy the highest average annual earnings of $69,091, while those with college or associate's degree education earn the least with $48,300. Women with an educational attainment of college or associate's degree earn the most with the average annual earnings of $90,272, while those with graduate degree education have the smallest earnings of $17,125.
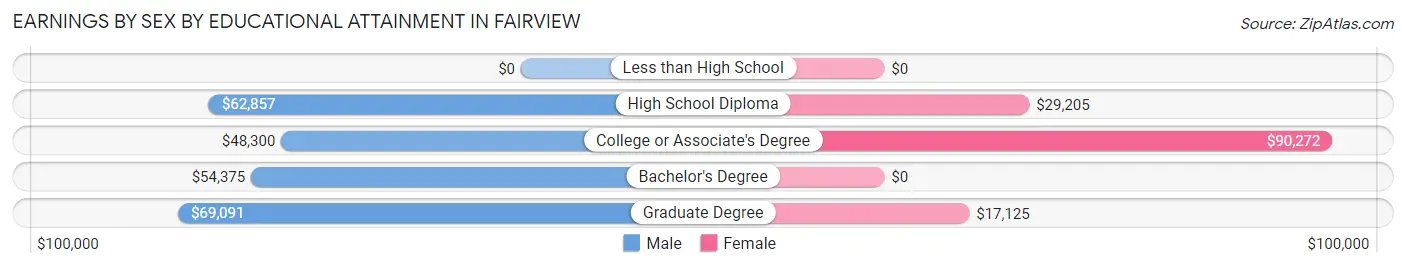
| Educational Attainment | Male Income | Female Income |
| Less than High School | - | - |
| High School Diploma | $62,857 | $29,205 |
| College or Associate's Degree | $48,300 | $90,272 |
| Bachelor's Degree | $54,375 | $0 |
| Graduate Degree | $69,091 | $17,125 |
| Total | $48,925 | $39,375 |
Family Income in Fairview
Family Income Brackets in Fairview
According to the Fairview family income data, there are 83 families falling into the $50,000 to $74,999 income range, which is the most common income bracket and makes up 22.3% of all families. Conversely, the less than $10,000 income bracket is the least frequent group with only 3 families (0.8%) belonging to this category.
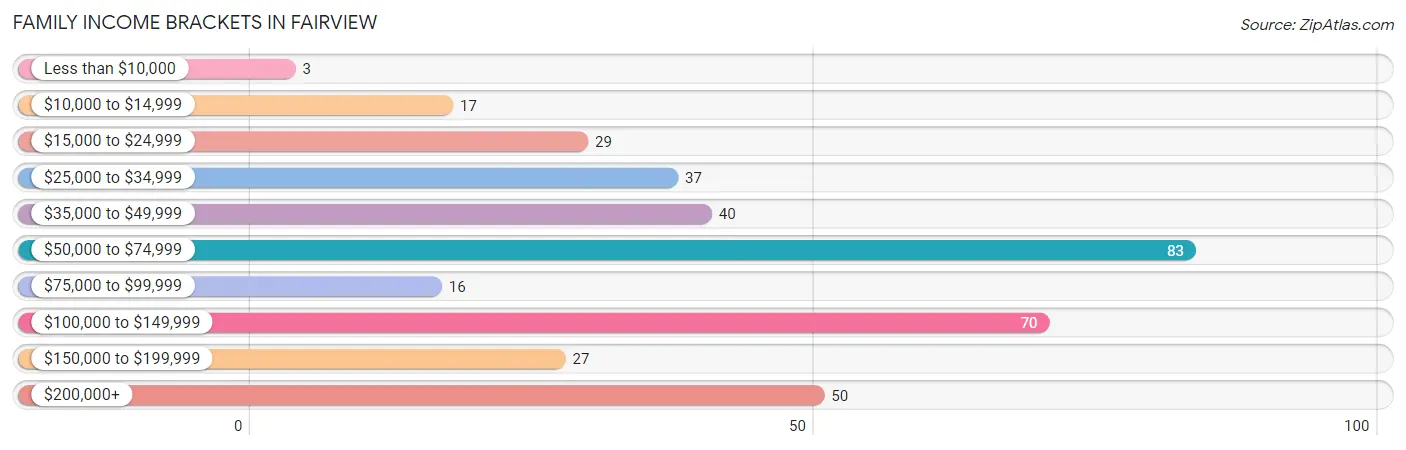
| Income Bracket | # Families | % Families |
| Less than $10,000 | 3 | 0.8% |
| $10,000 to $14,999 | 17 | 4.6% |
| $15,000 to $24,999 | 29 | 7.8% |
| $25,000 to $34,999 | 37 | 9.9% |
| $35,000 to $49,999 | 40 | 10.8% |
| $50,000 to $74,999 | 83 | 22.3% |
| $75,000 to $99,999 | 16 | 4.3% |
| $100,000 to $149,999 | 70 | 18.8% |
| $150,000 to $199,999 | 27 | 7.3% |
| $200,000+ | 50 | 13.4% |
Family Income by Famaliy Size in Fairview
6-person families (56 | 15.0%) account for the highest median family income in Fairview with $102,885 per family, while 3-person families (52 | 14.0%) have the highest median income of $32,083 per family member.
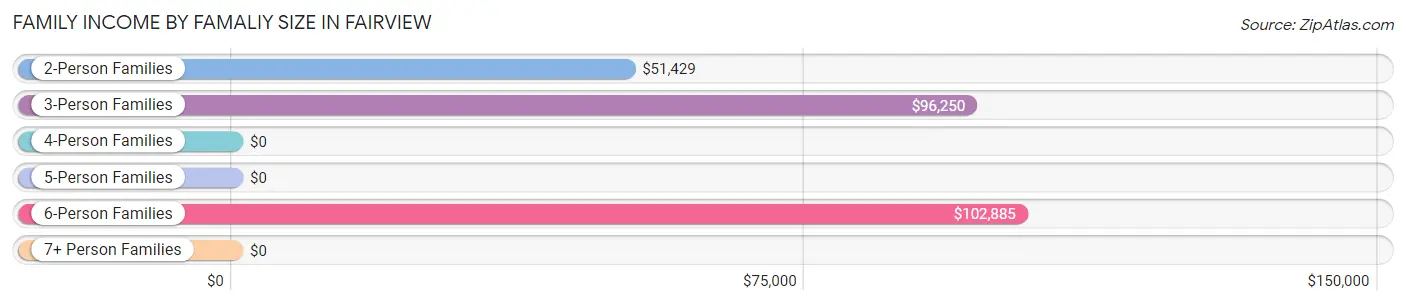
| Income Bracket | # Families | Median Income |
| 2-Person Families | 168 (45.2%) | $51,429 |
| 3-Person Families | 52 (14.0%) | $96,250 |
| 4-Person Families | 91 (24.5%) | $0 |
| 5-Person Families | 4 (1.1%) | $0 |
| 6-Person Families | 56 (15.0%) | $102,885 |
| 7+ Person Families | 1 (0.3%) | $0 |
| Total | 372 (100.0%) | $61,944 |
Family Income by Number of Earners in Fairview
The median family income in Fairview is $61,944, with families comprising 2 earners (114) having the highest median family income of $166,250, while families with no earners (46) have the lowest median family income of $37,361, accounting for 30.6% and 12.4% of families, respectively.
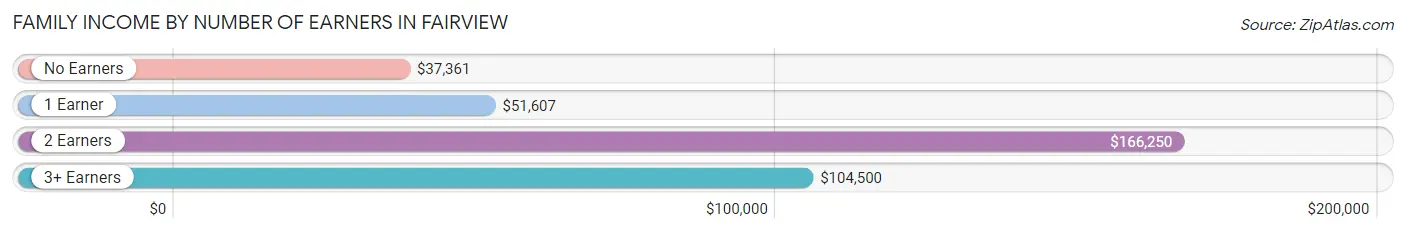
| Number of Earners | # Families | Median Income |
| No Earners | 46 (12.4%) | $37,361 |
| 1 Earner | 140 (37.6%) | $51,607 |
| 2 Earners | 114 (30.6%) | $166,250 |
| 3+ Earners | 72 (19.4%) | $104,500 |
| Total | 372 (100.0%) | $61,944 |
Household Income in Fairview
Household Income Brackets in Fairview
With 108 households falling in the category, the $50,000 to $74,999 income range is the most frequent in Fairview, accounting for 22.1% of all households. In contrast, only 17 households (3.5%) fall into the $10,000 to $14,999 income bracket, making it the least populous group.
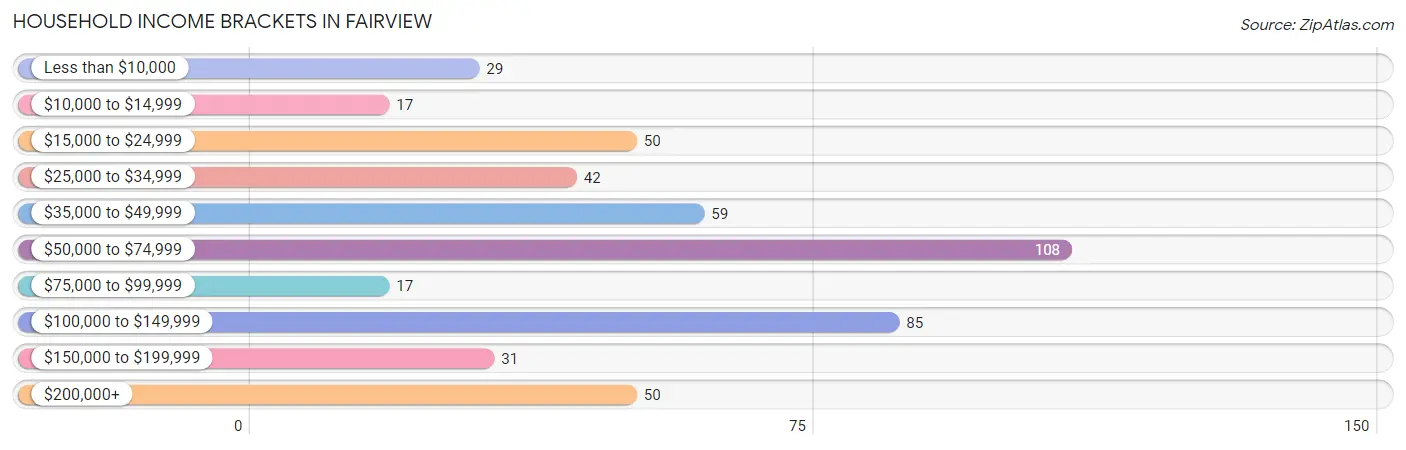
| Income Bracket | # Households | % Households |
| Less than $10,000 | 29 | 5.9% |
| $10,000 to $14,999 | 17 | 3.5% |
| $15,000 to $24,999 | 50 | 10.2% |
| $25,000 to $34,999 | 42 | 8.6% |
| $35,000 to $49,999 | 59 | 12.1% |
| $50,000 to $74,999 | 108 | 22.1% |
| $75,000 to $99,999 | 17 | 3.5% |
| $100,000 to $149,999 | 85 | 17.4% |
| $150,000 to $199,999 | 31 | 6.4% |
| $200,000+ | 50 | 10.2% |
Household Income by Householder Age in Fairview
The median household income in Fairview is $57,391, with the highest median household income of $103,942 found in the 25 to 44 years age bracket for the primary householder. A total of 131 households (26.8%) fall into this category. Meanwhile, the 65+ years age bracket for the primary householder has the lowest median household income of $49,219, with 169 households (34.6%) in this group.
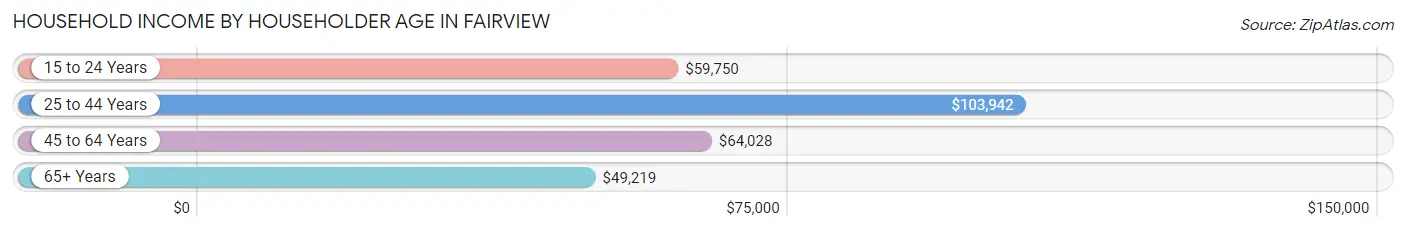
| Income Bracket | # Households | Median Income |
| 15 to 24 Years | 23 (4.7%) | $59,750 |
| 25 to 44 Years | 131 (26.8%) | $103,942 |
| 45 to 64 Years | 165 (33.8%) | $64,028 |
| 65+ Years | 169 (34.6%) | $49,219 |
| Total | 488 (100.0%) | $57,391 |
Poverty in Fairview
Income Below Poverty by Sex and Age in Fairview
With 7.7% poverty level for males and 22.3% for females among the residents of Fairview, 16 and 17 year old males and 15 year old females are the most vulnerable to poverty, with 7 males (77.8%) and 11 females (100.0%) in their respective age groups living below the poverty level.
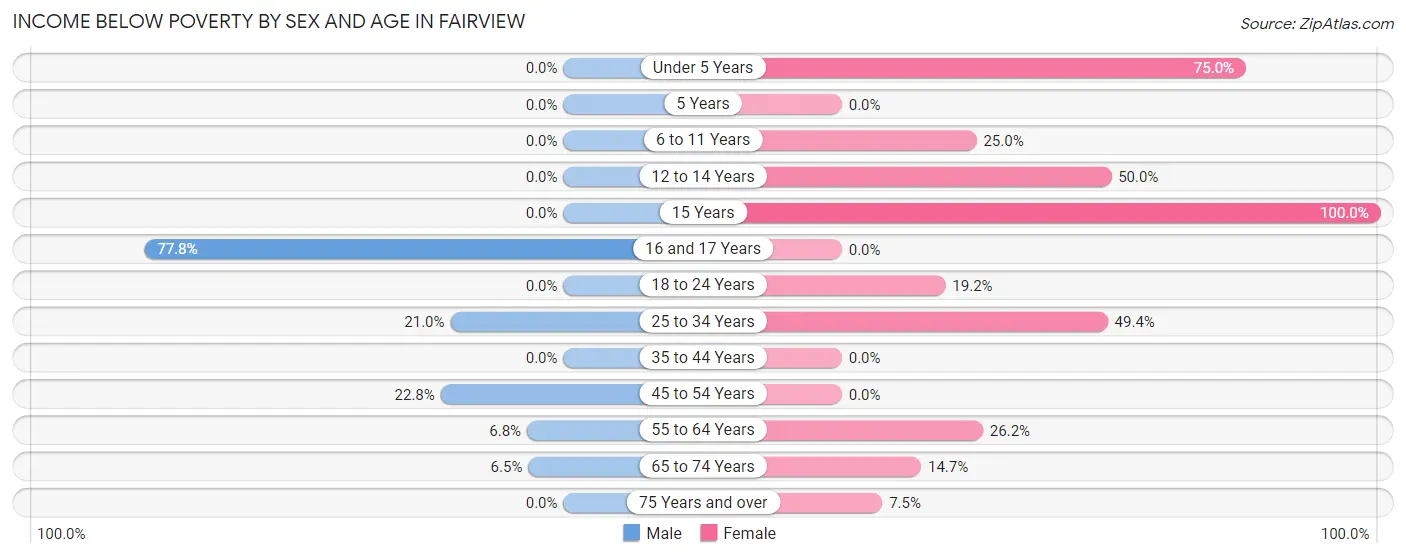
| Age Bracket | Male | Female |
| Under 5 Years | 0 (0.0%) | 24 (75.0%) |
| 5 Years | 0 (0.0%) | 0 (0.0%) |
| 6 to 11 Years | 0 (0.0%) | 8 (25.0%) |
| 12 to 14 Years | 0 (0.0%) | 8 (50.0%) |
| 15 Years | 0 (0.0%) | 11 (100.0%) |
| 16 and 17 Years | 7 (77.8%) | 0 (0.0%) |
| 18 to 24 Years | 0 (0.0%) | 10 (19.2%) |
| 25 to 34 Years | 13 (21.0%) | 38 (49.3%) |
| 35 to 44 Years | 0 (0.0%) | 0 (0.0%) |
| 45 to 54 Years | 18 (22.8%) | 0 (0.0%) |
| 55 to 64 Years | 5 (6.8%) | 33 (26.2%) |
| 65 to 74 Years | 6 (6.5%) | 10 (14.7%) |
| 75 Years and over | 0 (0.0%) | 3 (7.5%) |
| Total | 49 (7.7%) | 145 (22.3%) |
Income Above Poverty by Sex and Age in Fairview
According to the poverty statistics in Fairview, males aged under 5 years and females aged 5 years are the age groups that are most secure financially, with 100.0% of males and 100.0% of females in these age groups living above the poverty line.
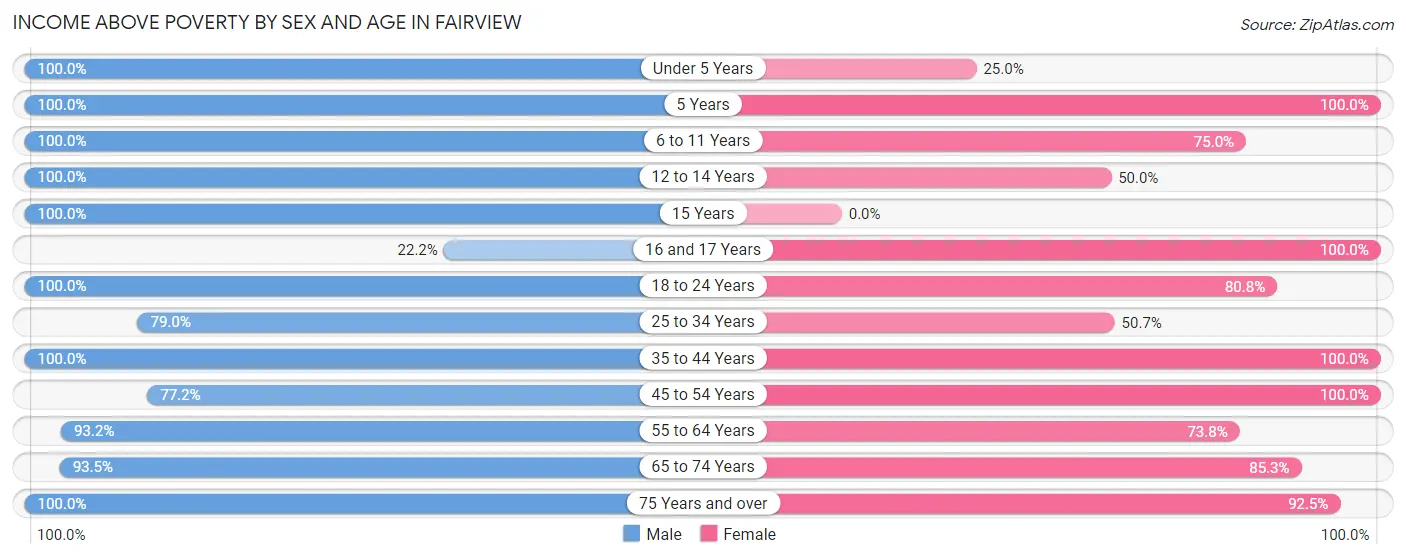
| Age Bracket | Male | Female |
| Under 5 Years | 31 (100.0%) | 8 (25.0%) |
| 5 Years | 8 (100.0%) | 3 (100.0%) |
| 6 to 11 Years | 44 (100.0%) | 24 (75.0%) |
| 12 to 14 Years | 42 (100.0%) | 8 (50.0%) |
| 15 Years | 10 (100.0%) | 0 (0.0%) |
| 16 and 17 Years | 2 (22.2%) | 1 (100.0%) |
| 18 to 24 Years | 63 (100.0%) | 42 (80.8%) |
| 25 to 34 Years | 49 (79.0%) | 39 (50.6%) |
| 35 to 44 Years | 77 (100.0%) | 117 (100.0%) |
| 45 to 54 Years | 61 (77.2%) | 75 (100.0%) |
| 55 to 64 Years | 69 (93.2%) | 93 (73.8%) |
| 65 to 74 Years | 86 (93.5%) | 58 (85.3%) |
| 75 Years and over | 47 (100.0%) | 37 (92.5%) |
| Total | 589 (92.3%) | 505 (77.7%) |
Income Below Poverty Among Married-Couple Families in Fairview
The poverty statistics for married-couple families in Fairview show that 8.8% or 27 of the total 306 families live below the poverty line. Families with 1 or 2 children have the highest poverty rate of 15.6%, comprising of 17 families. On the other hand, families with 3 or 4 children have the lowest poverty rate of 0.0%, which includes 0 families.
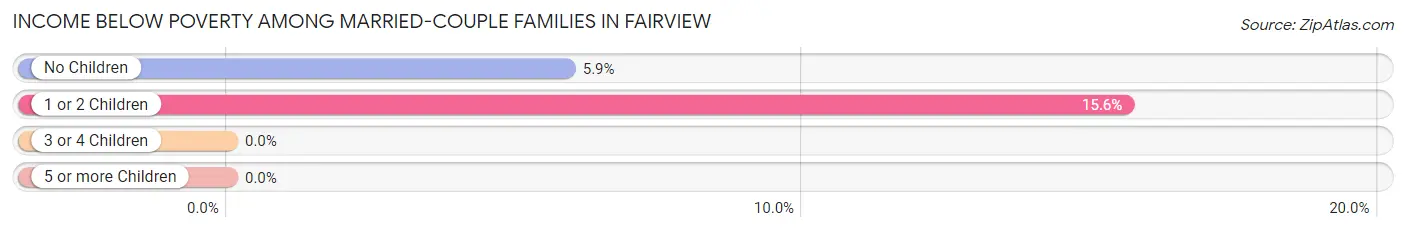
| Children | Above Poverty | Below Poverty |
| No Children | 160 (94.1%) | 10 (5.9%) |
| 1 or 2 Children | 92 (84.4%) | 17 (15.6%) |
| 3 or 4 Children | 27 (100.0%) | 0 (0.0%) |
| 5 or more Children | 0 (0.0%) | 0 (0.0%) |
| Total | 279 (91.2%) | 27 (8.8%) |
Income Below Poverty Among Single-Parent Households in Fairview
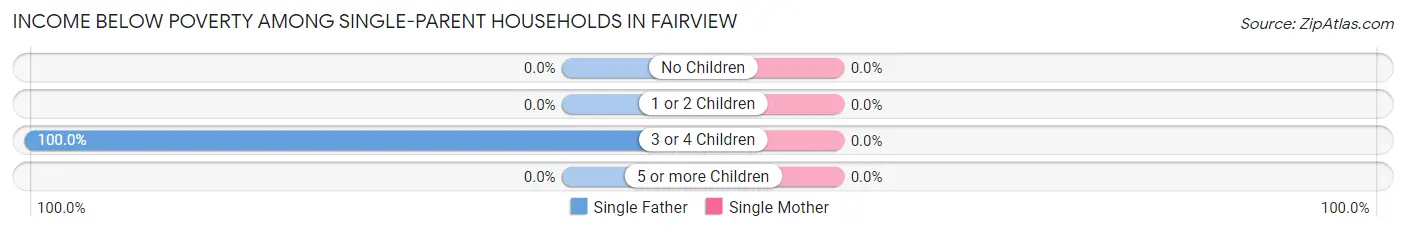
| Children | Single Father | Single Mother |
| No Children | 0 (0.0%) | 0 (0.0%) |
| 1 or 2 Children | 0 (0.0%) | 0 (0.0%) |
| 3 or 4 Children | 18 (100.0%) | 0 (0.0%) |
| 5 or more Children | 0 (0.0%) | 0 (0.0%) |
| Total | 18 (69.2%) | 0 (0.0%) |
Income Below Poverty Among Married-Couple vs Single-Parent Households in Fairview
The poverty data for Fairview shows that 27 of the married-couple family households (8.8%) and 18 of the single-parent households (27.3%) are living below the poverty level. Within the married-couple family households, those with 1 or 2 children have the highest poverty rate, with 17 households (15.6%) falling below the poverty line. Among the single-parent households, those with 3 or 4 children have the highest poverty rate, with 18 household (66.7%) living below poverty.
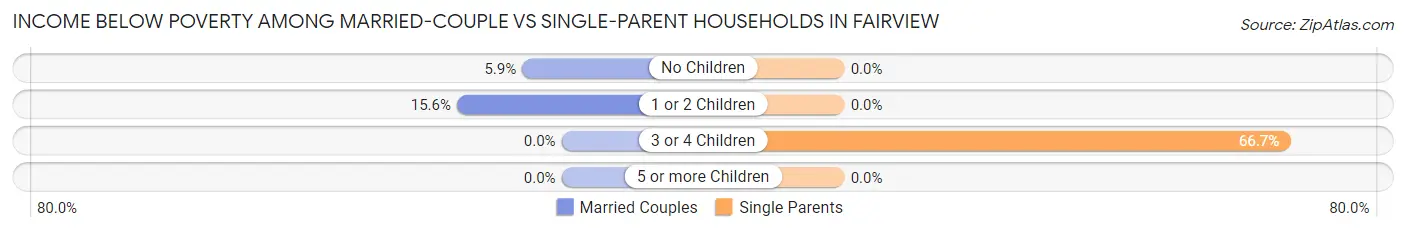
| Children | Married-Couple Families | Single-Parent Households |
| No Children | 10 (5.9%) | 0 (0.0%) |
| 1 or 2 Children | 17 (15.6%) | 0 (0.0%) |
| 3 or 4 Children | 0 (0.0%) | 18 (66.7%) |
| 5 or more Children | 0 (0.0%) | 0 (0.0%) |
| Total | 27 (8.8%) | 18 (27.3%) |
Race in Fairview
The most populous races in Fairview are White / Caucasian (1,239 | 96.2%), Hispanic or Latino (42 | 3.3%), and Two or more Races (27 | 2.1%).
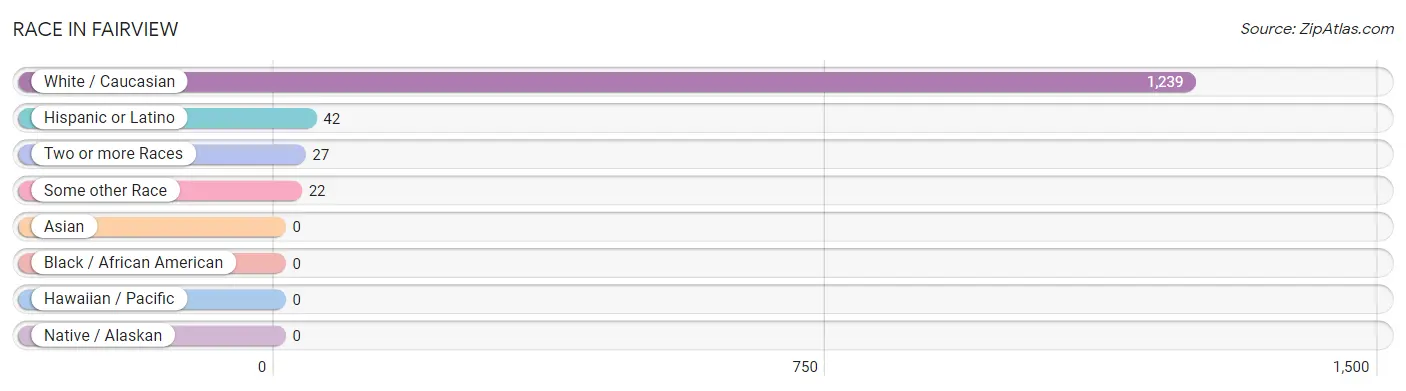
| Race | # Population | % Population |
| Asian | 0 | 0.0% |
| Black / African American | 0 | 0.0% |
| Hawaiian / Pacific | 0 | 0.0% |
| Hispanic or Latino | 42 | 3.3% |
| Native / Alaskan | 0 | 0.0% |
| White / Caucasian | 1,239 | 96.2% |
| Two or more Races | 27 | 2.1% |
| Some other Race | 22 | 1.7% |
| Total | 1,288 | 100.0% |
Ancestry in Fairview
The most populous ancestries reported in Fairview are English (590 | 45.8%), Danish (165 | 12.8%), Scottish (157 | 12.2%), German (117 | 9.1%), and Swedish (73 | 5.7%), together accounting for 85.6% of all Fairview residents.
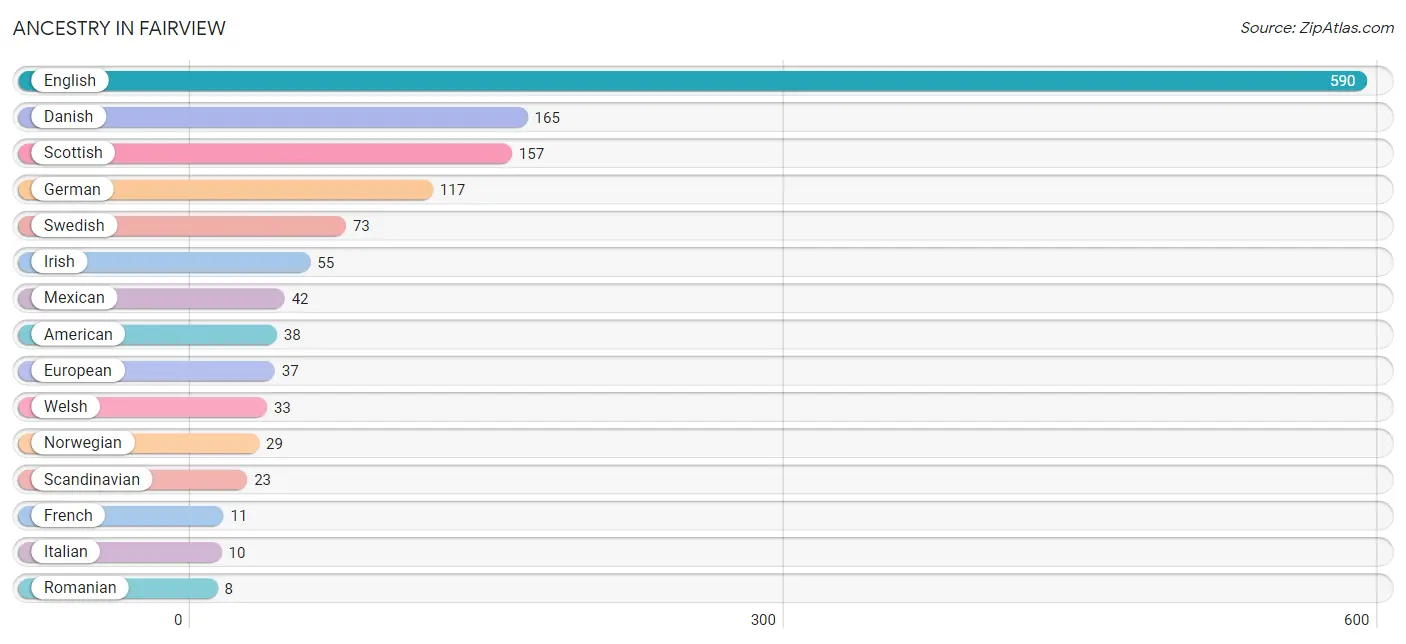
| Ancestry | # Population | % Population |
| American | 38 | 2.9% |
| Armenian | 4 | 0.3% |
| Belgian | 6 | 0.5% |
| British | 5 | 0.4% |
| Cherokee | 1 | 0.1% |
| Czech | 2 | 0.2% |
| Danish | 165 | 12.8% |
| Dutch | 5 | 0.4% |
| Eastern European | 7 | 0.5% |
| English | 590 | 45.8% |
| European | 37 | 2.9% |
| French | 11 | 0.9% |
| German | 117 | 9.1% |
| Greek | 2 | 0.2% |
| Irish | 55 | 4.3% |
| Italian | 10 | 0.8% |
| Korean | 3 | 0.2% |
| Mexican | 42 | 3.3% |
| Norwegian | 29 | 2.2% |
| Polish | 4 | 0.3% |
| Romanian | 8 | 0.6% |
| Russian | 4 | 0.3% |
| Samoan | 4 | 0.3% |
| Scandinavian | 23 | 1.8% |
| Scottish | 157 | 12.2% |
| Swedish | 73 | 5.7% |
| Swiss | 8 | 0.6% |
| Welsh | 33 | 2.6% | View All 28 Rows |
Immigrants in Fairview
The most numerous immigrant groups reported in Fairview came from Europe (37 | 2.9%), Northern Europe (30 | 2.3%), England (27 | 2.1%), Central America (10 | 0.8%), and Latin America (10 | 0.8%), together accounting for 8.9% of all Fairview residents.
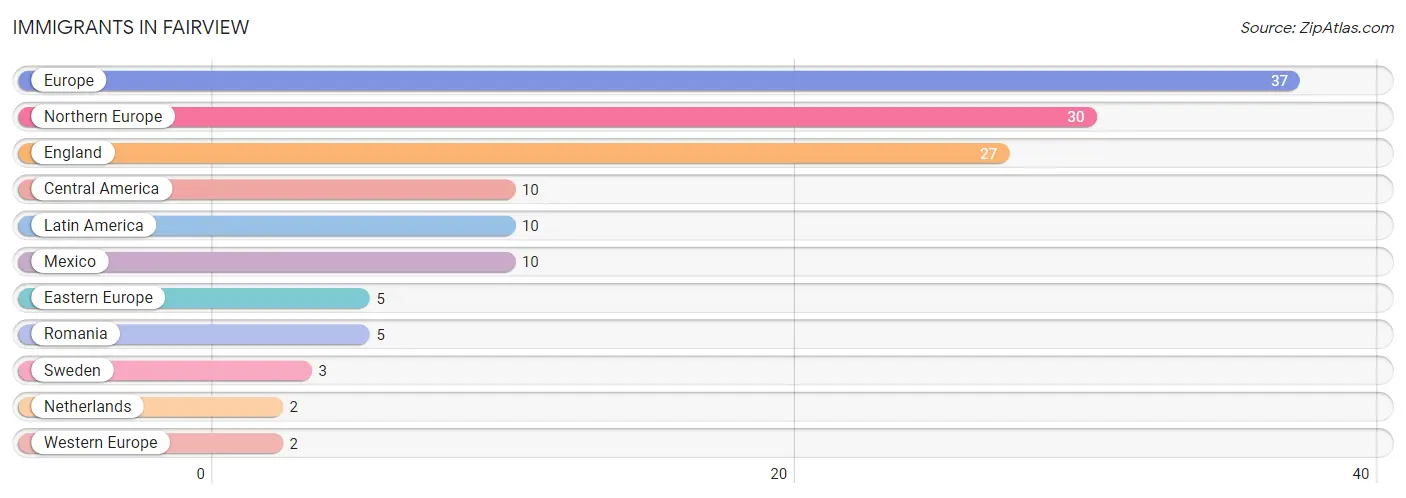
| Immigration Origin | # Population | % Population |
| Central America | 10 | 0.8% |
| Eastern Europe | 5 | 0.4% |
| England | 27 | 2.1% |
| Europe | 37 | 2.9% |
| Latin America | 10 | 0.8% |
| Mexico | 10 | 0.8% |
| Netherlands | 2 | 0.2% |
| Northern Europe | 30 | 2.3% |
| Romania | 5 | 0.4% |
| Sweden | 3 | 0.2% |
| Western Europe | 2 | 0.2% | View All 11 Rows |
Sex and Age in Fairview
Sex and Age in Fairview
The most populous age groups in Fairview are 65 to 69 Years (65 | 10.2%) for men and 40 to 44 Years (90 | 13.9%) for women.
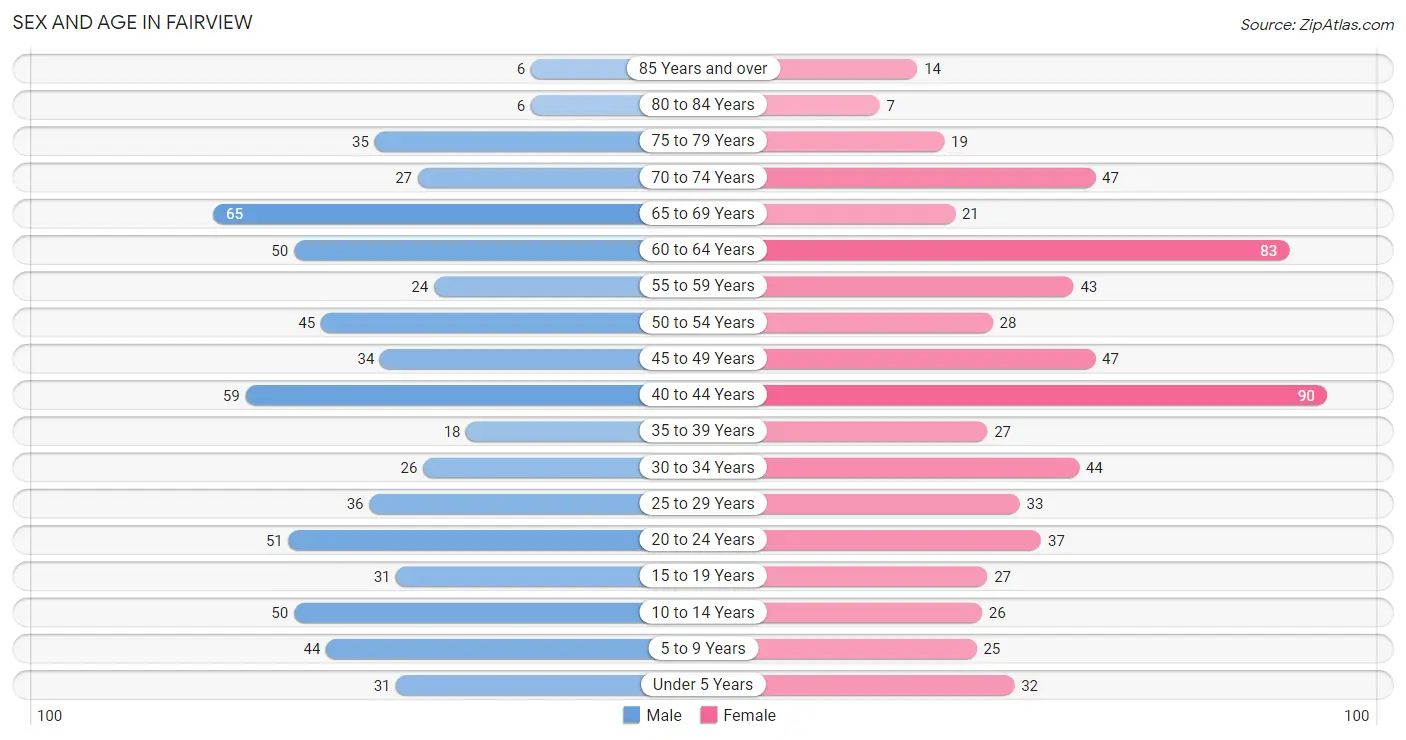
| Age Bracket | Male | Female |
| Under 5 Years | 31 (4.9%) | 32 (4.9%) |
| 5 to 9 Years | 44 (6.9%) | 25 (3.8%) |
| 10 to 14 Years | 50 (7.8%) | 26 (4.0%) |
| 15 to 19 Years | 31 (4.9%) | 27 (4.2%) |
| 20 to 24 Years | 51 (8.0%) | 37 (5.7%) |
| 25 to 29 Years | 36 (5.6%) | 33 (5.1%) |
| 30 to 34 Years | 26 (4.1%) | 44 (6.8%) |
| 35 to 39 Years | 18 (2.8%) | 27 (4.2%) |
| 40 to 44 Years | 59 (9.2%) | 90 (13.9%) |
| 45 to 49 Years | 34 (5.3%) | 47 (7.2%) |
| 50 to 54 Years | 45 (7.0%) | 28 (4.3%) |
| 55 to 59 Years | 24 (3.8%) | 43 (6.6%) |
| 60 to 64 Years | 50 (7.8%) | 83 (12.8%) |
| 65 to 69 Years | 65 (10.2%) | 21 (3.2%) |
| 70 to 74 Years | 27 (4.2%) | 47 (7.2%) |
| 75 to 79 Years | 35 (5.5%) | 19 (2.9%) |
| 80 to 84 Years | 6 (0.9%) | 7 (1.1%) |
| 85 Years and over | 6 (0.9%) | 14 (2.1%) |
| Total | 638 (100.0%) | 650 (100.0%) |
Families and Households in Fairview
Median Family Size in Fairview
The median family size in Fairview is 3.04 persons per family, with single male/father families (26 | 7.0%) accounting for the largest median family size of 3.15 persons per family. On the other hand, single female/mother families (40 | 10.7%) represent the smallest median family size with 2.88 persons per family.
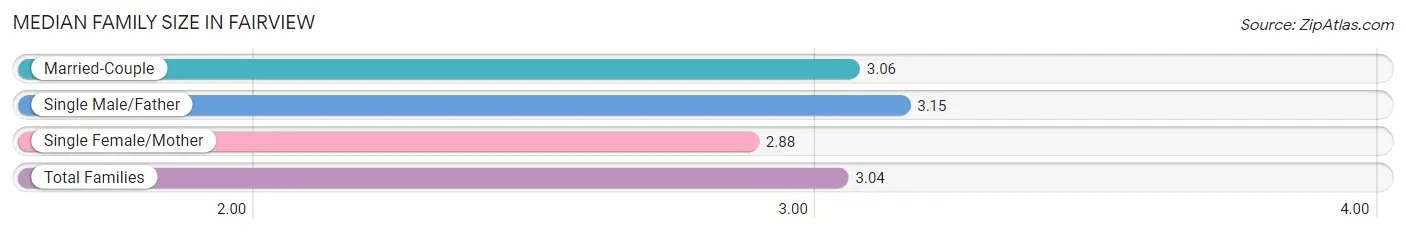
| Family Type | # Families | Family Size |
| Married-Couple | 306 (82.3%) | 3.06 |
| Single Male/Father | 26 (7.0%) | 3.15 |
| Single Female/Mother | 40 (10.7%) | 2.88 |
| Total Families | 372 (100.0%) | 3.04 |
Median Household Size in Fairview
The median household size in Fairview is 2.64 persons per household, with single male/father households (26 | 5.3%) accounting for the largest median household size of 3.96 persons per household. non-family households (116 | 23.8%) represent the smallest median household size with 1.15 persons per household.
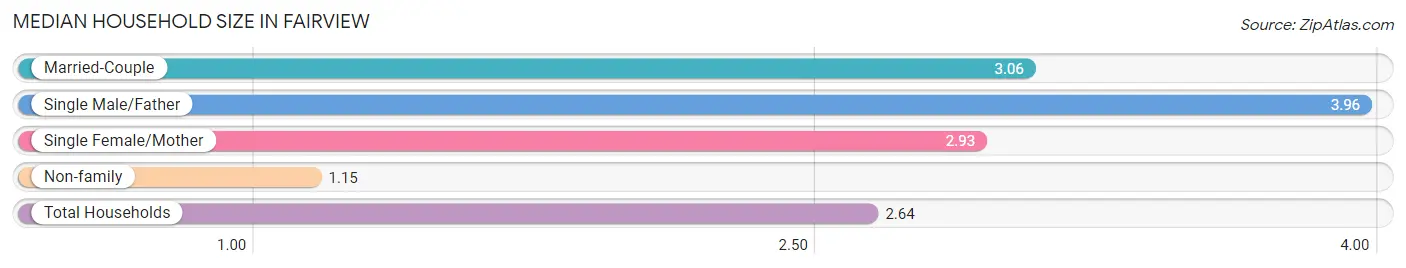
| Household Type | # Households | Household Size |
| Married-Couple | 306 (62.7%) | 3.06 |
| Single Male/Father | 26 (5.3%) | 3.96 |
| Single Female/Mother | 40 (8.2%) | 2.93 |
| Non-family | 116 (23.8%) | 1.15 |
| Total Households | 488 (100.0%) | 2.64 |
Household Size by Marriage Status in Fairview
Out of a total of 488 households in Fairview, 372 (76.2%) are family households, while 116 (23.8%) are nonfamily households. The most numerous type of family households are 2-person households, comprising 168, and the most common type of nonfamily households are 1-person households, comprising 102.
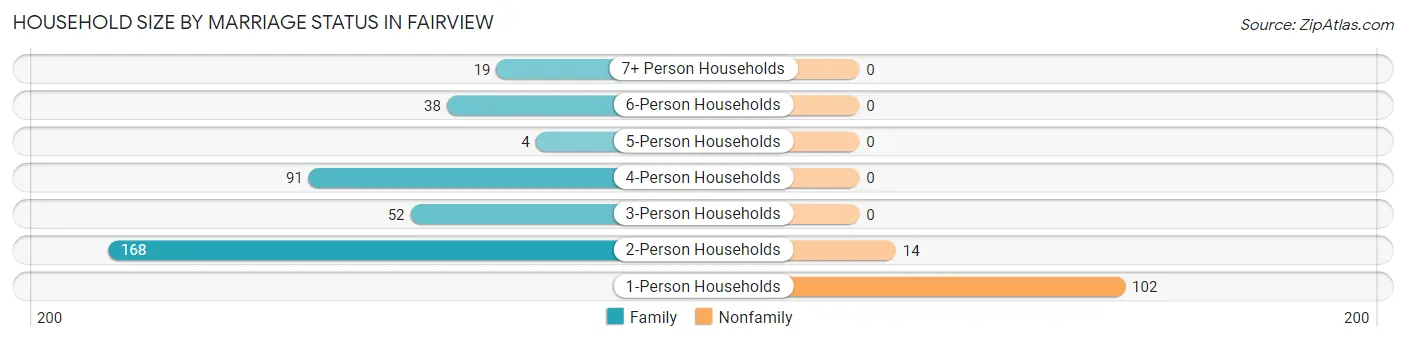
| Household Size | Family Households | Nonfamily Households |
| 1-Person Households | - | 102 (20.9%) |
| 2-Person Households | 168 (34.4%) | 14 (2.9%) |
| 3-Person Households | 52 (10.7%) | 0 (0.0%) |
| 4-Person Households | 91 (18.6%) | 0 (0.0%) |
| 5-Person Households | 4 (0.8%) | 0 (0.0%) |
| 6-Person Households | 38 (7.8%) | 0 (0.0%) |
| 7+ Person Households | 19 (3.9%) | 0 (0.0%) |
| Total | 372 (76.2%) | 116 (23.8%) |
Female Fertility in Fairview
Fertility by Age in Fairview
Average fertility rate in Fairview is 55.0 births per 1,000 women. Women in the age bracket of 20 to 34 years have the highest fertility rate with 149.0 births per 1,000 women. Women in the age bracket of 20 to 34 years acount for 100.0% of all women with births.
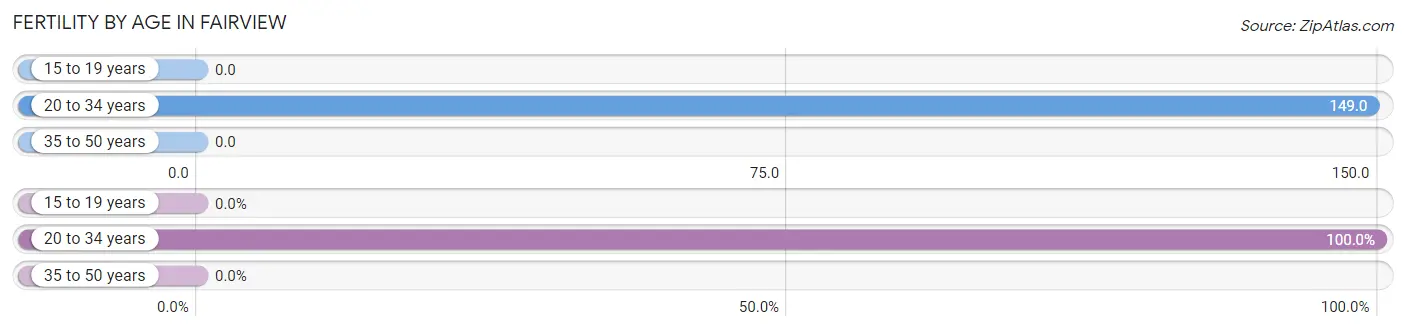
| Age Bracket | Women with Births | Births / 1,000 Women |
| 15 to 19 years | 0 (0.0%) | 0.0 |
| 20 to 34 years | 17 (100.0%) | 149.0 |
| 35 to 50 years | 0 (0.0%) | 0.0 |
| Total | 17 (100.0%) | 55.0 |
Fertility by Age by Marriage Status in Fairview
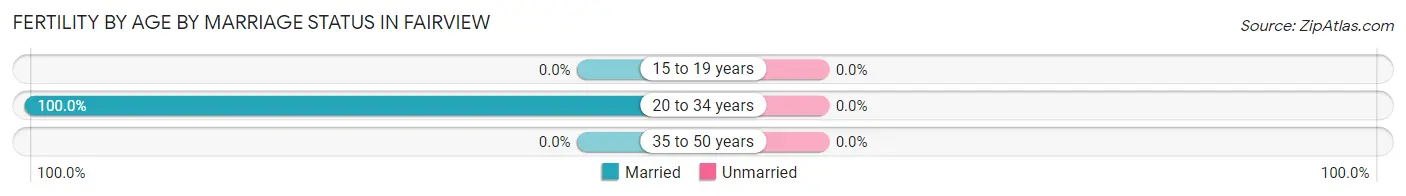
| Age Bracket | Married | Unmarried |
| 15 to 19 years | 0 (0.0%) | 0 (0.0%) |
| 20 to 34 years | 17 (100.0%) | 0 (0.0%) |
| 35 to 50 years | 0 (0.0%) | 0 (0.0%) |
| Total | 17 (100.0%) | 0 (0.0%) |
Fertility by Education in Fairview
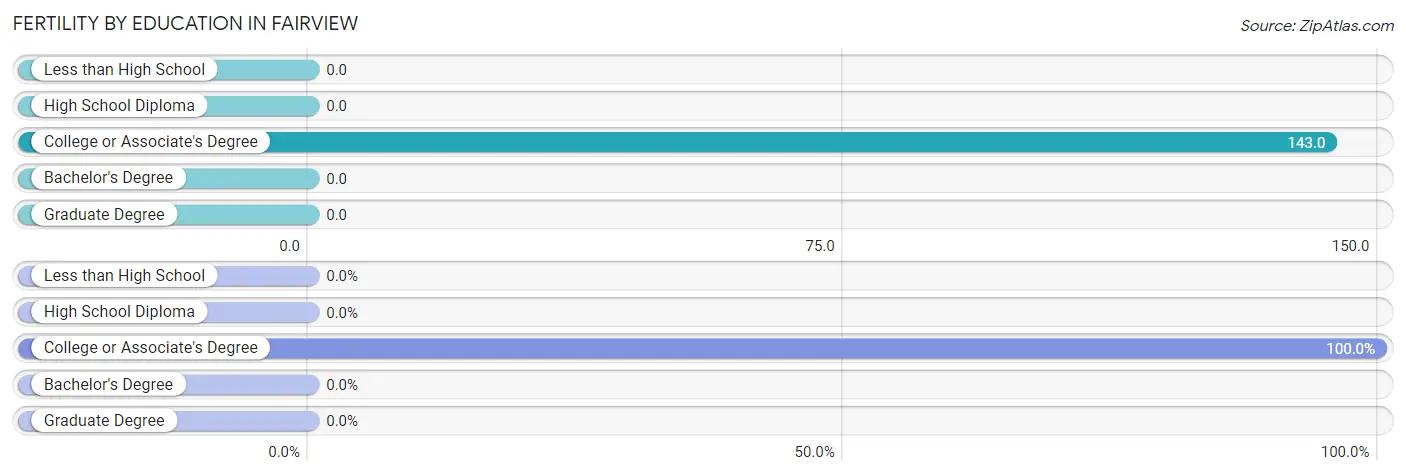
| Educational Attainment | Women with Births | Births / 1,000 Women |
| Less than High School | 0 (0.0%) | 0.0 |
| High School Diploma | 0 (0.0%) | 0.0 |
| College or Associate's Degree | 17 (100.0%) | 143.0 |
| Bachelor's Degree | 0 (0.0%) | 0.0 |
| Graduate Degree | 0 (0.0%) | 0.0 |
| Total | 17 (100.0%) | 55.0 |
Fertility by Education by Marriage Status in Fairview
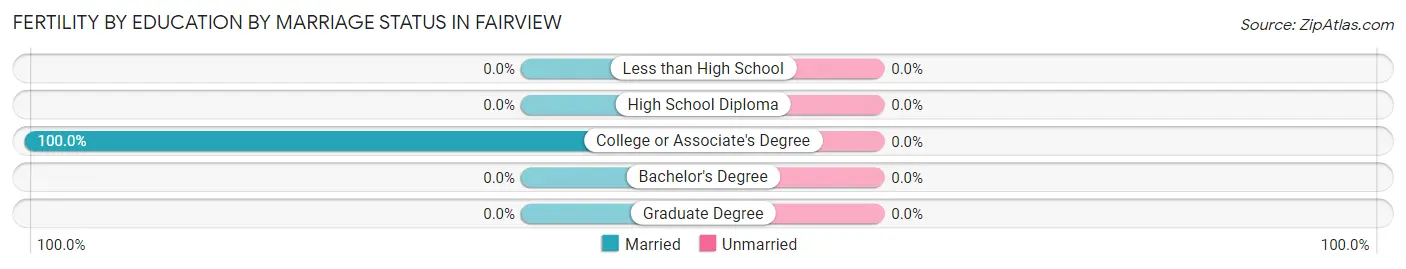
| Educational Attainment | Married | Unmarried |
| Less than High School | 0 (0.0%) | 0 (0.0%) |
| High School Diploma | 0 (0.0%) | 0 (0.0%) |
| College or Associate's Degree | 17 (100.0%) | 0 (0.0%) |
| Bachelor's Degree | 0 (0.0%) | 0 (0.0%) |
| Graduate Degree | 0 (0.0%) | 0 (0.0%) |
| Total | 17 (100.0%) | 0 (0.0%) |
Employment Characteristics in Fairview
Employment by Class of Employer in Fairview
Among the 634 employed individuals in Fairview, private company employees (426 | 67.2%), self-employed (not incorporated) (63 | 9.9%), and local government employees (42 | 6.6%) make up the most common classes of employment.
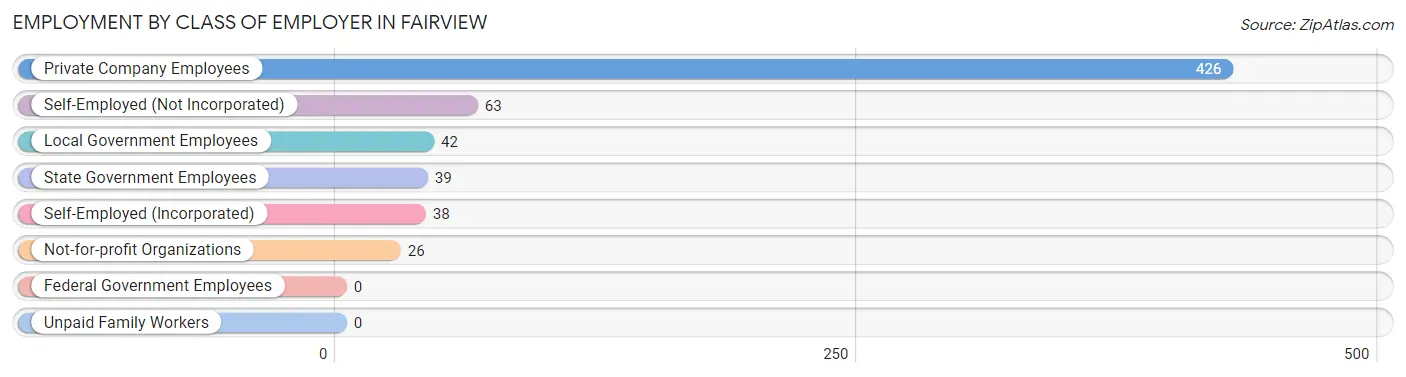
| Employer Class | # Employees | % Employees |
| Private Company Employees | 426 | 67.2% |
| Self-Employed (Incorporated) | 38 | 6.0% |
| Self-Employed (Not Incorporated) | 63 | 9.9% |
| Not-for-profit Organizations | 26 | 4.1% |
| Local Government Employees | 42 | 6.6% |
| State Government Employees | 39 | 6.1% |
| Federal Government Employees | 0 | 0.0% |
| Unpaid Family Workers | 0 | 0.0% |
| Total | 634 | 100.0% |
Employment Status by Age in Fairview
According to the labor force statistics for Fairview, out of the total population over 16 years of age (1,059), 62.8% or 665 individuals are in the labor force, with 4.1% or 27 of them unemployed. The age group with the highest labor force participation rate is 16 to 19 years, with 97.3% or 36 individuals in the labor force. Within the labor force, the 30 to 34 years age range has the highest percentage of unemployed individuals, with 20.6% or 7 of them being unemployed.
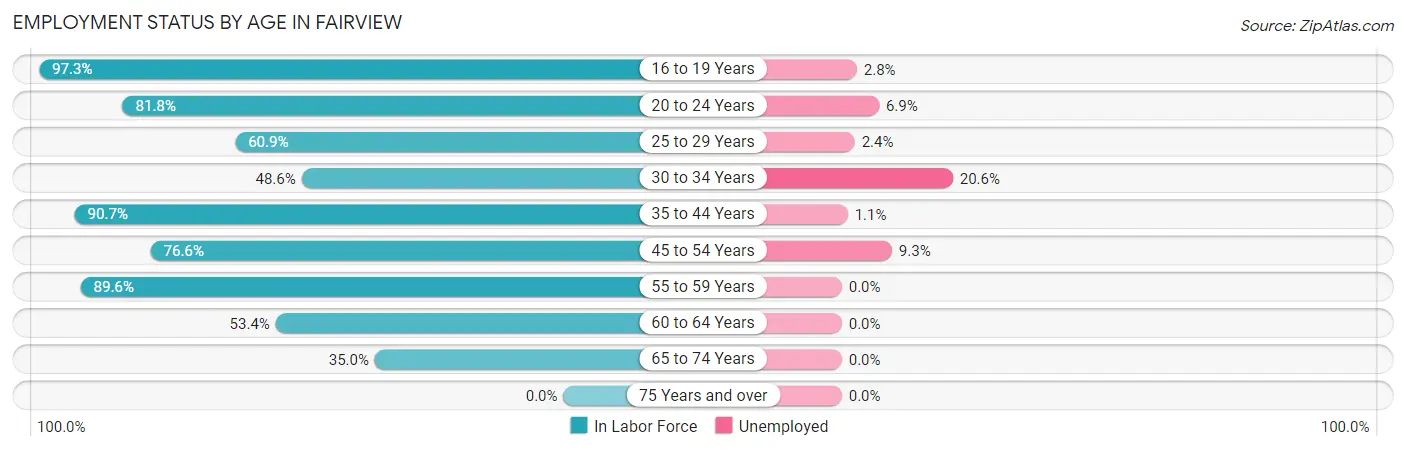
| Age Bracket | In Labor Force | Unemployed |
| 16 to 19 Years | 36 (97.3%) | 1 (2.8%) |
| 20 to 24 Years | 72 (81.8%) | 5 (6.9%) |
| 25 to 29 Years | 42 (60.9%) | 1 (2.4%) |
| 30 to 34 Years | 34 (48.6%) | 7 (20.6%) |
| 35 to 44 Years | 176 (90.7%) | 2 (1.1%) |
| 45 to 54 Years | 118 (76.6%) | 11 (9.3%) |
| 55 to 59 Years | 60 (89.6%) | 0 (0.0%) |
| 60 to 64 Years | 71 (53.4%) | 0 (0.0%) |
| 65 to 74 Years | 56 (35.0%) | 0 (0.0%) |
| 75 Years and over | 0 (0.0%) | 0 (0.0%) |
| Total | 665 (62.8%) | 27 (4.1%) |
Employment Status by Educational Attainment in Fairview
According to labor force statistics for Fairview, 72.9% of individuals (501) out of the total population between 25 and 64 years of age (687) are in the labor force, with 4.2% or 21 of them being unemployed. The group with the highest labor force participation rate are those with the educational attainment of bachelor's degree or higher, with 88.6% or 140 individuals in the labor force. Within the labor force, individuals with less than high school education have the highest percentage of unemployment, with 31.8% or 7 of them being unemployed.
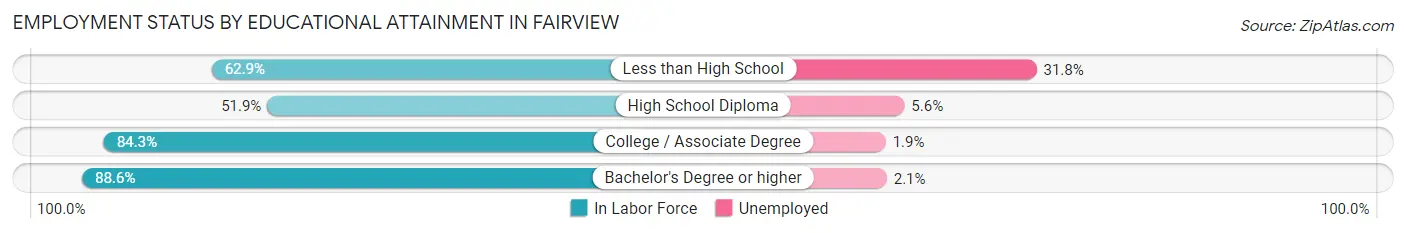
| Educational Attainment | In Labor Force | Unemployed |
| Less than High School | 22 (62.9%) | 11 (31.8%) |
| High School Diploma | 124 (51.9%) | 13 (5.6%) |
| College / Associate Degree | 215 (84.3%) | 5 (1.9%) |
| Bachelor's Degree or higher | 140 (88.6%) | 3 (2.1%) |
| Total | 501 (72.9%) | 29 (4.2%) |
Employment Occupations by Sex in Fairview
Management, Business, Science and Arts Occupations
The most common Management, Business, Science and Arts occupations in Fairview are Community & Social Service (53 | 8.3%), Management (49 | 7.7%), Education Instruction & Library (39 | 6.1%), Health Diagnosing & Treating (34 | 5.3%), and Health Technologists (34 | 5.3%).
Management, Business, Science and Arts Occupations by Sex
Within the Management, Business, Science and Arts occupations in Fairview, the most male-oriented occupations are Computers, Engineering & Science (100.0%), Computers & Mathematics (100.0%), and Management (83.7%), while the most female-oriented occupations are Legal Services & Support (100.0%), Health Diagnosing & Treating (97.1%), and Health Technologists (97.1%).
| Occupation | Male | Female |
| Management | 41 (83.7%) | 8 (16.3%) |
| Business & Financial | 18 (78.3%) | 5 (21.7%) |
| Computers, Engineering & Science | 8 (100.0%) | 0 (0.0%) |
| Computers & Mathematics | 8 (100.0%) | 0 (0.0%) |
| Architecture & Engineering | 0 (0.0%) | 0 (0.0%) |
| Life, Physical & Social Science | 0 (0.0%) | 0 (0.0%) |
| Community & Social Service | 16 (30.2%) | 37 (69.8%) |
| Education, Arts & Media | 3 (60.0%) | 2 (40.0%) |
| Legal Services & Support | 0 (0.0%) | 6 (100.0%) |
| Education Instruction & Library | 12 (30.8%) | 27 (69.2%) |
| Arts, Media & Entertainment | 1 (33.3%) | 2 (66.7%) |
| Health Diagnosing & Treating | 1 (2.9%) | 33 (97.1%) |
| Health Technologists | 1 (2.9%) | 33 (97.1%) |
| Total (Category) | 84 (50.3%) | 83 (49.7%) |
| Total (Overall) | 346 (54.2%) | 292 (45.8%) |
Services Occupations
The most common Services occupations in Fairview are Cleaning & Maintenance (44 | 6.9%), Personal Care & Service (9 | 1.4%), Security & Protection (5 | 0.8%), Law Enforcement (5 | 0.8%), and Food Preparation & Serving (5 | 0.8%).
Services Occupations by Sex
Within the Services occupations in Fairview, the most male-oriented occupations are Cleaning & Maintenance (75.0%), Security & Protection (20.0%), and Law Enforcement (20.0%), while the most female-oriented occupations are Healthcare Support (100.0%), Food Preparation & Serving (100.0%), and Personal Care & Service (100.0%).
| Occupation | Male | Female |
| Healthcare Support | 0 (0.0%) | 3 (100.0%) |
| Security & Protection | 1 (20.0%) | 4 (80.0%) |
| Firefighting & Prevention | 0 (0.0%) | 0 (0.0%) |
| Law Enforcement | 1 (20.0%) | 4 (80.0%) |
| Food Preparation & Serving | 0 (0.0%) | 5 (100.0%) |
| Cleaning & Maintenance | 33 (75.0%) | 11 (25.0%) |
| Personal Care & Service | 0 (0.0%) | 9 (100.0%) |
| Total (Category) | 34 (51.5%) | 32 (48.5%) |
| Total (Overall) | 346 (54.2%) | 292 (45.8%) |
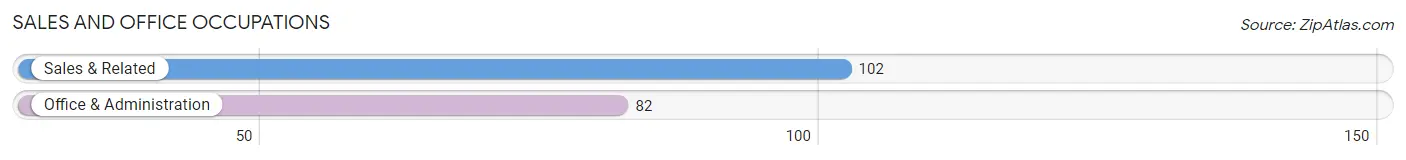
Sales and Office Occupations
The most common Sales and Office occupations in Fairview are Sales & Related (102 | 16.0%), and Office & Administration (82 | 12.9%).
Sales and Office Occupations by Sex

| Occupation | Male | Female |
| Sales & Related | 26 (25.5%) | 76 (74.5%) |
| Office & Administration | 13 (15.9%) | 69 (84.2%) |
| Total (Category) | 39 (21.2%) | 145 (78.8%) |
| Total (Overall) | 346 (54.2%) | 292 (45.8%) |
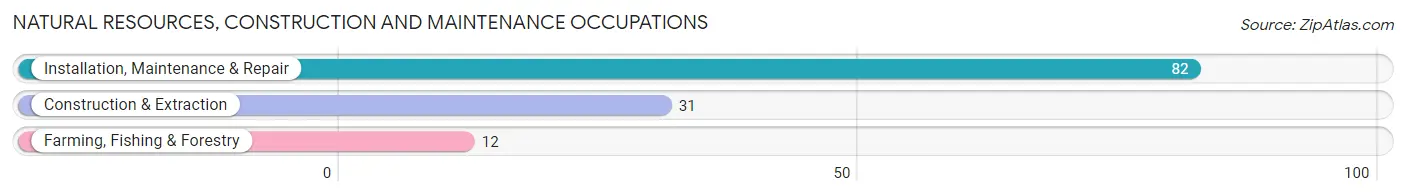
Natural Resources, Construction and Maintenance Occupations
The most common Natural Resources, Construction and Maintenance occupations in Fairview are Installation, Maintenance & Repair (82 | 12.9%), Construction & Extraction (31 | 4.9%), and Farming, Fishing & Forestry (12 | 1.9%).
Natural Resources, Construction and Maintenance Occupations by Sex
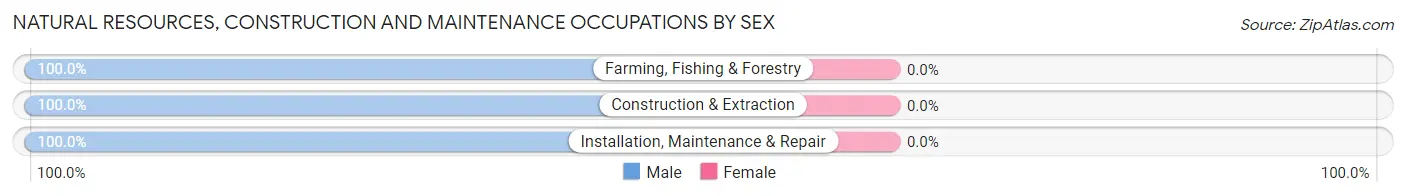
| Occupation | Male | Female |
| Farming, Fishing & Forestry | 12 (100.0%) | 0 (0.0%) |
| Construction & Extraction | 31 (100.0%) | 0 (0.0%) |
| Installation, Maintenance & Repair | 82 (100.0%) | 0 (0.0%) |
| Total (Category) | 125 (100.0%) | 0 (0.0%) |
| Total (Overall) | 346 (54.2%) | 292 (45.8%) |
Production, Transportation and Moving Occupations
The most common Production, Transportation and Moving occupations in Fairview are Material Moving (52 | 8.2%), Production (36 | 5.6%), and Transportation (8 | 1.3%).
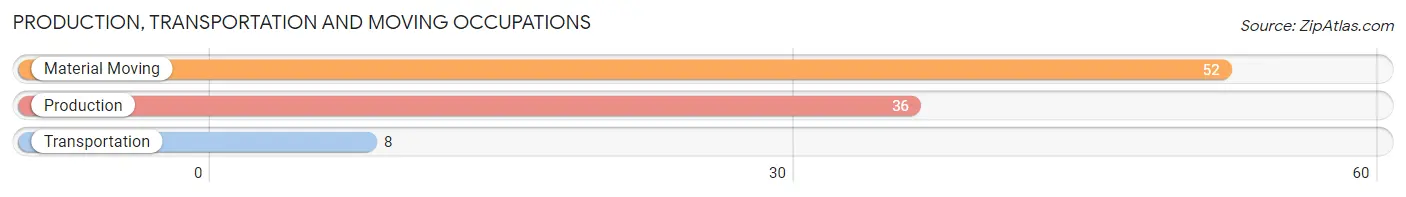
Production, Transportation and Moving Occupations by Sex
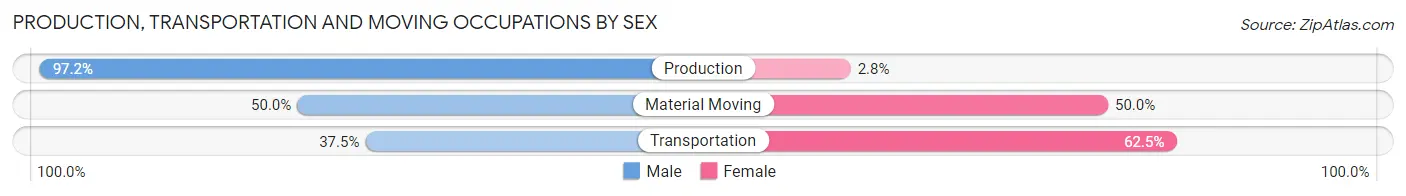
| Occupation | Male | Female |
| Production | 35 (97.2%) | 1 (2.8%) |
| Transportation | 3 (37.5%) | 5 (62.5%) |
| Material Moving | 26 (50.0%) | 26 (50.0%) |
| Total (Category) | 64 (66.7%) | 32 (33.3%) |
| Total (Overall) | 346 (54.2%) | 292 (45.8%) |
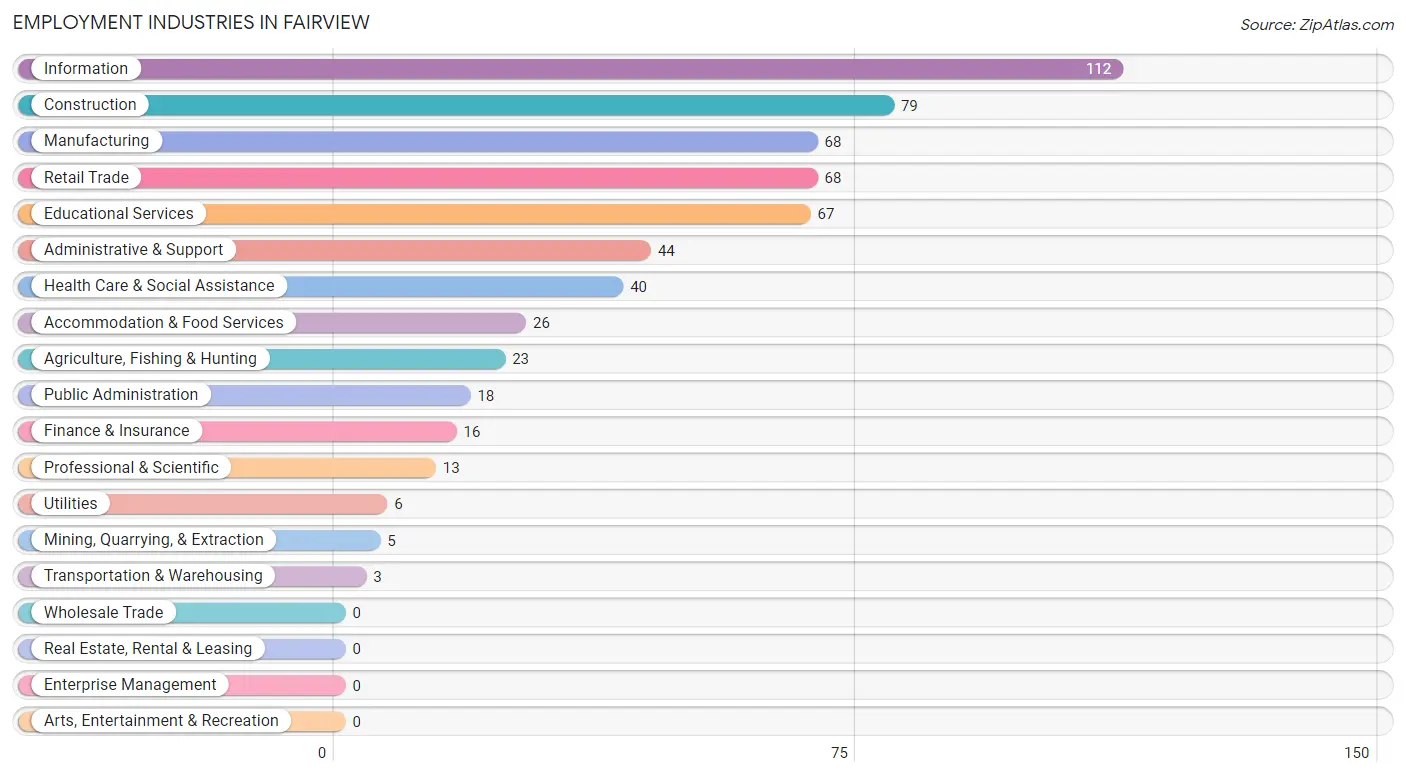
Employment Industries by Sex in Fairview
Employment Industries in Fairview
The major employment industries in Fairview include Information (112 | 17.5%), Construction (79 | 12.4%), Manufacturing (68 | 10.7%), Retail Trade (68 | 10.7%), and Educational Services (67 | 10.5%).
Employment Industries by Sex in Fairview
The Fairview industries that see more men than women are Mining, Quarrying, & Extraction (100.0%), Utilities (100.0%), and Agriculture, Fishing & Hunting (91.3%), whereas the industries that tend to have a higher number of women are Transportation & Warehousing (100.0%), Accommodation & Food Services (100.0%), and Health Care & Social Assistance (97.5%).
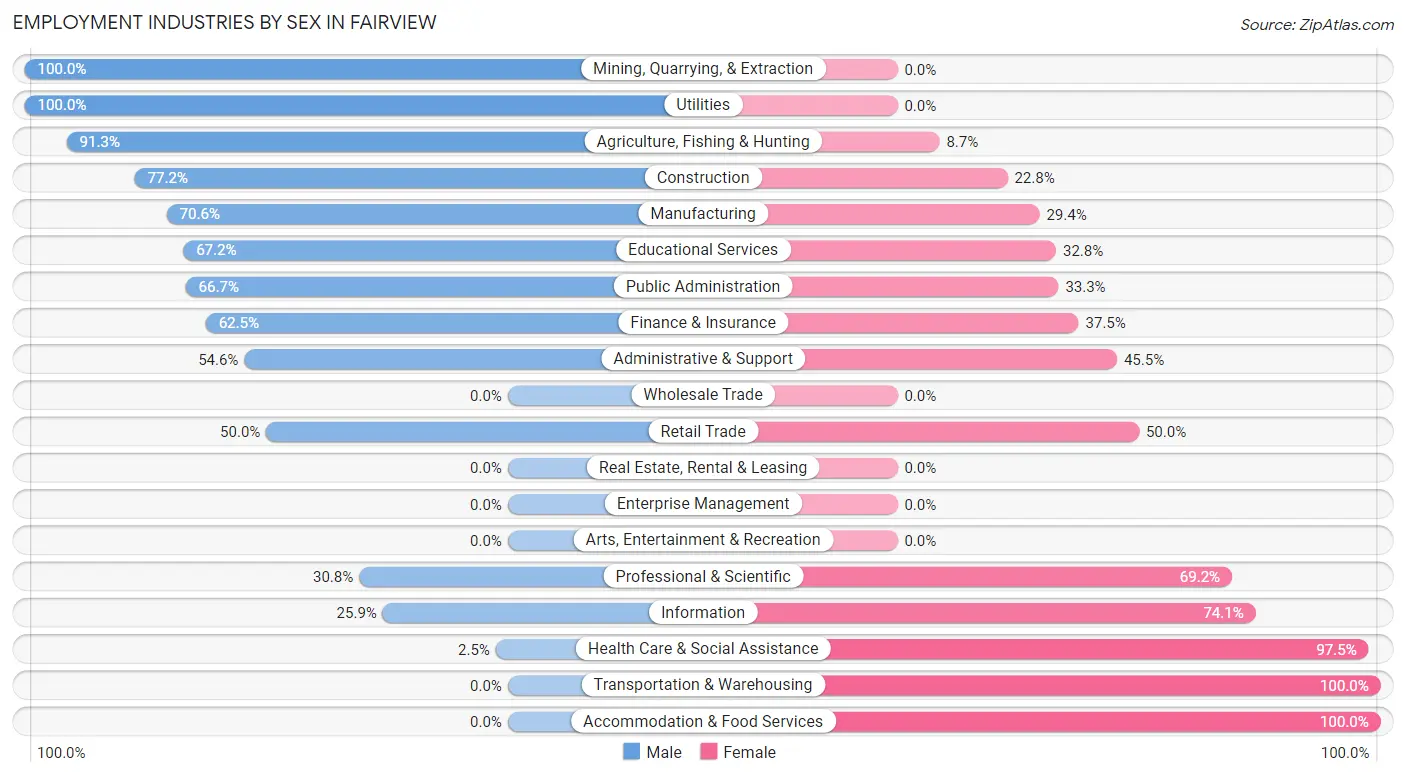
| Industry | Male | Female |
| Agriculture, Fishing & Hunting | 21 (91.3%) | 2 (8.7%) |
| Mining, Quarrying, & Extraction | 5 (100.0%) | 0 (0.0%) |
| Construction | 61 (77.2%) | 18 (22.8%) |
| Manufacturing | 48 (70.6%) | 20 (29.4%) |
| Wholesale Trade | 0 (0.0%) | 0 (0.0%) |
| Retail Trade | 34 (50.0%) | 34 (50.0%) |
| Transportation & Warehousing | 0 (0.0%) | 3 (100.0%) |
| Utilities | 6 (100.0%) | 0 (0.0%) |
| Information | 29 (25.9%) | 83 (74.1%) |
| Finance & Insurance | 10 (62.5%) | 6 (37.5%) |
| Real Estate, Rental & Leasing | 0 (0.0%) | 0 (0.0%) |
| Professional & Scientific | 4 (30.8%) | 9 (69.2%) |
| Enterprise Management | 0 (0.0%) | 0 (0.0%) |
| Administrative & Support | 24 (54.5%) | 20 (45.5%) |
| Educational Services | 45 (67.2%) | 22 (32.8%) |
| Health Care & Social Assistance | 1 (2.5%) | 39 (97.5%) |
| Arts, Entertainment & Recreation | 0 (0.0%) | 0 (0.0%) |
| Accommodation & Food Services | 0 (0.0%) | 26 (100.0%) |
| Public Administration | 12 (66.7%) | 6 (33.3%) |
| Total | 346 (54.2%) | 292 (45.8%) |
Education in Fairview
School Enrollment in Fairview
The most common levels of schooling among the 236 students in Fairview are middle school (77 | 32.6%), elementary school (50 | 21.2%), and high school (46 | 19.5%).
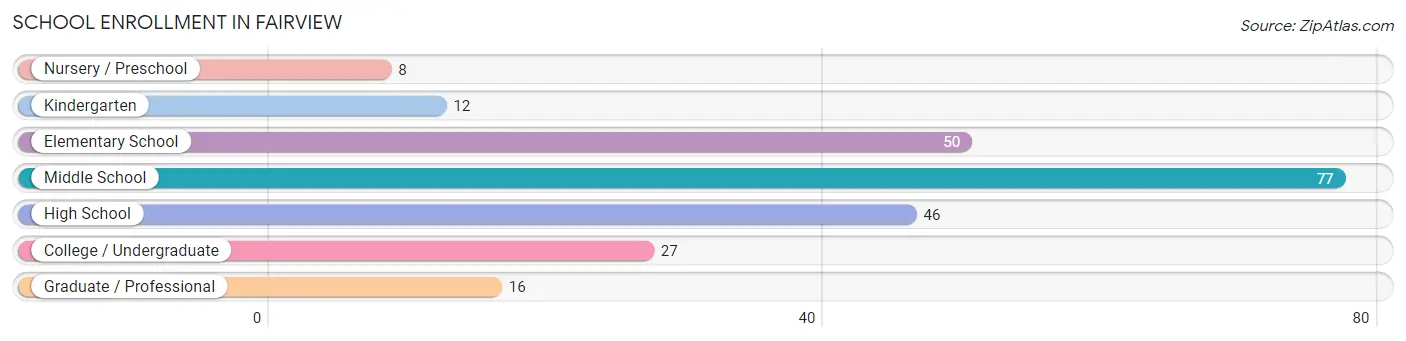
| School Level | # Students | % Students |
| Nursery / Preschool | 8 | 3.4% |
| Kindergarten | 12 | 5.1% |
| Elementary School | 50 | 21.2% |
| Middle School | 77 | 32.6% |
| High School | 46 | 19.5% |
| College / Undergraduate | 27 | 11.4% |
| Graduate / Professional | 16 | 6.8% |
| Total | 236 | 100.0% |
School Enrollment by Age by Funding Source in Fairview
Out of a total of 236 students who are enrolled in schools in Fairview, 9 (3.8%) attend a private institution, while the remaining 227 (96.2%) are enrolled in public schools. The age group of 25 to 34 year olds has the highest likelihood of being enrolled in private schools, with 6 (18.2% in the age bracket) enrolled. Conversely, the age group of 3 to 4 year olds has the lowest likelihood of being enrolled in a private school, with 8 (100.0% in the age bracket) attending a public institution.
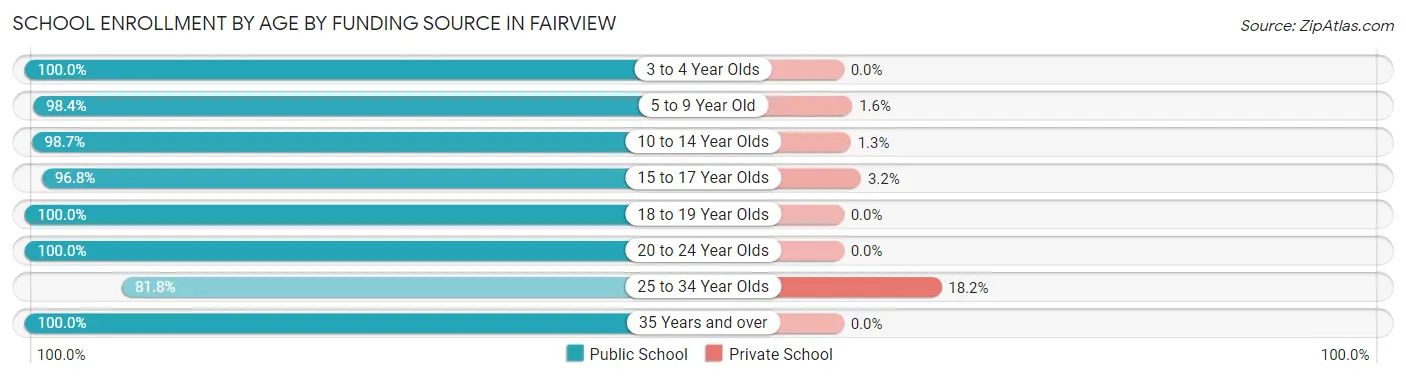
| Age Bracket | Public School | Private School |
| 3 to 4 Year Olds | 8 (100.0%) | 0 (0.0%) |
| 5 to 9 Year Old | 62 (98.4%) | 1 (1.6%) |
| 10 to 14 Year Olds | 75 (98.7%) | 1 (1.3%) |
| 15 to 17 Year Olds | 30 (96.8%) | 1 (3.2%) |
| 18 to 19 Year Olds | 16 (100.0%) | 0 (0.0%) |
| 20 to 24 Year Olds | 1 (100.0%) | 0 (0.0%) |
| 25 to 34 Year Olds | 27 (81.8%) | 6 (18.2%) |
| 35 Years and over | 8 (100.0%) | 0 (0.0%) |
| Total | 227 (96.2%) | 9 (3.8%) |
Educational Attainment by Field of Study in Fairview
Business (75 | 36.2%), education (55 | 26.6%), arts & humanities (21 | 10.1%), science & technology (15 | 7.2%), and bio, nature & agricultural (11 | 5.3%) are the most common fields of study among 207 individuals in Fairview who have obtained a bachelor's degree or higher.
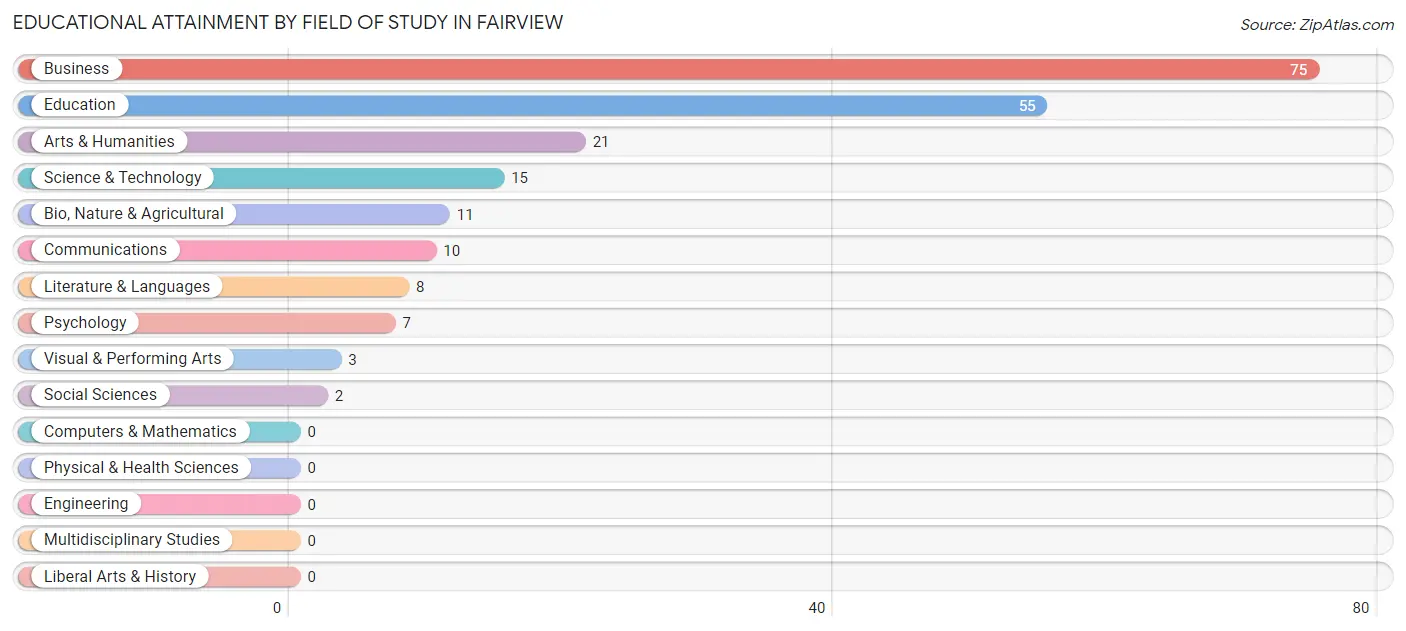
| Field of Study | # Graduates | % Graduates |
| Computers & Mathematics | 0 | 0.0% |
| Bio, Nature & Agricultural | 11 | 5.3% |
| Physical & Health Sciences | 0 | 0.0% |
| Psychology | 7 | 3.4% |
| Social Sciences | 2 | 1.0% |
| Engineering | 0 | 0.0% |
| Multidisciplinary Studies | 0 | 0.0% |
| Science & Technology | 15 | 7.2% |
| Business | 75 | 36.2% |
| Education | 55 | 26.6% |
| Literature & Languages | 8 | 3.9% |
| Liberal Arts & History | 0 | 0.0% |
| Visual & Performing Arts | 3 | 1.5% |
| Communications | 10 | 4.8% |
| Arts & Humanities | 21 | 10.1% |
| Total | 207 | 100.0% |
Transportation & Commute in Fairview
Vehicle Availability by Sex in Fairview
The most prevalent vehicle ownership categories in Fairview are males with 2 vehicles (153, accounting for 44.2%) and females with 2 vehicles (90, making up 53.1%).
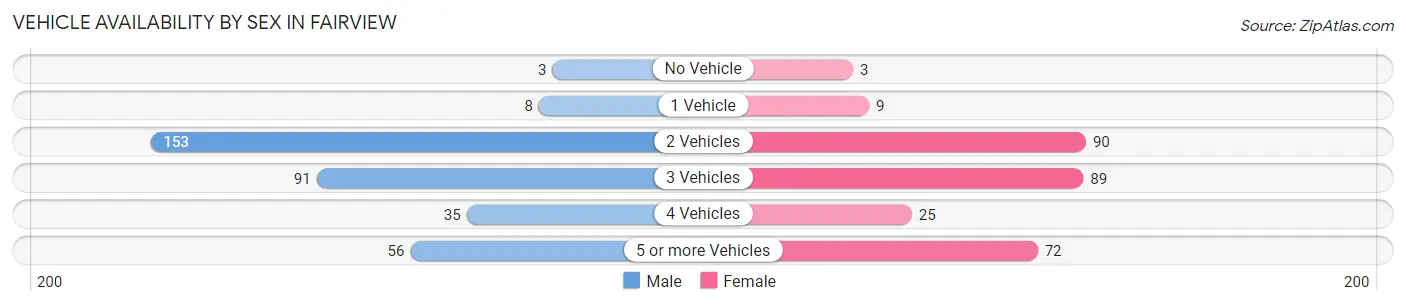
| Vehicles Available | Male | Female |
| No Vehicle | 3 (0.9%) | 3 (1.0%) |
| 1 Vehicle | 8 (2.3%) | 9 (3.1%) |
| 2 Vehicles | 153 (44.2%) | 90 (31.2%) |
| 3 Vehicles | 91 (26.3%) | 89 (30.9%) |
| 4 Vehicles | 35 (10.1%) | 25 (8.7%) |
| 5 or more Vehicles | 56 (16.2%) | 72 (25.0%) |
| Total | 346 (100.0%) | 288 (100.0%) |
Commute Time in Fairview
The most frequently occuring commute durations in Fairview are less than 5 minutes (123 commuters, 23.6%), 60 to 89 minutes (113 commuters, 21.7%), and 10 to 14 minutes (67 commuters, 12.9%).
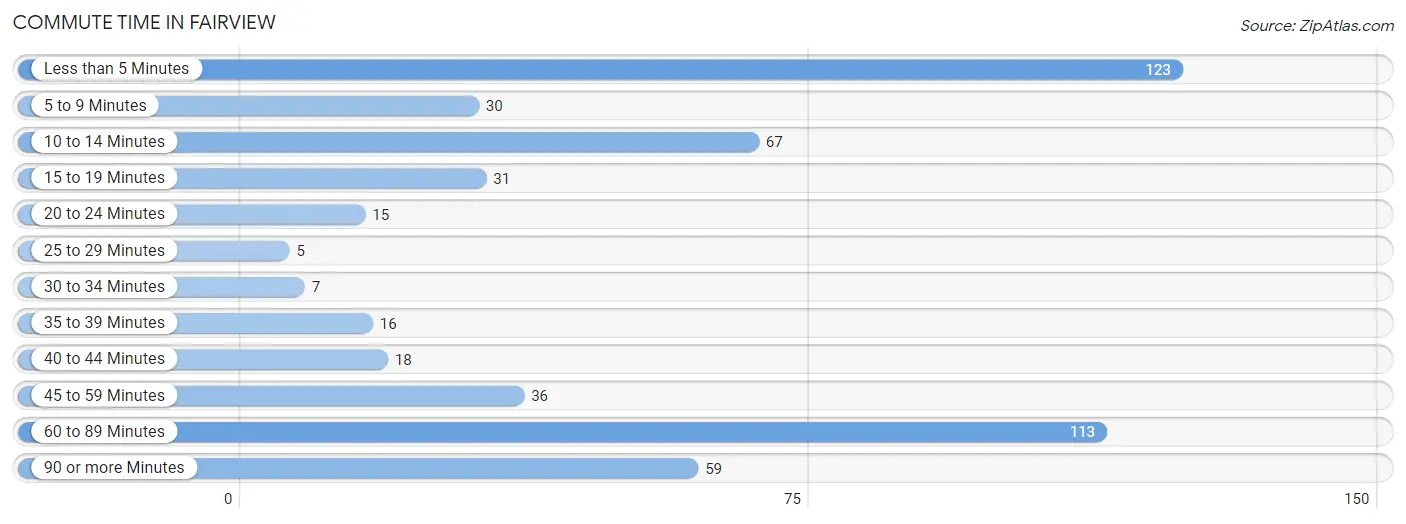
| Commute Time | # Commuters | % Commuters |
| Less than 5 Minutes | 123 | 23.6% |
| 5 to 9 Minutes | 30 | 5.8% |
| 10 to 14 Minutes | 67 | 12.9% |
| 15 to 19 Minutes | 31 | 6.0% |
| 20 to 24 Minutes | 15 | 2.9% |
| 25 to 29 Minutes | 5 | 1.0% |
| 30 to 34 Minutes | 7 | 1.3% |
| 35 to 39 Minutes | 16 | 3.1% |
| 40 to 44 Minutes | 18 | 3.5% |
| 45 to 59 Minutes | 36 | 6.9% |
| 60 to 89 Minutes | 113 | 21.7% |
| 90 or more Minutes | 59 | 11.4% |
Commute Time by Sex in Fairview
The most common commute times in Fairview are 60 to 89 minutes (101 commuters, 29.8%) for males and less than 5 minutes (52 commuters, 28.7%) for females.
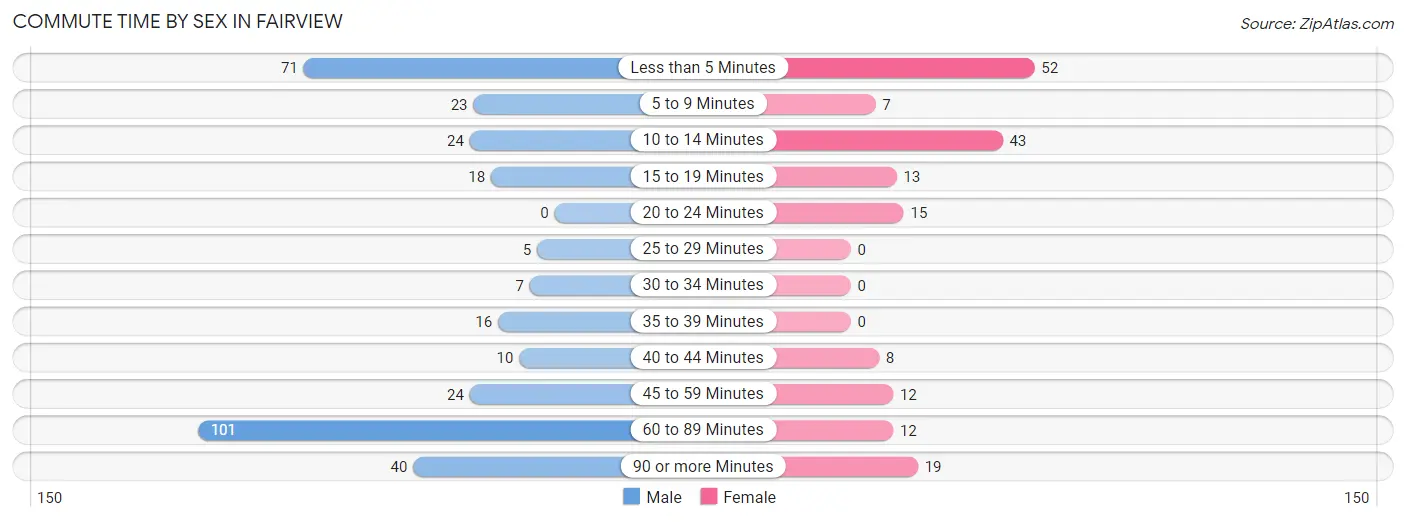
| Commute Time | Male | Female |
| Less than 5 Minutes | 71 (20.9%) | 52 (28.7%) |
| 5 to 9 Minutes | 23 (6.8%) | 7 (3.9%) |
| 10 to 14 Minutes | 24 (7.1%) | 43 (23.8%) |
| 15 to 19 Minutes | 18 (5.3%) | 13 (7.2%) |
| 20 to 24 Minutes | 0 (0.0%) | 15 (8.3%) |
| 25 to 29 Minutes | 5 (1.5%) | 0 (0.0%) |
| 30 to 34 Minutes | 7 (2.1%) | 0 (0.0%) |
| 35 to 39 Minutes | 16 (4.7%) | 0 (0.0%) |
| 40 to 44 Minutes | 10 (2.9%) | 8 (4.4%) |
| 45 to 59 Minutes | 24 (7.1%) | 12 (6.6%) |
| 60 to 89 Minutes | 101 (29.8%) | 12 (6.6%) |
| 90 or more Minutes | 40 (11.8%) | 19 (10.5%) |
Time of Departure to Work by Sex in Fairview
The most frequent times of departure to work in Fairview are 7:30 AM to 7:59 AM (63, 18.6%) for males and 10:00 AM to 10:59 AM (36, 19.9%) for females.
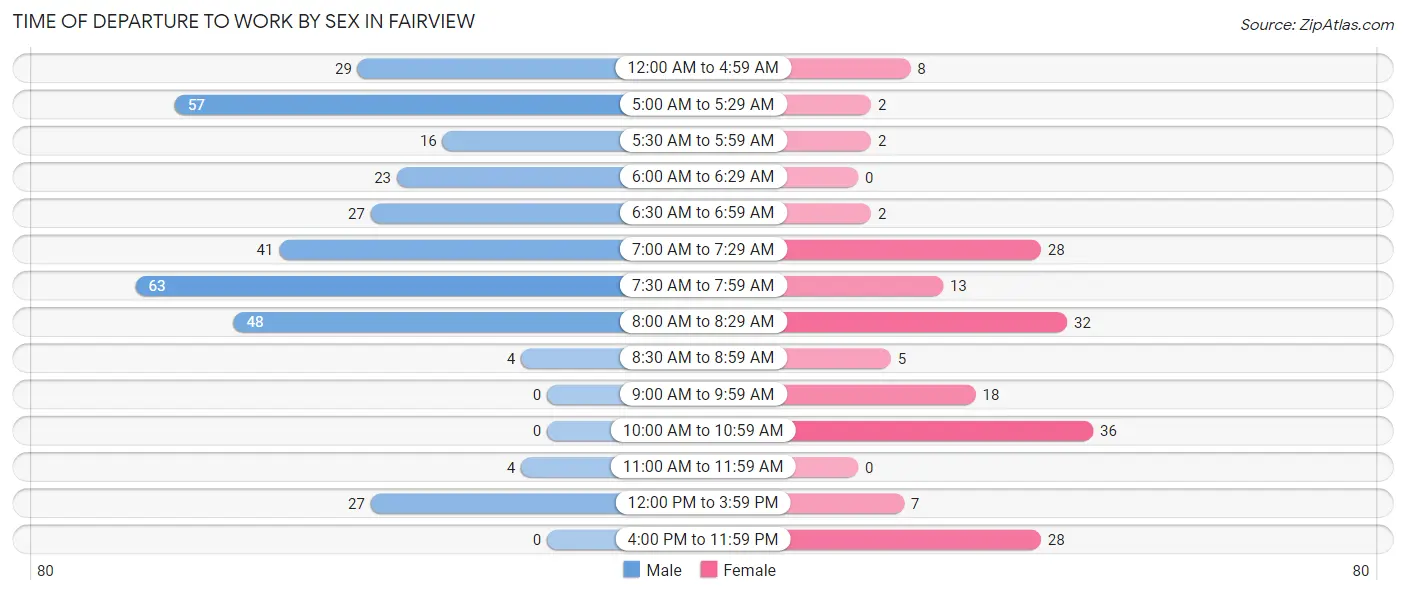
| Time of Departure | Male | Female |
| 12:00 AM to 4:59 AM | 29 (8.6%) | 8 (4.4%) |
| 5:00 AM to 5:29 AM | 57 (16.8%) | 2 (1.1%) |
| 5:30 AM to 5:59 AM | 16 (4.7%) | 2 (1.1%) |
| 6:00 AM to 6:29 AM | 23 (6.8%) | 0 (0.0%) |
| 6:30 AM to 6:59 AM | 27 (8.0%) | 2 (1.1%) |
| 7:00 AM to 7:29 AM | 41 (12.1%) | 28 (15.5%) |
| 7:30 AM to 7:59 AM | 63 (18.6%) | 13 (7.2%) |
| 8:00 AM to 8:29 AM | 48 (14.2%) | 32 (17.7%) |
| 8:30 AM to 8:59 AM | 4 (1.2%) | 5 (2.8%) |
| 9:00 AM to 9:59 AM | 0 (0.0%) | 18 (9.9%) |
| 10:00 AM to 10:59 AM | 0 (0.0%) | 36 (19.9%) |
| 11:00 AM to 11:59 AM | 4 (1.2%) | 0 (0.0%) |
| 12:00 PM to 3:59 PM | 27 (8.0%) | 7 (3.9%) |
| 4:00 PM to 11:59 PM | 0 (0.0%) | 28 (15.5%) |
| Total | 339 (100.0%) | 181 (100.0%) |
Housing Occupancy in Fairview
Occupancy by Ownership in Fairview
Of the total 488 dwellings in Fairview, owner-occupied units account for 436 (89.3%), while renter-occupied units make up 52 (10.7%).
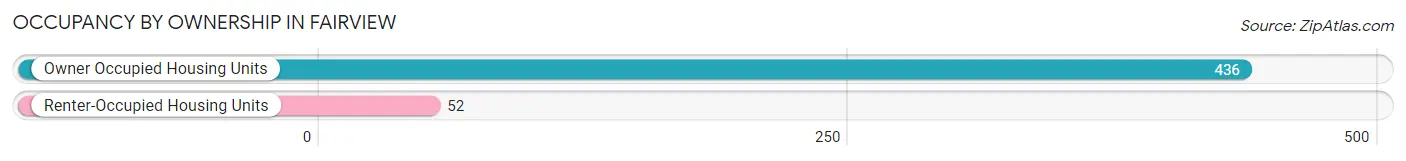
| Occupancy | # Housing Units | % Housing Units |
| Owner Occupied Housing Units | 436 | 89.3% |
| Renter-Occupied Housing Units | 52 | 10.7% |
| Total Occupied Housing Units | 488 | 100.0% |
Occupancy by Household Size in Fairview
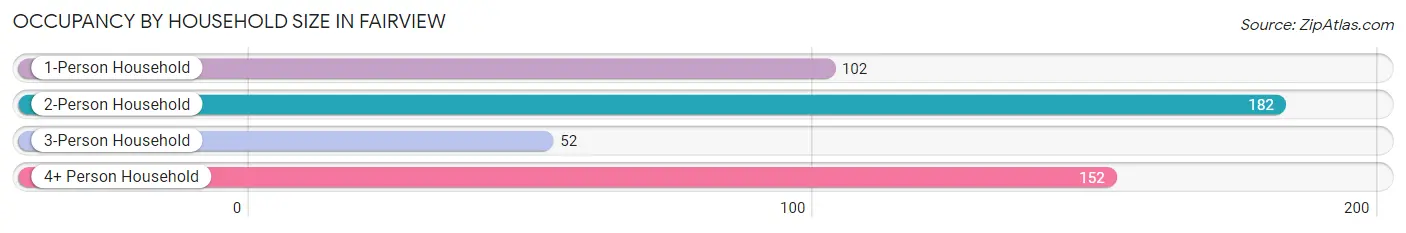
| Household Size | # Housing Units | % Housing Units |
| 1-Person Household | 102 | 20.9% |
| 2-Person Household | 182 | 37.3% |
| 3-Person Household | 52 | 10.7% |
| 4+ Person Household | 152 | 31.1% |
| Total Housing Units | 488 | 100.0% |
Occupancy by Ownership by Household Size in Fairview
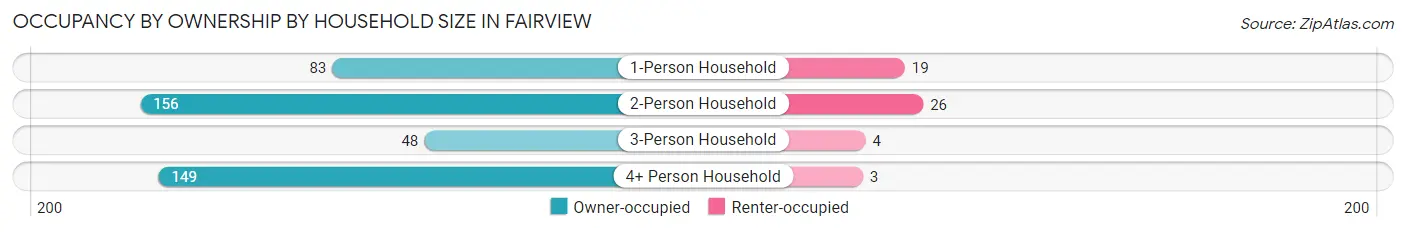
| Household Size | Owner-occupied | Renter-occupied |
| 1-Person Household | 83 (81.4%) | 19 (18.6%) |
| 2-Person Household | 156 (85.7%) | 26 (14.3%) |
| 3-Person Household | 48 (92.3%) | 4 (7.7%) |
| 4+ Person Household | 149 (98.0%) | 3 (2.0%) |
| Total Housing Units | 436 (89.3%) | 52 (10.7%) |
Occupancy by Educational Attainment in Fairview
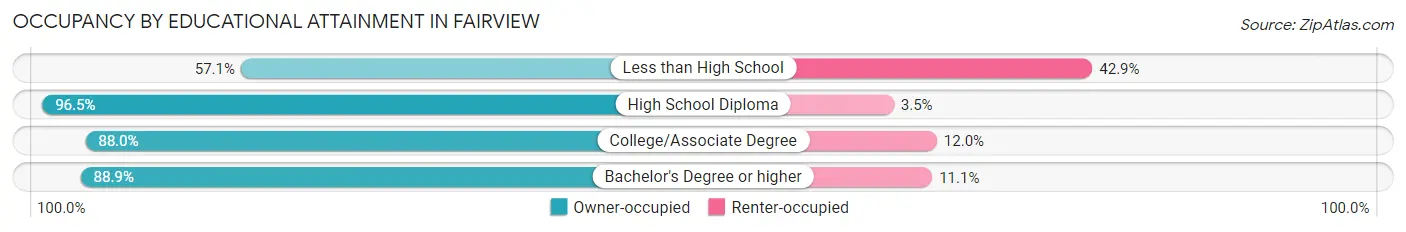
| Household Size | Owner-occupied | Renter-occupied |
| Less than High School | 12 (57.1%) | 9 (42.9%) |
| High School Diploma | 138 (96.5%) | 5 (3.5%) |
| College/Associate Degree | 190 (88.0%) | 26 (12.0%) |
| Bachelor's Degree or higher | 96 (88.9%) | 12 (11.1%) |
Occupancy by Age of Householder in Fairview
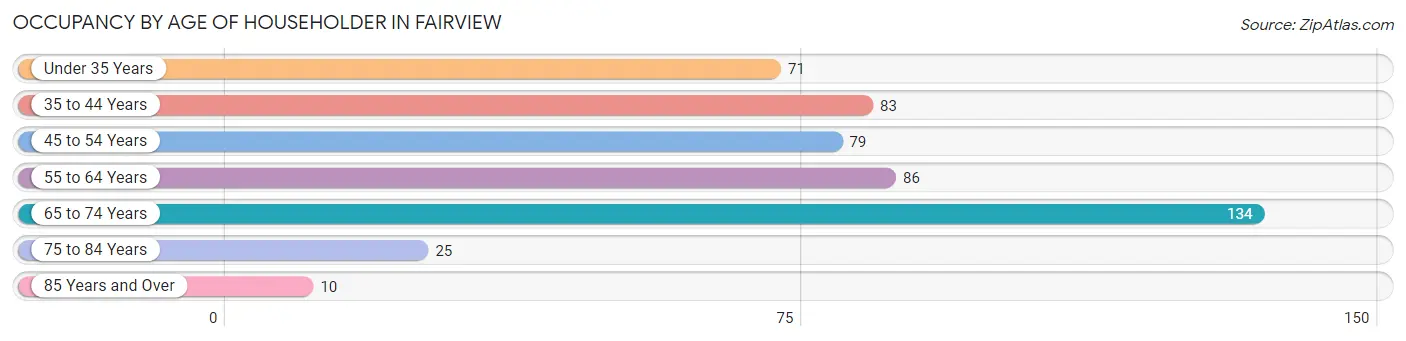
| Age Bracket | # Households | % Households |
| Under 35 Years | 71 | 14.5% |
| 35 to 44 Years | 83 | 17.0% |
| 45 to 54 Years | 79 | 16.2% |
| 55 to 64 Years | 86 | 17.6% |
| 65 to 74 Years | 134 | 27.5% |
| 75 to 84 Years | 25 | 5.1% |
| 85 Years and Over | 10 | 2.1% |
| Total | 488 | 100.0% |
Housing Finances in Fairview
Median Income by Occupancy in Fairview
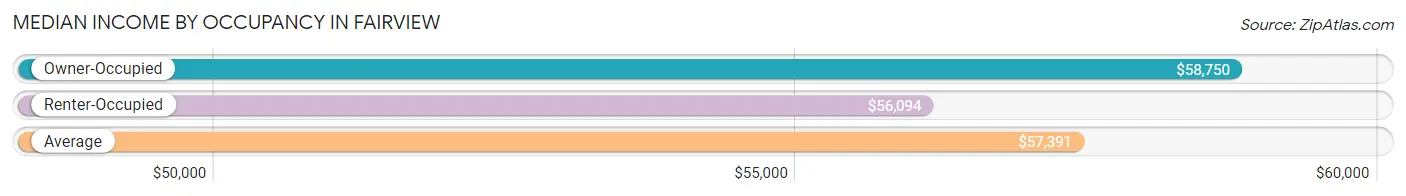
| Occupancy Type | # Households | Median Income |
| Owner-Occupied | 436 (89.3%) | $58,750 |
| Renter-Occupied | 52 (10.7%) | $56,094 |
| Average | 488 (100.0%) | $57,391 |
Occupancy by Householder Income Bracket in Fairview
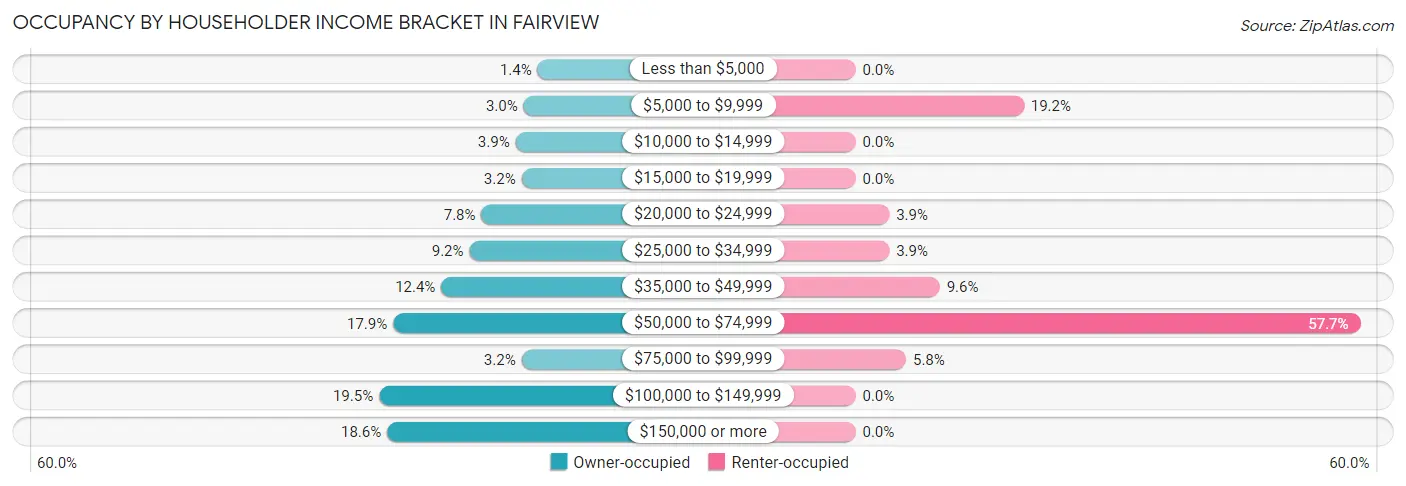
| Income Bracket | Owner-occupied | Renter-occupied |
| Less than $5,000 | 6 (1.4%) | 0 (0.0%) |
| $5,000 to $9,999 | 13 (3.0%) | 10 (19.2%) |
| $10,000 to $14,999 | 17 (3.9%) | 0 (0.0%) |
| $15,000 to $19,999 | 14 (3.2%) | 0 (0.0%) |
| $20,000 to $24,999 | 34 (7.8%) | 2 (3.8%) |
| $25,000 to $34,999 | 40 (9.2%) | 2 (3.8%) |
| $35,000 to $49,999 | 54 (12.4%) | 5 (9.6%) |
| $50,000 to $74,999 | 78 (17.9%) | 30 (57.7%) |
| $75,000 to $99,999 | 14 (3.2%) | 3 (5.8%) |
| $100,000 to $149,999 | 85 (19.5%) | 0 (0.0%) |
| $150,000 or more | 81 (18.6%) | 0 (0.0%) |
| Total | 436 (100.0%) | 52 (100.0%) |
Monthly Housing Cost Tiers in Fairview
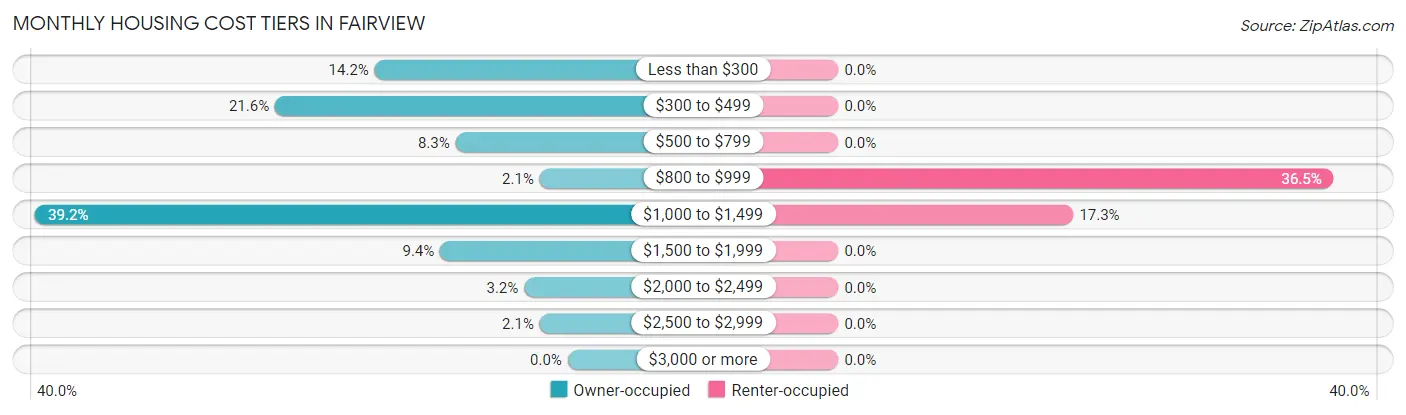
| Monthly Cost | Owner-occupied | Renter-occupied |
| Less than $300 | 62 (14.2%) | 0 (0.0%) |
| $300 to $499 | 94 (21.6%) | 0 (0.0%) |
| $500 to $799 | 36 (8.3%) | 0 (0.0%) |
| $800 to $999 | 9 (2.1%) | 19 (36.5%) |
| $1,000 to $1,499 | 171 (39.2%) | 9 (17.3%) |
| $1,500 to $1,999 | 41 (9.4%) | 0 (0.0%) |
| $2,000 to $2,499 | 14 (3.2%) | 0 (0.0%) |
| $2,500 to $2,999 | 9 (2.1%) | 0 (0.0%) |
| $3,000 or more | 0 (0.0%) | 0 (0.0%) |
| Total | 436 (100.0%) | 52 (100.0%) |
Physical Housing Characteristics in Fairview
Housing Structures in Fairview
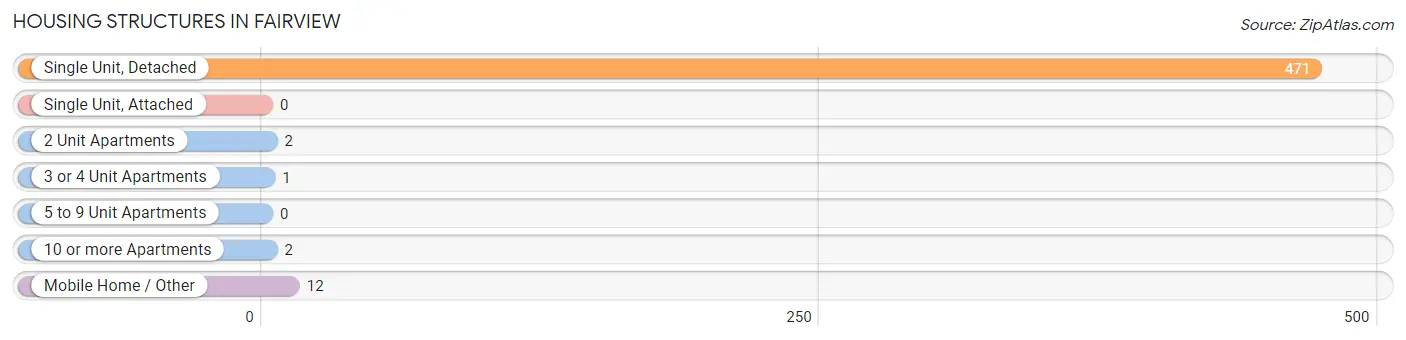
| Structure Type | # Housing Units | % Housing Units |
| Single Unit, Detached | 471 | 96.5% |
| Single Unit, Attached | 0 | 0.0% |
| 2 Unit Apartments | 2 | 0.4% |
| 3 or 4 Unit Apartments | 1 | 0.2% |
| 5 to 9 Unit Apartments | 0 | 0.0% |
| 10 or more Apartments | 2 | 0.4% |
| Mobile Home / Other | 12 | 2.5% |
| Total | 488 | 100.0% |
Housing Structures by Occupancy in Fairview
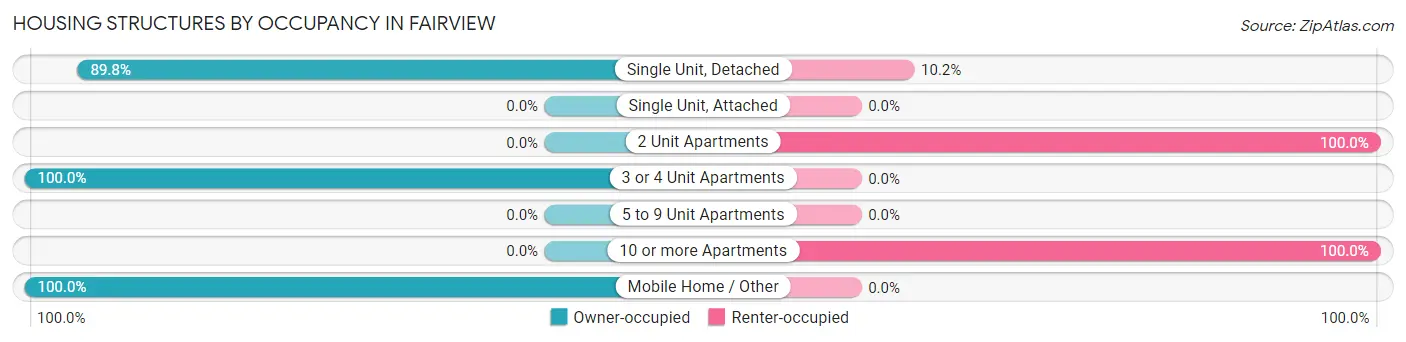
| Structure Type | Owner-occupied | Renter-occupied |
| Single Unit, Detached | 423 (89.8%) | 48 (10.2%) |
| Single Unit, Attached | 0 (0.0%) | 0 (0.0%) |
| 2 Unit Apartments | 0 (0.0%) | 2 (100.0%) |
| 3 or 4 Unit Apartments | 1 (100.0%) | 0 (0.0%) |
| 5 to 9 Unit Apartments | 0 (0.0%) | 0 (0.0%) |
| 10 or more Apartments | 0 (0.0%) | 2 (100.0%) |
| Mobile Home / Other | 12 (100.0%) | 0 (0.0%) |
| Total | 436 (89.3%) | 52 (10.7%) |
Housing Structures by Number of Rooms in Fairview
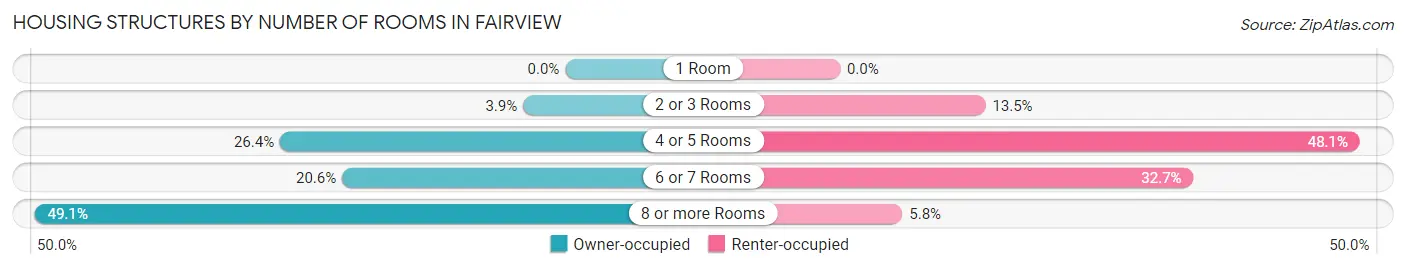
| Number of Rooms | Owner-occupied | Renter-occupied |
| 1 Room | 0 (0.0%) | 0 (0.0%) |
| 2 or 3 Rooms | 17 (3.9%) | 7 (13.5%) |
| 4 or 5 Rooms | 115 (26.4%) | 25 (48.1%) |
| 6 or 7 Rooms | 90 (20.6%) | 17 (32.7%) |
| 8 or more Rooms | 214 (49.1%) | 3 (5.8%) |
| Total | 436 (100.0%) | 52 (100.0%) |
Housing Structure by Heating Type in Fairview
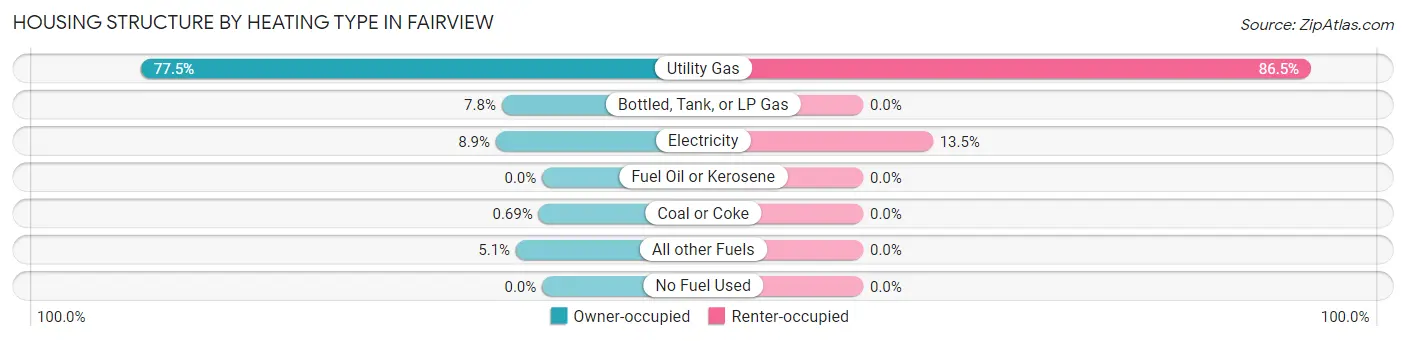
| Heating Type | Owner-occupied | Renter-occupied |
| Utility Gas | 338 (77.5%) | 45 (86.5%) |
| Bottled, Tank, or LP Gas | 34 (7.8%) | 0 (0.0%) |
| Electricity | 39 (8.9%) | 7 (13.5%) |
| Fuel Oil or Kerosene | 0 (0.0%) | 0 (0.0%) |
| Coal or Coke | 3 (0.7%) | 0 (0.0%) |
| All other Fuels | 22 (5.1%) | 0 (0.0%) |
| No Fuel Used | 0 (0.0%) | 0 (0.0%) |
| Total | 436 (100.0%) | 52 (100.0%) |
Household Vehicle Usage in Fairview
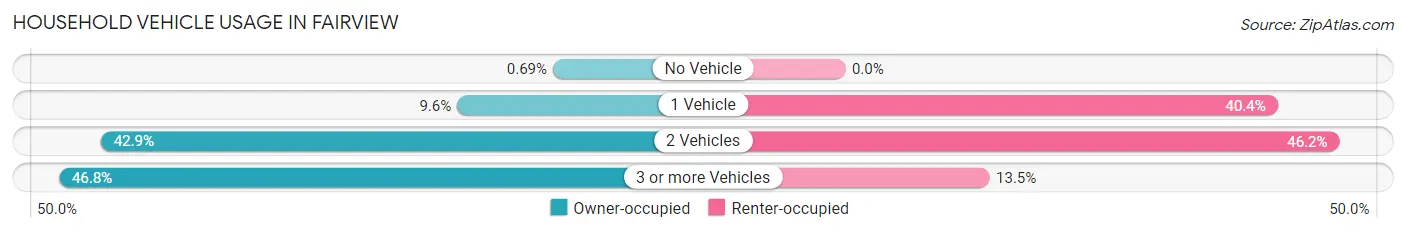
| Vehicles per Household | Owner-occupied | Renter-occupied |
| No Vehicle | 3 (0.7%) | 0 (0.0%) |
| 1 Vehicle | 42 (9.6%) | 21 (40.4%) |
| 2 Vehicles | 187 (42.9%) | 24 (46.2%) |
| 3 or more Vehicles | 204 (46.8%) | 7 (13.5%) |
| Total | 436 (100.0%) | 52 (100.0%) |
Real Estate & Mortgages in Fairview
Real Estate and Mortgage Overview in Fairview
| Characteristic | Without Mortgage | With Mortgage |
| Housing Units | 183 | 253 |
| Median Property Value | $199,000 | $258,800 |
| Median Household Income | $49,844 | $69 |
| Monthly Housing Costs | $352 | $0 |
| Real Estate Taxes | $1,196 | $4 |
Property Value by Mortgage Status in Fairview
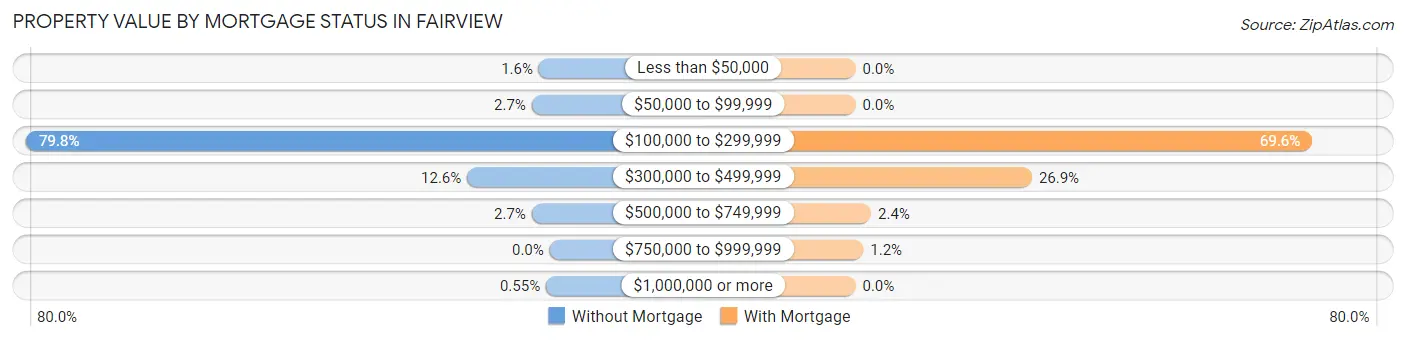
| Property Value | Without Mortgage | With Mortgage |
| Less than $50,000 | 3 (1.6%) | 0 (0.0%) |
| $50,000 to $99,999 | 5 (2.7%) | 0 (0.0%) |
| $100,000 to $299,999 | 146 (79.8%) | 176 (69.6%) |
| $300,000 to $499,999 | 23 (12.6%) | 68 (26.9%) |
| $500,000 to $749,999 | 5 (2.7%) | 6 (2.4%) |
| $750,000 to $999,999 | 0 (0.0%) | 3 (1.2%) |
| $1,000,000 or more | 1 (0.5%) | 0 (0.0%) |
| Total | 183 (100.0%) | 253 (100.0%) |
Household Income by Mortgage Status in Fairview
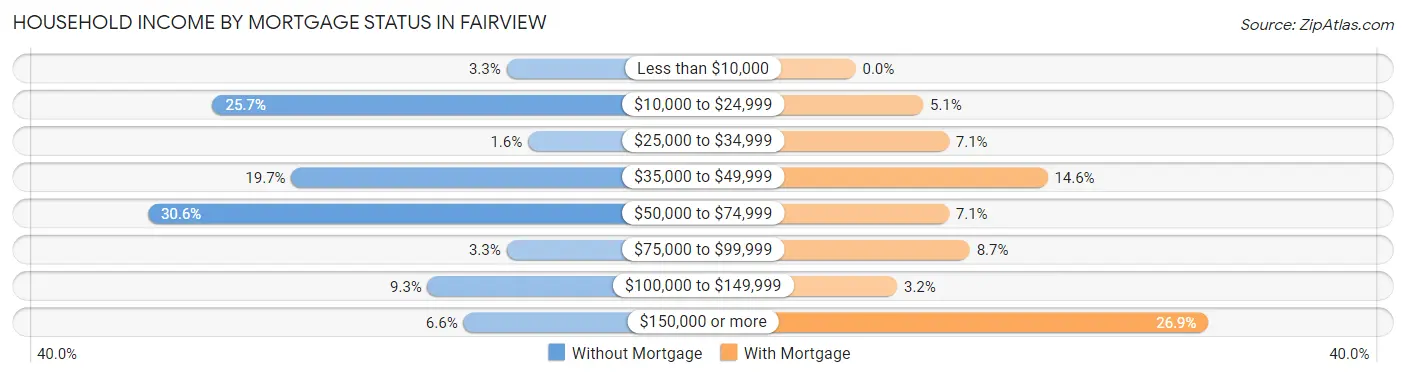
| Household Income | Without Mortgage | With Mortgage |
| Less than $10,000 | 6 (3.3%) | 0 (0.0%) |
| $10,000 to $24,999 | 47 (25.7%) | 13 (5.1%) |
| $25,000 to $34,999 | 3 (1.6%) | 18 (7.1%) |
| $35,000 to $49,999 | 36 (19.7%) | 37 (14.6%) |
| $50,000 to $74,999 | 56 (30.6%) | 18 (7.1%) |
| $75,000 to $99,999 | 6 (3.3%) | 22 (8.7%) |
| $100,000 to $149,999 | 17 (9.3%) | 8 (3.2%) |
| $150,000 or more | 12 (6.6%) | 68 (26.9%) |
| Total | 183 (100.0%) | 253 (100.0%) |
Property Value to Household Income Ratio in Fairview
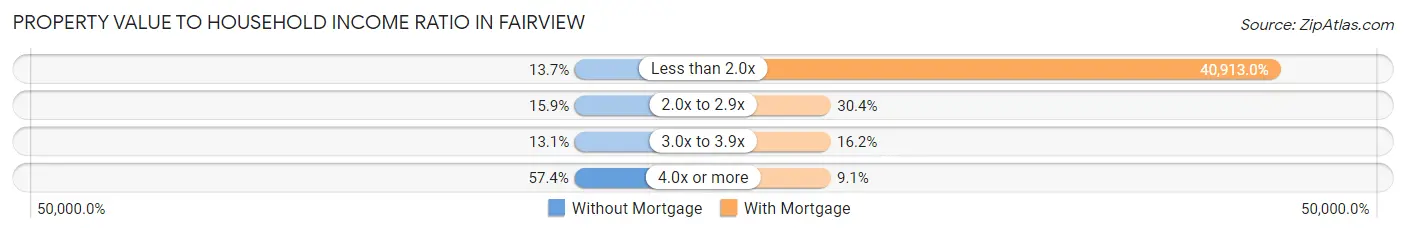
| Value-to-Income Ratio | Without Mortgage | With Mortgage |
| Less than 2.0x | 25 (13.7%) | 103,510 (40,913.0%) |
| 2.0x to 2.9x | 29 (15.9%) | 77 (30.4%) |
| 3.0x to 3.9x | 24 (13.1%) | 41 (16.2%) |
| 4.0x or more | 105 (57.4%) | 23 (9.1%) |
| Total | 183 (100.0%) | 253 (100.0%) |
Real Estate Taxes by Mortgage Status in Fairview
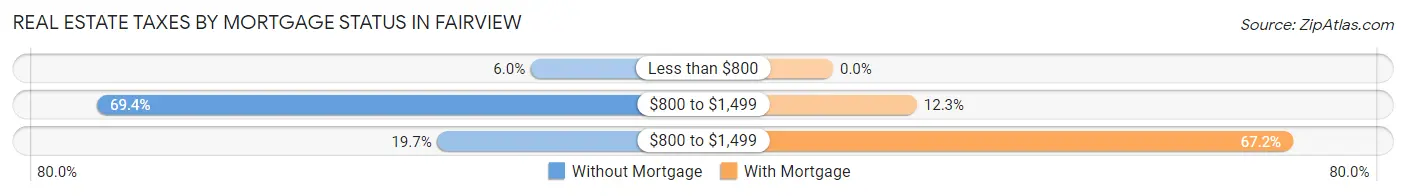
| Property Taxes | Without Mortgage | With Mortgage |
| Less than $800 | 11 (6.0%) | 0 (0.0%) |
| $800 to $1,499 | 127 (69.4%) | 31 (12.2%) |
| $800 to $1,499 | 36 (19.7%) | 170 (67.2%) |
| Total | 183 (100.0%) | 253 (100.0%) |
Health & Disability in Fairview
Health Insurance Coverage by Age in Fairview
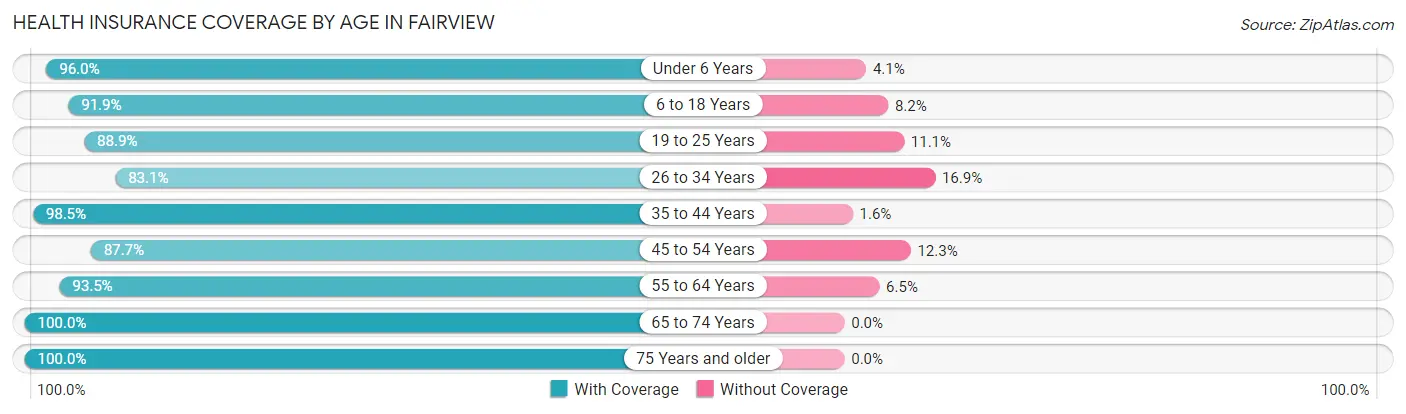
| Age Bracket | With Coverage | Without Coverage |
| Under 6 Years | 71 (96.0%) | 3 (4.1%) |
| 6 to 18 Years | 169 (91.8%) | 15 (8.2%) |
| 19 to 25 Years | 88 (88.9%) | 11 (11.1%) |
| 26 to 34 Years | 113 (83.1%) | 23 (16.9%) |
| 35 to 44 Years | 191 (98.5%) | 3 (1.5%) |
| 45 to 54 Years | 135 (87.7%) | 19 (12.3%) |
| 55 to 64 Years | 187 (93.5%) | 13 (6.5%) |
| 65 to 74 Years | 160 (100.0%) | 0 (0.0%) |
| 75 Years and older | 87 (100.0%) | 0 (0.0%) |
| Total | 1,201 (93.2%) | 87 (6.8%) |
Health Insurance Coverage by Citizenship Status in Fairview
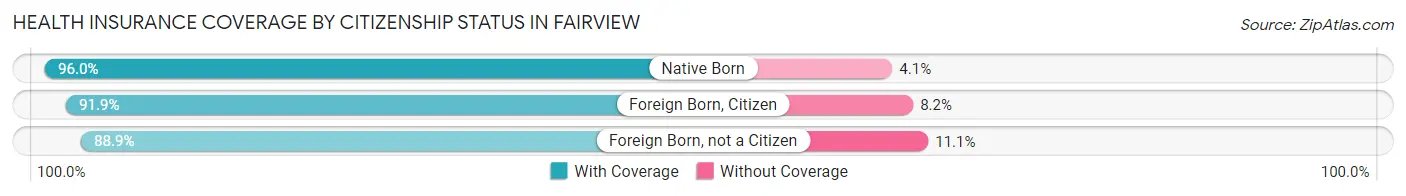
| Citizenship Status | With Coverage | Without Coverage |
| Native Born | 71 (96.0%) | 3 (4.1%) |
| Foreign Born, Citizen | 169 (91.8%) | 15 (8.2%) |
| Foreign Born, not a Citizen | 88 (88.9%) | 11 (11.1%) |
Health Insurance Coverage by Household Income in Fairview
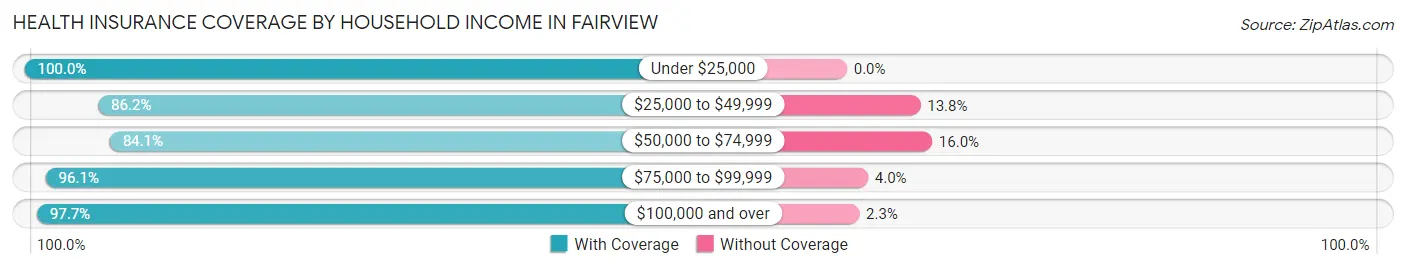
| Household Income | With Coverage | Without Coverage |
| Under $25,000 | 171 (100.0%) | 0 (0.0%) |
| $25,000 to $49,999 | 213 (86.2%) | 34 (13.8%) |
| $50,000 to $74,999 | 195 (84.1%) | 37 (16.0%) |
| $75,000 to $99,999 | 73 (96.1%) | 3 (4.0%) |
| $100,000 and over | 549 (97.7%) | 13 (2.3%) |
Public vs Private Health Insurance Coverage by Age in Fairview
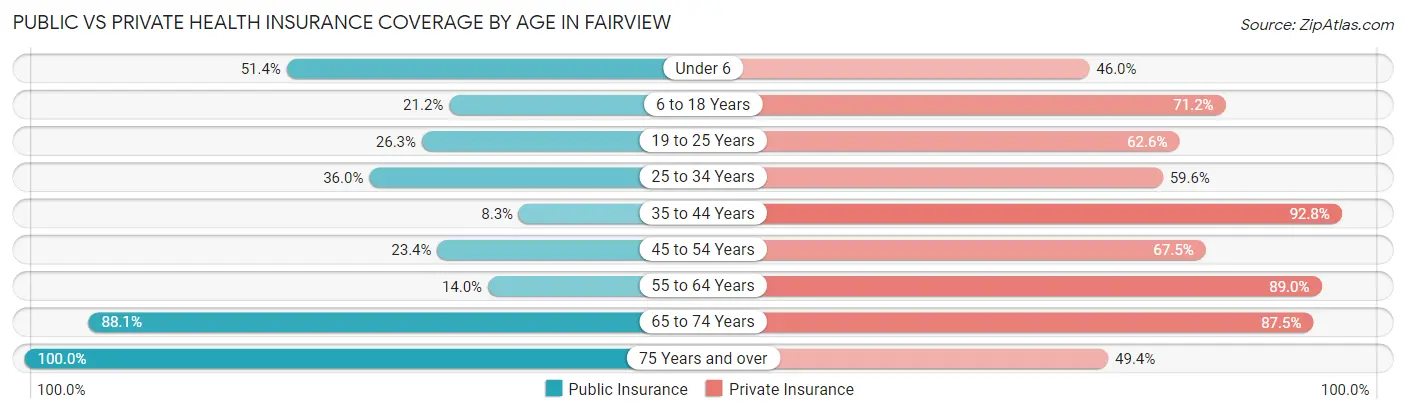
| Age Bracket | Public Insurance | Private Insurance |
| Under 6 | 38 (51.3%) | 34 (46.0%) |
| 6 to 18 Years | 39 (21.2%) | 131 (71.2%) |
| 19 to 25 Years | 26 (26.3%) | 62 (62.6%) |
| 25 to 34 Years | 49 (36.0%) | 81 (59.6%) |
| 35 to 44 Years | 16 (8.3%) | 180 (92.8%) |
| 45 to 54 Years | 36 (23.4%) | 104 (67.5%) |
| 55 to 64 Years | 28 (14.0%) | 178 (89.0%) |
| 65 to 74 Years | 141 (88.1%) | 140 (87.5%) |
| 75 Years and over | 87 (100.0%) | 43 (49.4%) |
| Total | 460 (35.7%) | 953 (74.0%) |
Disability Status by Sex by Age in Fairview
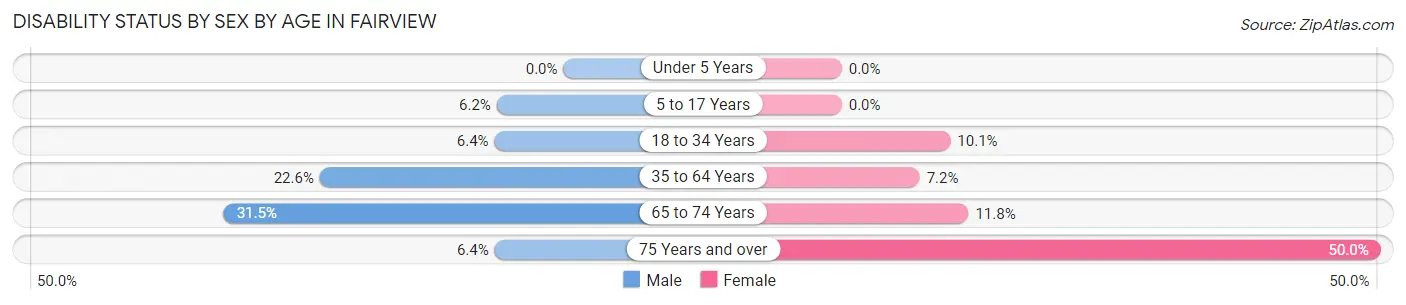
| Age Bracket | Male | Female |
| Under 5 Years | 0 (0.0%) | 0 (0.0%) |
| 5 to 17 Years | 7 (6.2%) | 0 (0.0%) |
| 18 to 34 Years | 8 (6.4%) | 13 (10.1%) |
| 35 to 64 Years | 52 (22.6%) | 23 (7.2%) |
| 65 to 74 Years | 29 (31.5%) | 8 (11.8%) |
| 75 Years and over | 3 (6.4%) | 20 (50.0%) |
Disability Class by Sex by Age in Fairview
Disability Class: Hearing Difficulty
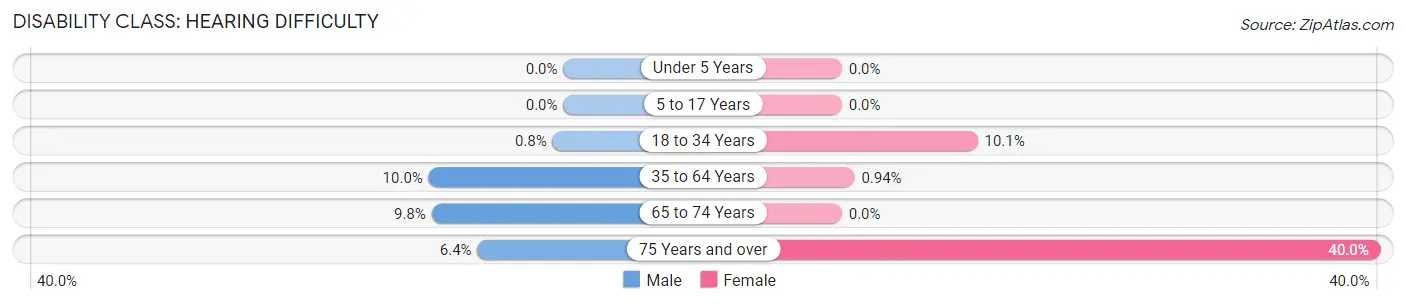
| Age Bracket | Male | Female |
| Under 5 Years | 0 (0.0%) | 0 (0.0%) |
| 5 to 17 Years | 0 (0.0%) | 0 (0.0%) |
| 18 to 34 Years | 1 (0.8%) | 13 (10.1%) |
| 35 to 64 Years | 23 (10.0%) | 3 (0.9%) |
| 65 to 74 Years | 9 (9.8%) | 0 (0.0%) |
| 75 Years and over | 3 (6.4%) | 16 (40.0%) |
Disability Class: Vision Difficulty
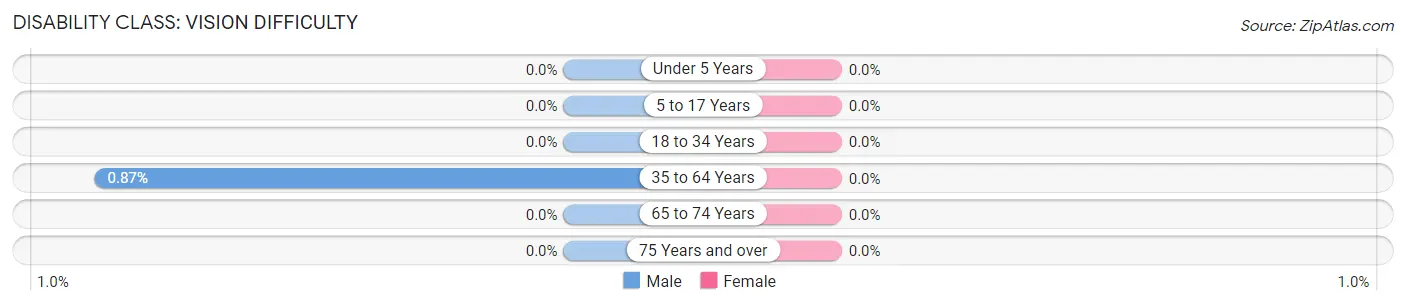
| Age Bracket | Male | Female |
| Under 5 Years | 0 (0.0%) | 0 (0.0%) |
| 5 to 17 Years | 0 (0.0%) | 0 (0.0%) |
| 18 to 34 Years | 0 (0.0%) | 0 (0.0%) |
| 35 to 64 Years | 2 (0.9%) | 0 (0.0%) |
| 65 to 74 Years | 0 (0.0%) | 0 (0.0%) |
| 75 Years and over | 0 (0.0%) | 0 (0.0%) |
Disability Class: Cognitive Difficulty
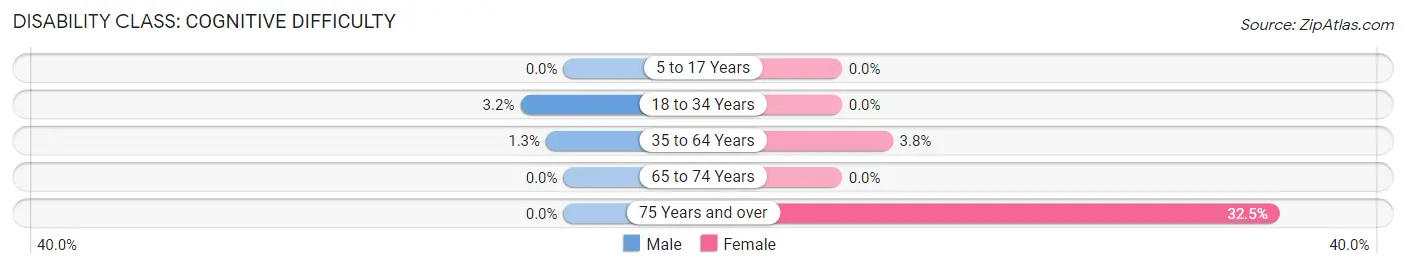
| Age Bracket | Male | Female |
| 5 to 17 Years | 0 (0.0%) | 0 (0.0%) |
| 18 to 34 Years | 4 (3.2%) | 0 (0.0%) |
| 35 to 64 Years | 3 (1.3%) | 12 (3.8%) |
| 65 to 74 Years | 0 (0.0%) | 0 (0.0%) |
| 75 Years and over | 0 (0.0%) | 13 (32.5%) |
Disability Class: Ambulatory Difficulty
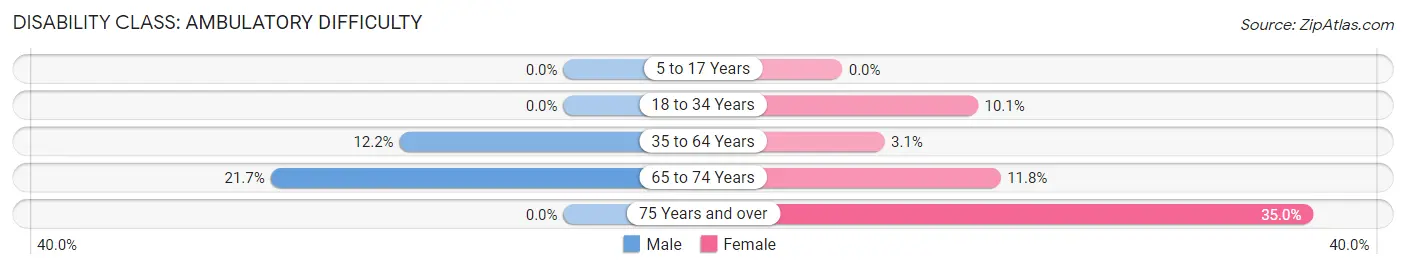
| Age Bracket | Male | Female |
| 5 to 17 Years | 0 (0.0%) | 0 (0.0%) |
| 18 to 34 Years | 0 (0.0%) | 13 (10.1%) |
| 35 to 64 Years | 28 (12.2%) | 10 (3.1%) |
| 65 to 74 Years | 20 (21.7%) | 8 (11.8%) |
| 75 Years and over | 0 (0.0%) | 14 (35.0%) |
Disability Class: Self-Care Difficulty
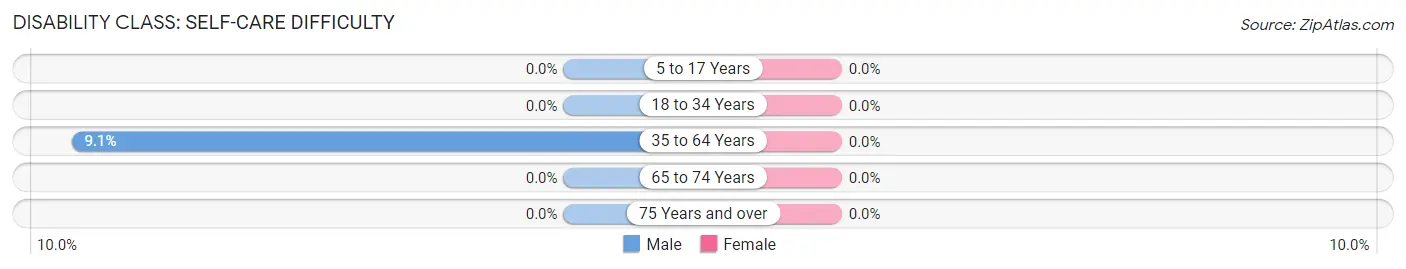
| Age Bracket | Male | Female |
| 5 to 17 Years | 0 (0.0%) | 0 (0.0%) |
| 18 to 34 Years | 0 (0.0%) | 0 (0.0%) |
| 35 to 64 Years | 21 (9.1%) | 0 (0.0%) |
| 65 to 74 Years | 0 (0.0%) | 0 (0.0%) |
| 75 Years and over | 0 (0.0%) | 0 (0.0%) |
Technology Access in Fairview
Computing Device Access in Fairview
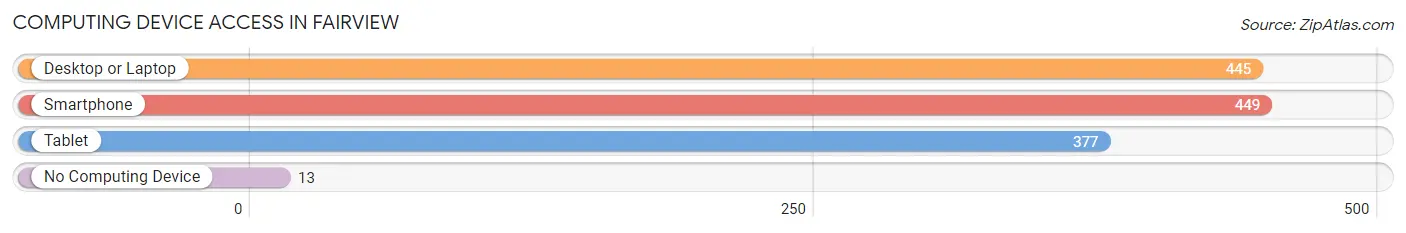
| Device Type | # Households | % Households |
| Desktop or Laptop | 445 | 91.2% |
| Smartphone | 449 | 92.0% |
| Tablet | 377 | 77.2% |
| No Computing Device | 13 | 2.7% |
| Total | 488 | 100.0% |
Internet Access in Fairview
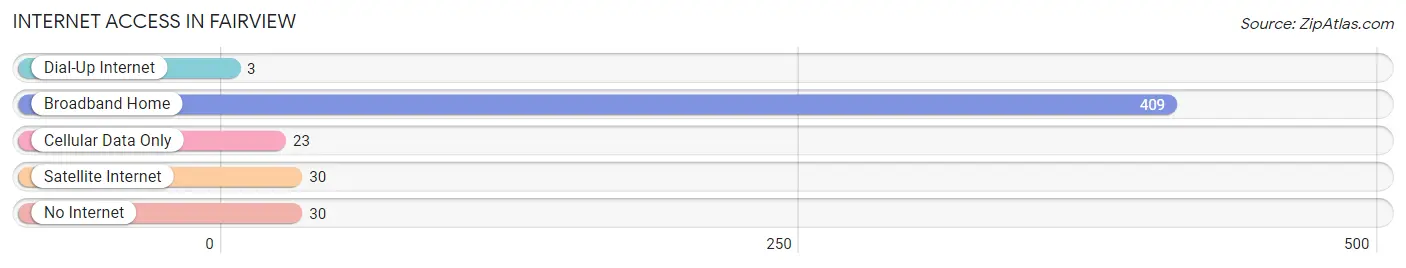
| Internet Type | # Households | % Households |
| Dial-Up Internet | 3 | 0.6% |
| Broadband Home | 409 | 83.8% |
| Cellular Data Only | 23 | 4.7% |
| Satellite Internet | 30 | 6.1% |
| No Internet | 30 | 6.1% |
| Total | 488 | 100.0% |
Fairview Summary
History
The small town of Fairview, Utah is located in Sanpete County, in the central part of the state. It is situated in a valley surrounded by the Wasatch Mountains to the east and the San Pitch Mountains to the west. The town was first settled in 1859 by a group of Mormon pioneers led by John R. Murdock. The town was originally called Murdock Valley, but was later changed to Fairview in 1877.
The town was founded on the principles of the Church of Jesus Christ of Latter-day Saints, and the majority of the population is still Mormon today. The town was an important stop on the Pony Express route, and the first post office was established in 1864. The town was also an important stop on the Union Pacific Railroad, which was completed in 1869.
The town has a rich history of agriculture, with many of the original settlers being farmers. The town was also home to a number of sawmills and other industries, including a woolen mill, a flour mill, and a brickyard.
Geography
Fairview is located in the central part of Utah, in Sanpete County. It is situated in a valley surrounded by the Wasatch Mountains to the east and the San Pitch Mountains to the west. The town is located at an elevation of 5,400 feet, and has a total area of 1.2 square miles.
The town is located in a semi-arid climate, with hot summers and cold winters. The average annual temperature is around 50 degrees Fahrenheit, and the average annual precipitation is around 12 inches.
Economy
The economy of Fairview is largely based on agriculture and tourism. The town is home to a number of farms, which produce a variety of crops, including hay, wheat, corn, and alfalfa. The town is also home to a number of tourist attractions, including the San Pitch National Forest, the San Pitch River, and the nearby ski resorts.
The town is also home to a number of small businesses, including restaurants, shops, and other services. The town is also home to a number of manufacturing companies, including a furniture factory and a plastics factory.
Demographics
As of the 2010 census, the population of Fairview was 1,845. The population is largely white (94.3%), with a small percentage of Hispanic (2.2%) and Native American (1.2%) residents. The median household income is $41,250, and the median age is 37.
The town is largely Mormon (90.3%), with a small percentage of other religious affiliations. The town is also home to a number of schools, including a public elementary school, a public middle school, and a public high school.
Common Questions
What is Per Capita Income in Fairview?
Per Capita income in Fairview is $31,363.
What is the Median Family Income in Fairview?
Median Family Income in Fairview is $61,944.
What is the Median Household income in Fairview?
Median Household Income in Fairview is $57,391.
What is Income or Wage Gap in Fairview?
Income or Wage Gap in Fairview is 30.1%.
Women in Fairview earn 69.9 cents for every dollar earned by a man.
What is Inequality or Gini Index in Fairview?
Inequality or Gini Index in Fairview is 0.43.
What is the Total Population of Fairview?
Total Population of Fairview is 1,288.
What is the Total Male Population of Fairview?
Total Male Population of Fairview is 638.
What is the Total Female Population of Fairview?
Total Female Population of Fairview is 650.
What is the Ratio of Males per 100 Females in Fairview?
There are 98.15 Males per 100 Females in Fairview.
What is the Ratio of Females per 100 Males in Fairview?
There are 101.88 Females per 100 Males in Fairview.
What is the Median Population Age in Fairview?
Median Population Age in Fairview is 44.2 Years.
What is the Average Family Size in Fairview
Average Family Size in Fairview is 3.0 People.
What is the Average Household Size in Fairview
Average Household Size in Fairview is 2.6 People.
How Large is the Labor Force in Fairview?
There are 665 People in the Labor Forcein in Fairview.
What is the Percentage of People in the Labor Force in Fairview?
62.8% of People are in the Labor Force in Fairview.
What is the Unemployment Rate in Fairview?
Unemployment Rate in Fairview is 4.1%.