East Carbon, UT Map & Demographics
East Carbon Map
East Carbon Overview
$24,561
PER CAPITA INCOME
$61,667
AVG FAMILY INCOME
$52,554
AVG HOUSEHOLD INCOME
54.4%
WAGE / INCOME GAP [ % ]
45.6¢/ $1
WAGE / INCOME GAP [ $ ]
0.38
INEQUALITY / GINI INDEX
1,441
TOTAL POPULATION
764
MALE POPULATION
677
FEMALE POPULATION
112.85
MALES / 100 FEMALES
88.61
FEMALES / 100 MALES
40.4
MEDIAN AGE
3.0
AVG FAMILY SIZE
2.5
AVG HOUSEHOLD SIZE
545
LABOR FORCE [ PEOPLE ]
48.1%
PERCENT IN LABOR FORCE
14.5%
UNEMPLOYMENT RATE
East Carbon Zip Codes
East Carbon Area Codes
Income in East Carbon
Income Overview in East Carbon
Per Capita Income in East Carbon is $24,561, while median incomes of families and households are $61,667 and $52,554 respectively.
| Characteristic | Number | Measure |
| Per Capita Income | 1,441 | $24,561 |
| Median Family Income | 414 | $61,667 |
| Mean Family Income | 414 | $65,594 |
| Median Household Income | 567 | $52,554 |
| Mean Household Income | 567 | $55,847 |
| Income Deficit | 414 | $0 |
| Wage / Income Gap (%) | 1,441 | 54.36% |
| Wage / Income Gap ($) | 1,441 | 45.64¢ per $1 |
| Gini / Inequality Index | 1,441 | 0.38 |
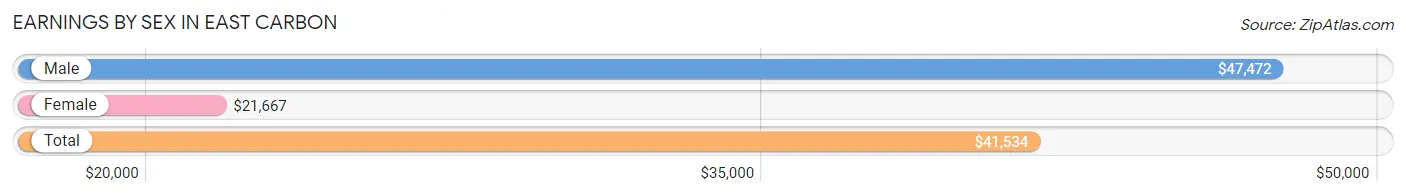
Earnings by Sex in East Carbon
Average Earnings in East Carbon are $41,534, $47,472 for men and $21,667 for women, a difference of 54.4%.
| Sex | Number | Average Earnings |
| Male | 337 (63.7%) | $47,472 |
| Female | 192 (36.3%) | $21,667 |
| Total | 529 (100.0%) | $41,534 |
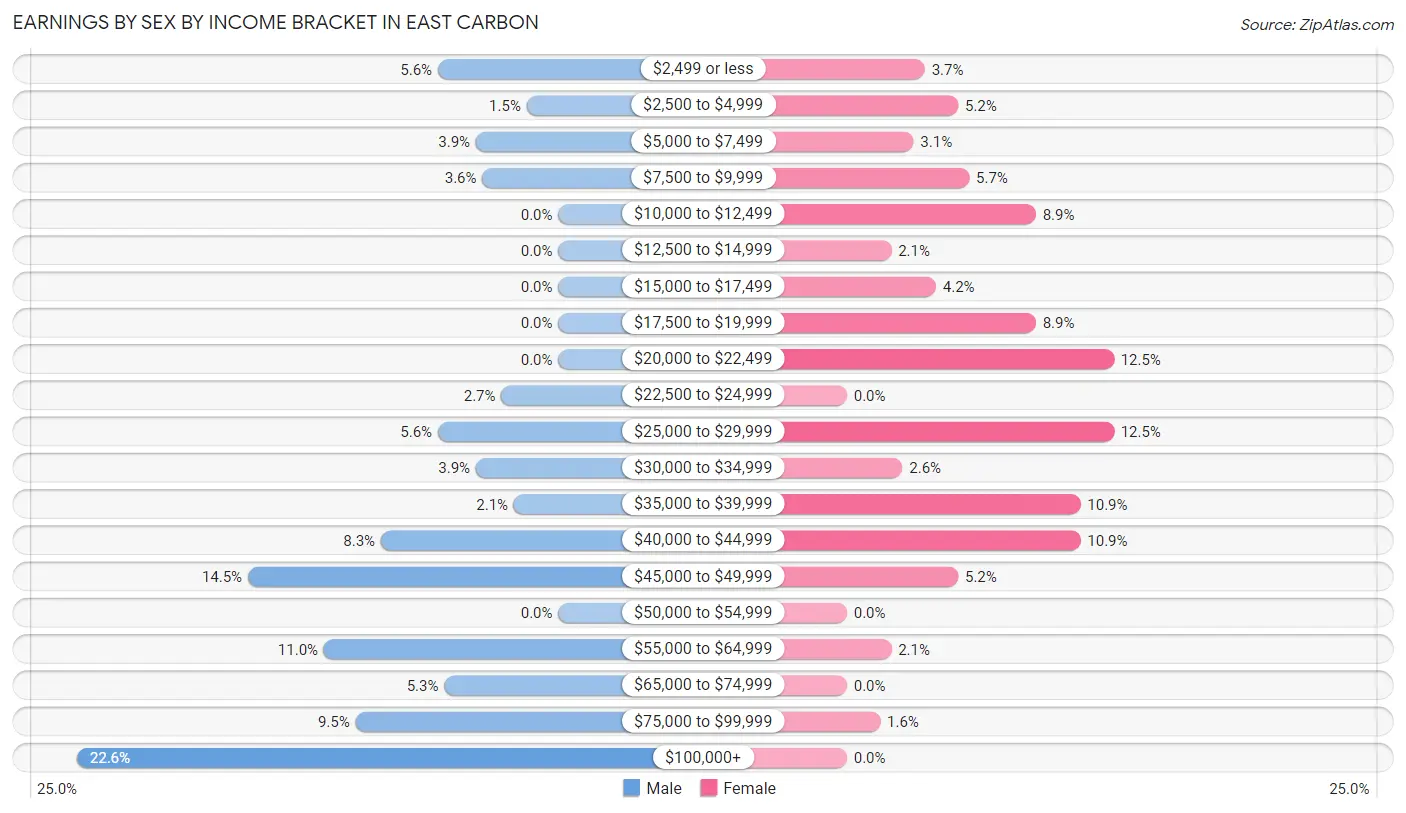
Earnings by Sex by Income Bracket in East Carbon
The most common earnings brackets in East Carbon are $100,000+ for men (76 | 22.6%) and $20,000 to $22,499 for women (24 | 12.5%).
| Income | Male | Female |
| $2,499 or less | 19 (5.6%) | 7 (3.6%) |
| $2,500 to $4,999 | 5 (1.5%) | 10 (5.2%) |
| $5,000 to $7,499 | 13 (3.9%) | 6 (3.1%) |
| $7,500 to $9,999 | 12 (3.6%) | 11 (5.7%) |
| $10,000 to $12,499 | 0 (0.0%) | 17 (8.8%) |
| $12,500 to $14,999 | 0 (0.0%) | 4 (2.1%) |
| $15,000 to $17,499 | 0 (0.0%) | 8 (4.2%) |
| $17,500 to $19,999 | 0 (0.0%) | 17 (8.8%) |
| $20,000 to $22,499 | 0 (0.0%) | 24 (12.5%) |
| $22,500 to $24,999 | 9 (2.7%) | 0 (0.0%) |
| $25,000 to $29,999 | 19 (5.6%) | 24 (12.5%) |
| $30,000 to $34,999 | 13 (3.9%) | 5 (2.6%) |
| $35,000 to $39,999 | 7 (2.1%) | 21 (10.9%) |
| $40,000 to $44,999 | 28 (8.3%) | 21 (10.9%) |
| $45,000 to $49,999 | 49 (14.5%) | 10 (5.2%) |
| $50,000 to $54,999 | 0 (0.0%) | 0 (0.0%) |
| $55,000 to $64,999 | 37 (11.0%) | 4 (2.1%) |
| $65,000 to $74,999 | 18 (5.3%) | 0 (0.0%) |
| $75,000 to $99,999 | 32 (9.5%) | 3 (1.6%) |
| $100,000+ | 76 (22.6%) | 0 (0.0%) |
| Total | 337 (100.0%) | 192 (100.0%) |
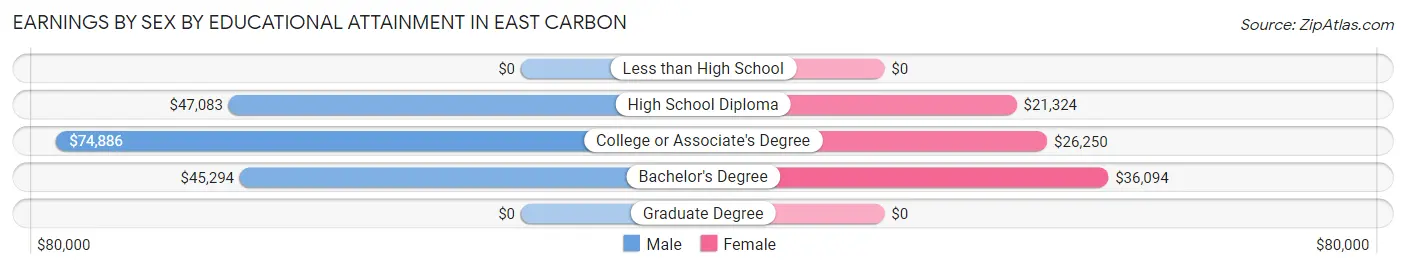
Earnings by Sex by Educational Attainment in East Carbon
Average earnings in East Carbon are $47,386 for men and $22,188 for women, a difference of 53.2%. Men with an educational attainment of college or associate's degree enjoy the highest average annual earnings of $74,886, while those with bachelor's degree education earn the least with $45,294. Women with an educational attainment of bachelor's degree earn the most with the average annual earnings of $36,094, while those with high school diploma education have the smallest earnings of $21,324.
| Educational Attainment | Male Income | Female Income |
| Less than High School | - | - |
| High School Diploma | $47,083 | $21,324 |
| College or Associate's Degree | $74,886 | $26,250 |
| Bachelor's Degree | $45,294 | $36,094 |
| Graduate Degree | - | - |
| Total | $47,386 | $22,188 |
Family Income in East Carbon
Family Income Brackets in East Carbon
According to the East Carbon family income data, there are 106 families falling into the $75,000 to $99,999 income range, which is the most common income bracket and makes up 25.6% of all families.
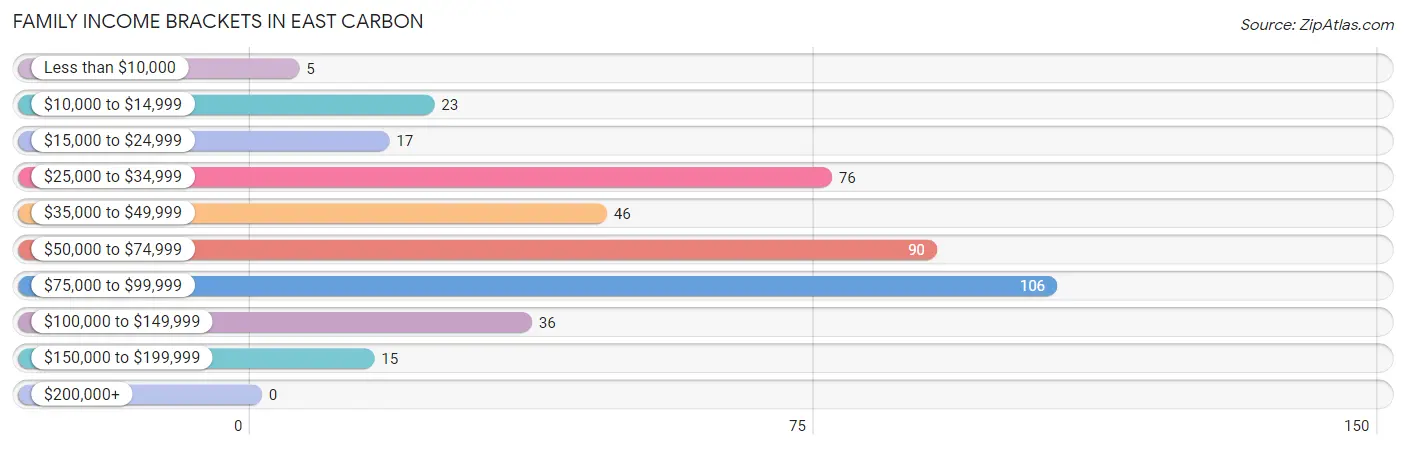
| Income Bracket | # Families | % Families |
| Less than $10,000 | 5 | 1.2% |
| $10,000 to $14,999 | 23 | 5.6% |
| $15,000 to $24,999 | 17 | 4.1% |
| $25,000 to $34,999 | 76 | 18.4% |
| $35,000 to $49,999 | 46 | 11.1% |
| $50,000 to $74,999 | 90 | 21.7% |
| $75,000 to $99,999 | 106 | 25.6% |
| $100,000 to $149,999 | 36 | 8.7% |
| $150,000 to $199,999 | 15 | 3.6% |
| $200,000+ | 0 | 0.0% |
Family Income by Famaliy Size in East Carbon
5-person families (22 | 5.3%) account for the highest median family income in East Carbon with $91,250 per family, while 2-person families (200 | 48.3%) have the highest median income of $31,875 per family member.
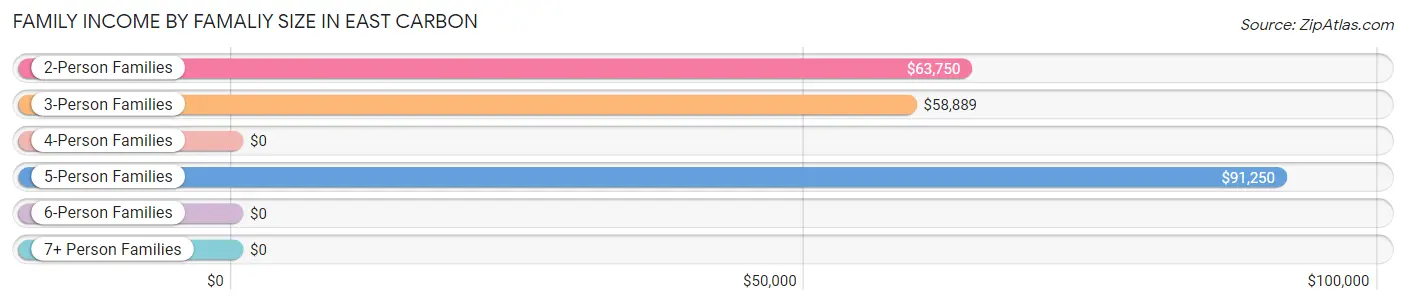
| Income Bracket | # Families | Median Income |
| 2-Person Families | 200 (48.3%) | $63,750 |
| 3-Person Families | 120 (29.0%) | $58,889 |
| 4-Person Families | 53 (12.8%) | $0 |
| 5-Person Families | 22 (5.3%) | $91,250 |
| 6-Person Families | 6 (1.5%) | $0 |
| 7+ Person Families | 13 (3.1%) | $0 |
| Total | 414 (100.0%) | $61,667 |
Family Income by Number of Earners in East Carbon
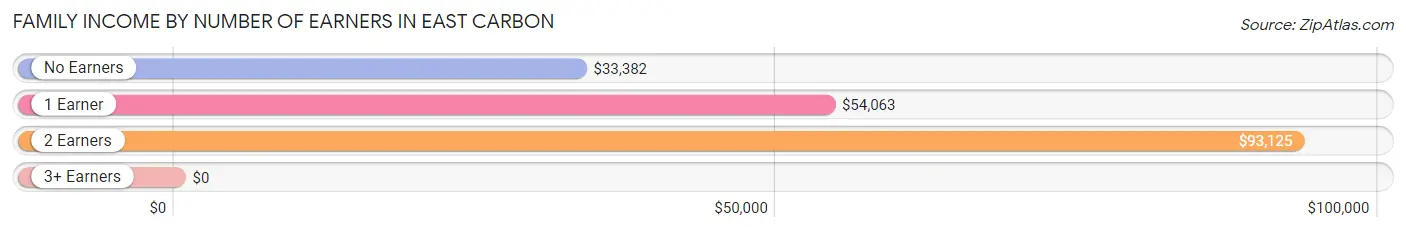
| Number of Earners | # Families | Median Income |
| No Earners | 150 (36.2%) | $33,382 |
| 1 Earner | 135 (32.6%) | $54,063 |
| 2 Earners | 107 (25.9%) | $93,125 |
| 3+ Earners | 22 (5.3%) | $0 |
| Total | 414 (100.0%) | $61,667 |
Household Income in East Carbon
Household Income Brackets in East Carbon
With 122 households falling in the category, the $50,000 to $74,999 income range is the most frequent in East Carbon, accounting for 21.5% of all households.
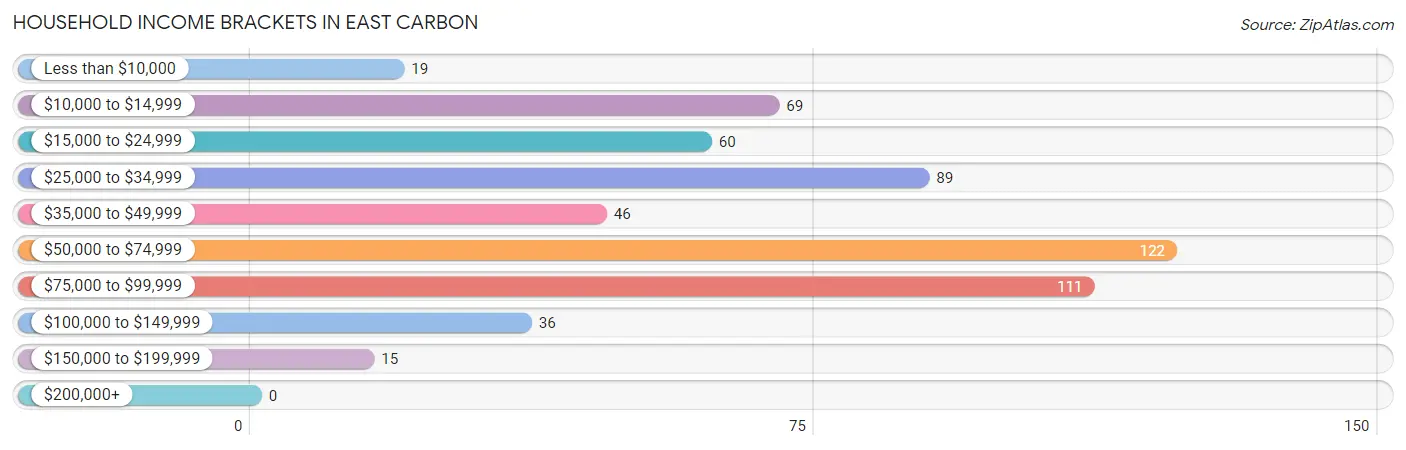
| Income Bracket | # Households | % Households |
| Less than $10,000 | 19 | 3.4% |
| $10,000 to $14,999 | 69 | 12.2% |
| $15,000 to $24,999 | 60 | 10.6% |
| $25,000 to $34,999 | 89 | 15.7% |
| $35,000 to $49,999 | 46 | 8.1% |
| $50,000 to $74,999 | 122 | 21.5% |
| $75,000 to $99,999 | 111 | 19.6% |
| $100,000 to $149,999 | 36 | 6.3% |
| $150,000 to $199,999 | 15 | 2.6% |
| $200,000+ | 0 | 0.0% |
Household Income by Householder Age in East Carbon
The median household income in East Carbon is $52,554, with the highest median household income of $53,207 found in the 65+ years age bracket for the primary householder. A total of 227 households (40.0%) fall into this category. Meanwhile, the 15 to 24 years age bracket for the primary householder has the lowest median household income of $0, with 23 households (4.1%) in this group.
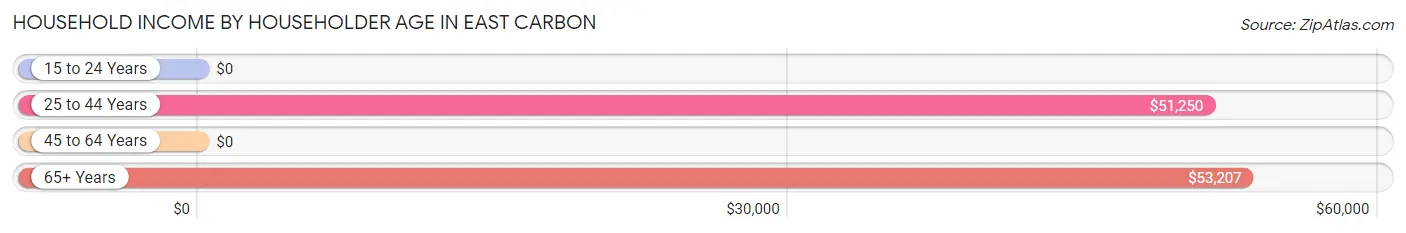
| Income Bracket | # Households | Median Income |
| 15 to 24 Years | 23 (4.1%) | $0 |
| 25 to 44 Years | 182 (32.1%) | $51,250 |
| 45 to 64 Years | 135 (23.8%) | $0 |
| 65+ Years | 227 (40.0%) | $53,207 |
| Total | 567 (100.0%) | $52,554 |
Poverty in East Carbon
Income Below Poverty by Sex and Age in East Carbon
With 19.5% poverty level for males and 22.4% for females among the residents of East Carbon, 25 to 34 year old males and 15 year old females are the most vulnerable to poverty, with 71 males (53.4%) and 11 females (78.6%) in their respective age groups living below the poverty level.
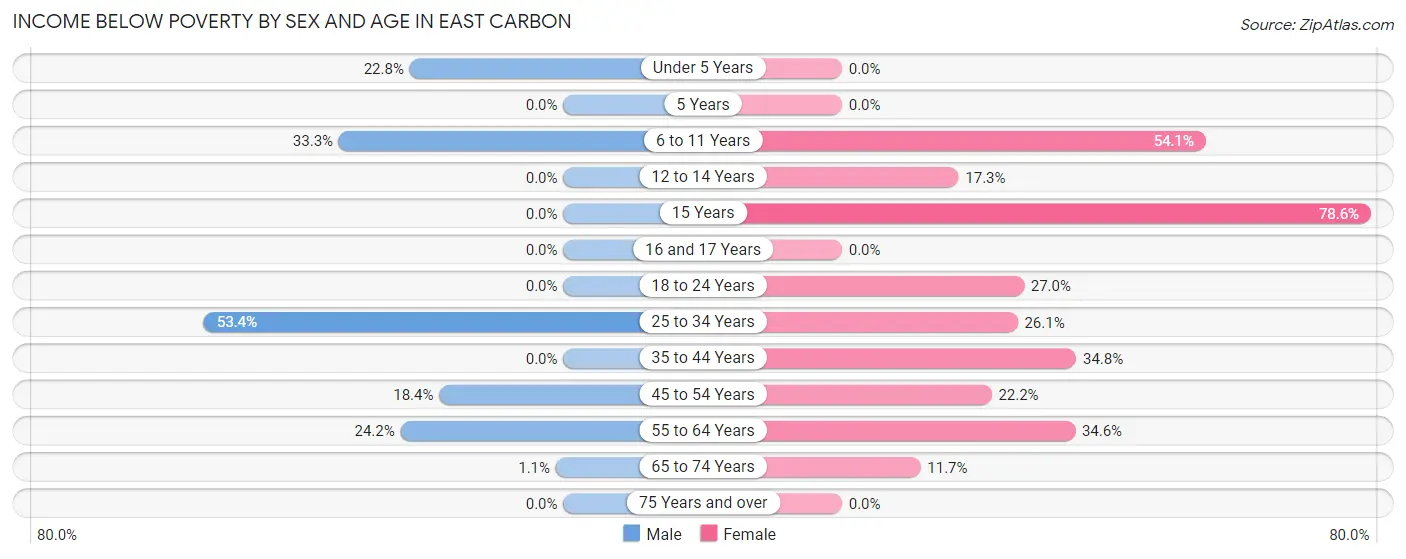
| Age Bracket | Male | Female |
| Under 5 Years | 13 (22.8%) | 0 (0.0%) |
| 5 Years | 0 (0.0%) | 0 (0.0%) |
| 6 to 11 Years | 21 (33.3%) | 20 (54.0%) |
| 12 to 14 Years | 0 (0.0%) | 9 (17.3%) |
| 15 Years | 0 (0.0%) | 11 (78.6%) |
| 16 and 17 Years | 0 (0.0%) | 0 (0.0%) |
| 18 to 24 Years | 0 (0.0%) | 10 (27.0%) |
| 25 to 34 Years | 71 (53.4%) | 24 (26.1%) |
| 35 to 44 Years | 0 (0.0%) | 24 (34.8%) |
| 45 to 54 Years | 21 (18.4%) | 12 (22.2%) |
| 55 to 64 Years | 22 (24.2%) | 27 (34.6%) |
| 65 to 74 Years | 1 (1.1%) | 14 (11.7%) |
| 75 Years and over | 0 (0.0%) | 0 (0.0%) |
| Total | 149 (19.5%) | 151 (22.4%) |
Income Above Poverty by Sex and Age in East Carbon
According to the poverty statistics in East Carbon, males aged 5 years and females aged under 5 years are the age groups that are most secure financially, with 100.0% of males and 100.0% of females in these age groups living above the poverty line.
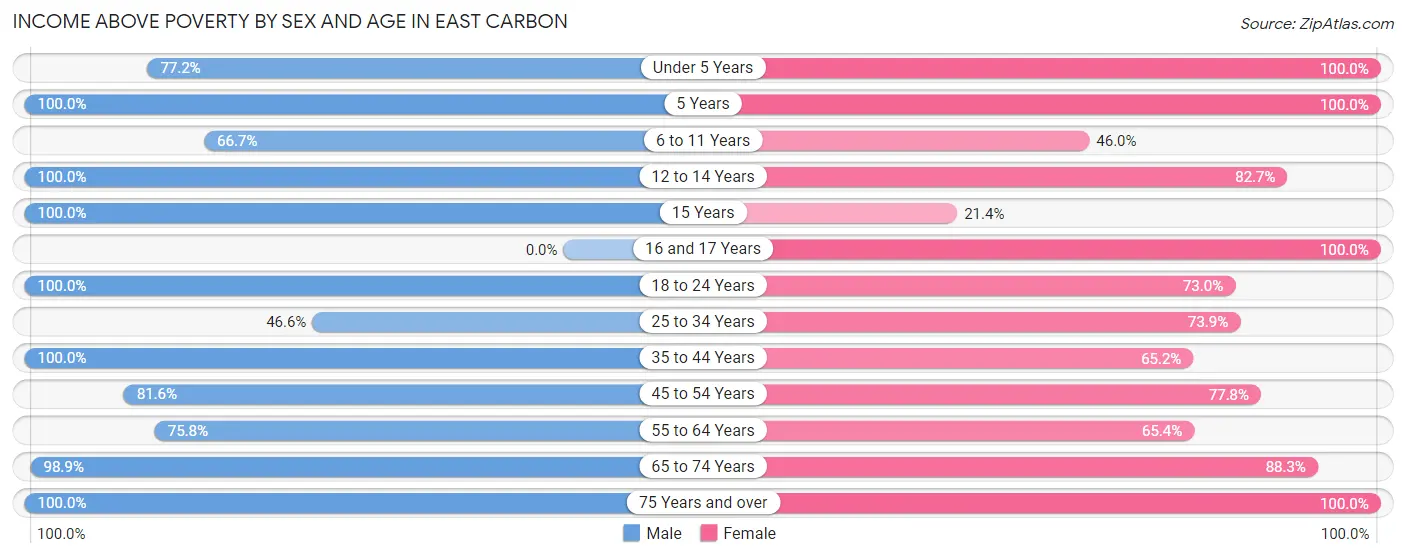
| Age Bracket | Male | Female |
| Under 5 Years | 44 (77.2%) | 20 (100.0%) |
| 5 Years | 9 (100.0%) | 9 (100.0%) |
| 6 to 11 Years | 42 (66.7%) | 17 (46.0%) |
| 12 to 14 Years | 37 (100.0%) | 43 (82.7%) |
| 15 Years | 7 (100.0%) | 3 (21.4%) |
| 16 and 17 Years | 0 (0.0%) | 9 (100.0%) |
| 18 to 24 Years | 43 (100.0%) | 27 (73.0%) |
| 25 to 34 Years | 62 (46.6%) | 68 (73.9%) |
| 35 to 44 Years | 67 (100.0%) | 45 (65.2%) |
| 45 to 54 Years | 93 (81.6%) | 42 (77.8%) |
| 55 to 64 Years | 69 (75.8%) | 51 (65.4%) |
| 65 to 74 Years | 89 (98.9%) | 106 (88.3%) |
| 75 Years and over | 53 (100.0%) | 83 (100.0%) |
| Total | 615 (80.5%) | 523 (77.6%) |
Income Below Poverty Among Married-Couple Families in East Carbon
The poverty statistics for married-couple families in East Carbon show that 4.7% or 16 of the total 342 families live below the poverty line. Families with 3 or 4 children have the highest poverty rate of 26.1%, comprising of 6 families. On the other hand, families with no children have the lowest poverty rate of 0.0%, which includes 0 families.
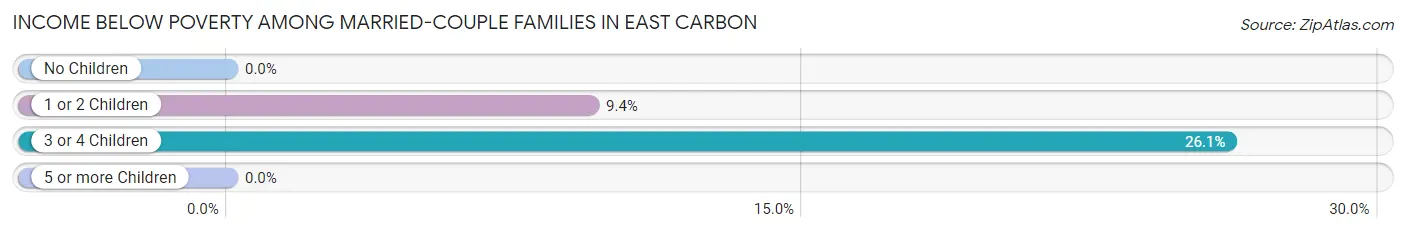
| Children | Above Poverty | Below Poverty |
| No Children | 211 (100.0%) | 0 (0.0%) |
| 1 or 2 Children | 96 (90.6%) | 10 (9.4%) |
| 3 or 4 Children | 17 (73.9%) | 6 (26.1%) |
| 5 or more Children | 2 (100.0%) | 0 (0.0%) |
| Total | 326 (95.3%) | 16 (4.7%) |
Income Below Poverty Among Single-Parent Households in East Carbon
According to the poverty data in East Carbon, 27.8% or 5 single-father households and 24.1% or 13 single-mother households are living below the poverty line. Among single-father households, those with no children have the highest poverty rate, with 5 households (100.0%) experiencing poverty. Likewise, among single-mother households, those with 3 or 4 children have the highest poverty rate, with 13 households (100.0%) falling below the poverty line.
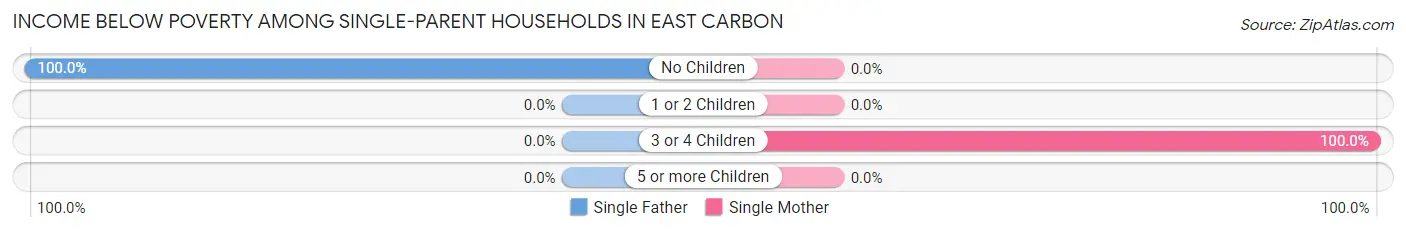
| Children | Single Father | Single Mother |
| No Children | 5 (100.0%) | 0 (0.0%) |
| 1 or 2 Children | 0 (0.0%) | 0 (0.0%) |
| 3 or 4 Children | 0 (0.0%) | 13 (100.0%) |
| 5 or more Children | 0 (0.0%) | 0 (0.0%) |
| Total | 5 (27.8%) | 13 (24.1%) |
Income Below Poverty Among Married-Couple vs Single-Parent Households in East Carbon
The poverty data for East Carbon shows that 16 of the married-couple family households (4.7%) and 18 of the single-parent households (25.0%) are living below the poverty level. Within the married-couple family households, those with 3 or 4 children have the highest poverty rate, with 6 households (26.1%) falling below the poverty line. Among the single-parent households, those with 3 or 4 children have the highest poverty rate, with 13 household (100.0%) living below poverty.
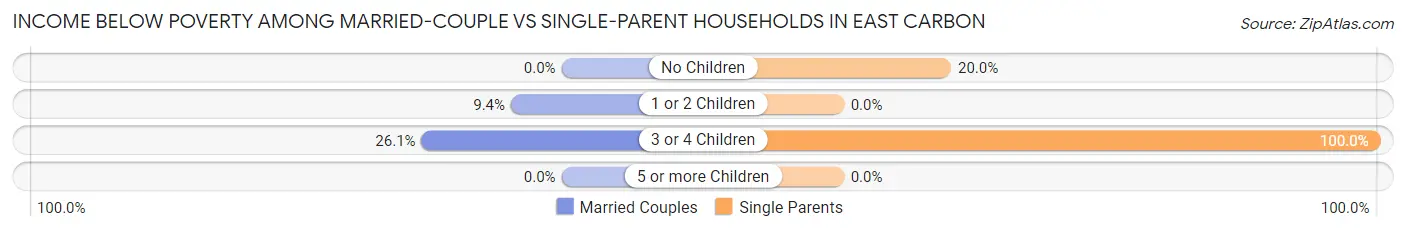
| Children | Married-Couple Families | Single-Parent Households |
| No Children | 0 (0.0%) | 5 (20.0%) |
| 1 or 2 Children | 10 (9.4%) | 0 (0.0%) |
| 3 or 4 Children | 6 (26.1%) | 13 (100.0%) |
| 5 or more Children | 0 (0.0%) | 0 (0.0%) |
| Total | 16 (4.7%) | 18 (25.0%) |
Race in East Carbon
The most populous races in East Carbon are White / Caucasian (1,355 | 94.0%), Hispanic or Latino (236 | 16.4%), and Two or more Races (57 | 4.0%).
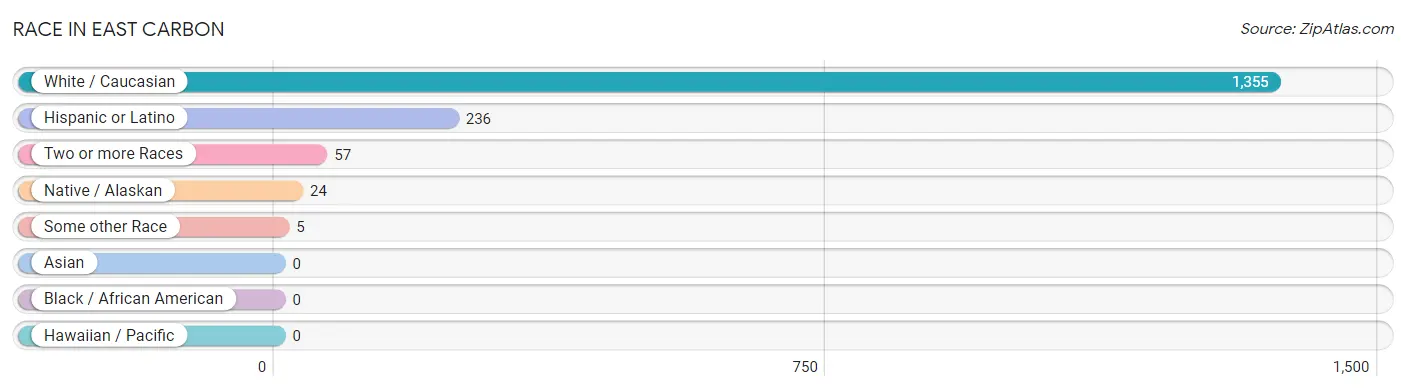
| Race | # Population | % Population |
| Asian | 0 | 0.0% |
| Black / African American | 0 | 0.0% |
| Hawaiian / Pacific | 0 | 0.0% |
| Hispanic or Latino | 236 | 16.4% |
| Native / Alaskan | 24 | 1.7% |
| White / Caucasian | 1,355 | 94.0% |
| Two or more Races | 57 | 4.0% |
| Some other Race | 5 | 0.4% |
| Total | 1,441 | 100.0% |
Ancestry in East Carbon
The most populous ancestries reported in East Carbon are English (254 | 17.6%), Mexican (193 | 13.4%), Irish (153 | 10.6%), German (145 | 10.1%), and Swedish (108 | 7.5%), together accounting for 59.2% of all East Carbon residents.
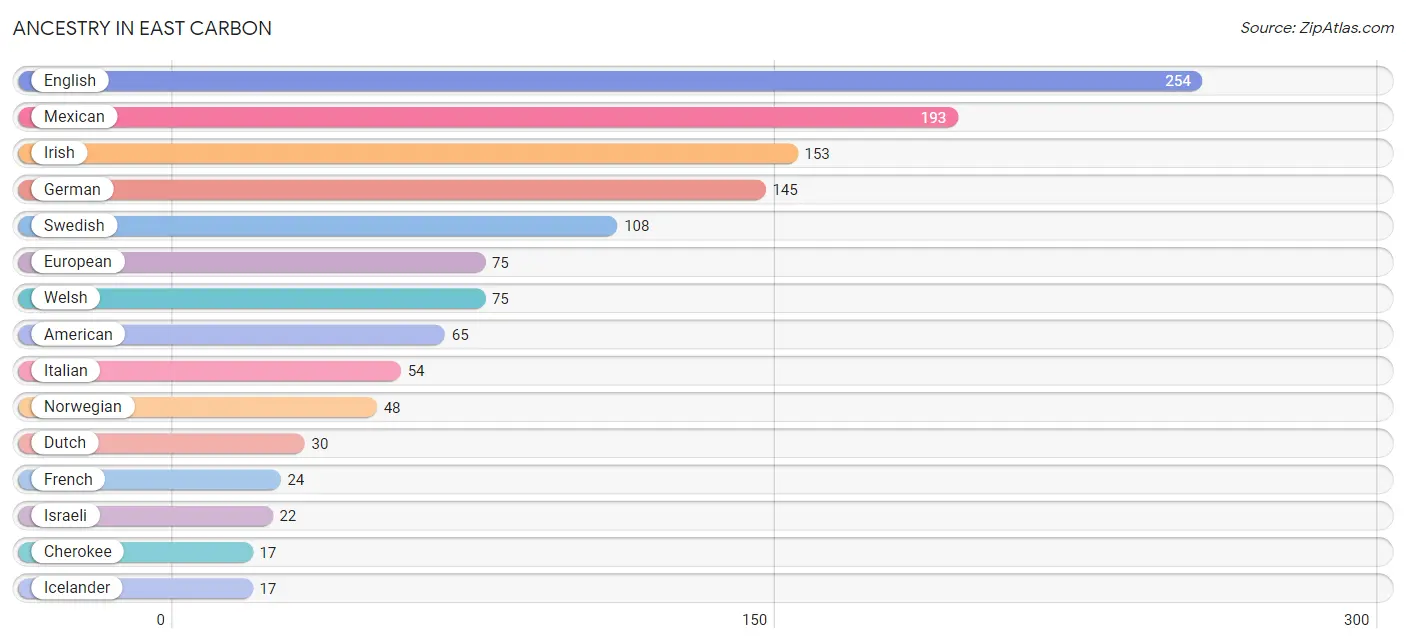
| Ancestry | # Population | % Population |
| American | 65 | 4.5% |
| Apache | 4 | 0.3% |
| Cherokee | 17 | 1.2% |
| Colombian | 2 | 0.1% |
| Danish | 11 | 0.8% |
| Dutch | 30 | 2.1% |
| English | 254 | 17.6% |
| European | 75 | 5.2% |
| French | 24 | 1.7% |
| German | 145 | 10.1% |
| Greek | 12 | 0.8% |
| Icelander | 17 | 1.2% |
| Irish | 153 | 10.6% |
| Israeli | 22 | 1.5% |
| Italian | 54 | 3.7% |
| Mexican | 193 | 13.4% |
| Norwegian | 48 | 3.3% |
| Scandinavian | 8 | 0.6% |
| Scotch-Irish | 7 | 0.5% |
| Scottish | 5 | 0.4% |
| Slovene | 5 | 0.4% |
| South American | 2 | 0.1% |
| Spaniard | 3 | 0.2% |
| Swedish | 108 | 7.5% |
| Welsh | 75 | 5.2% |
| Yugoslavian | 13 | 0.9% | View All 26 Rows |
Immigrants in East Carbon

| Immigration Origin | # Population | % Population | View All 0 Rows |
Sex and Age in East Carbon
Sex and Age in East Carbon
The most populous age groups in East Carbon are 30 to 34 Years (92 | 12.0%) for men and 10 to 14 Years (77 | 11.4%) for women.
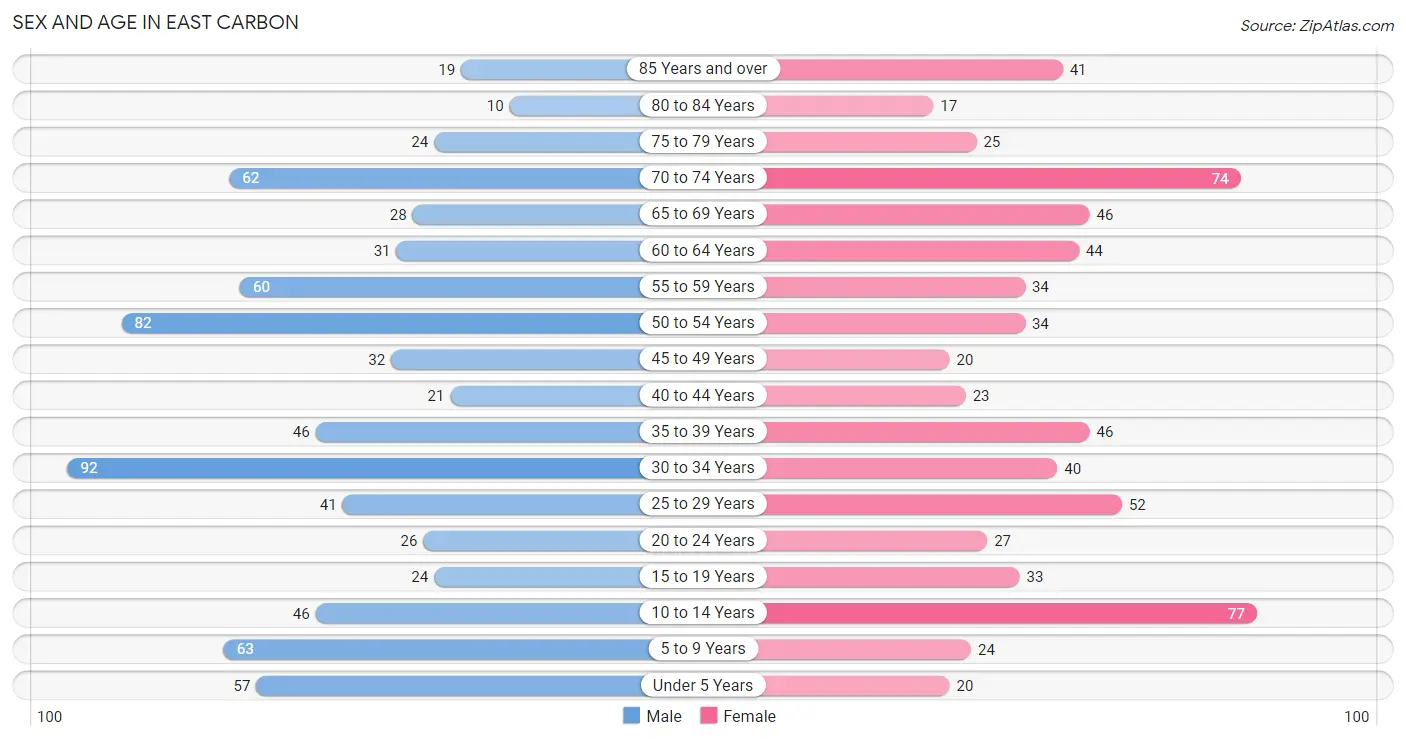
| Age Bracket | Male | Female |
| Under 5 Years | 57 (7.5%) | 20 (2.9%) |
| 5 to 9 Years | 63 (8.3%) | 24 (3.5%) |
| 10 to 14 Years | 46 (6.0%) | 77 (11.4%) |
| 15 to 19 Years | 24 (3.1%) | 33 (4.9%) |
| 20 to 24 Years | 26 (3.4%) | 27 (4.0%) |
| 25 to 29 Years | 41 (5.4%) | 52 (7.7%) |
| 30 to 34 Years | 92 (12.0%) | 40 (5.9%) |
| 35 to 39 Years | 46 (6.0%) | 46 (6.8%) |
| 40 to 44 Years | 21 (2.8%) | 23 (3.4%) |
| 45 to 49 Years | 32 (4.2%) | 20 (2.9%) |
| 50 to 54 Years | 82 (10.7%) | 34 (5.0%) |
| 55 to 59 Years | 60 (7.9%) | 34 (5.0%) |
| 60 to 64 Years | 31 (4.1%) | 44 (6.5%) |
| 65 to 69 Years | 28 (3.7%) | 46 (6.8%) |
| 70 to 74 Years | 62 (8.1%) | 74 (10.9%) |
| 75 to 79 Years | 24 (3.1%) | 25 (3.7%) |
| 80 to 84 Years | 10 (1.3%) | 17 (2.5%) |
| 85 Years and over | 19 (2.5%) | 41 (6.1%) |
| Total | 764 (100.0%) | 677 (100.0%) |
Families and Households in East Carbon
Median Family Size in East Carbon
The median family size in East Carbon is 2.97 persons per family, with single male/father families (18 | 4.3%) accounting for the largest median family size of 4.33 persons per family. On the other hand, married-couple families (342 | 82.6%) represent the smallest median family size with 2.83 persons per family.
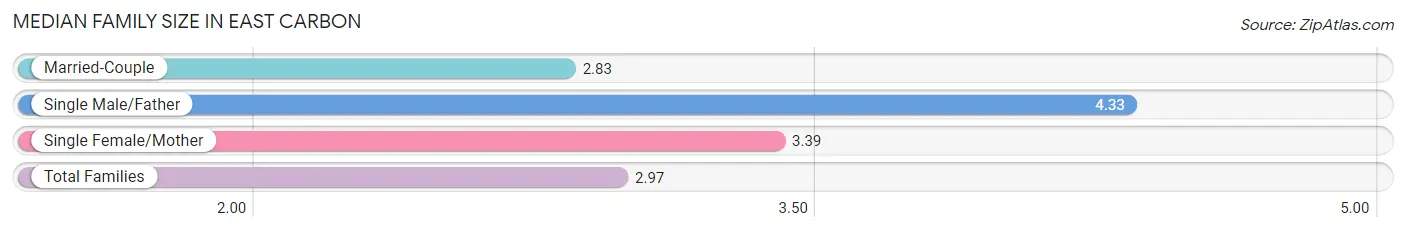
| Family Type | # Families | Family Size |
| Married-Couple | 342 (82.6%) | 2.83 |
| Single Male/Father | 18 (4.3%) | 4.33 |
| Single Female/Mother | 54 (13.0%) | 3.39 |
| Total Families | 414 (100.0%) | 2.97 |
Median Household Size in East Carbon
The median household size in East Carbon is 2.54 persons per household, with single male/father households (18 | 3.2%) accounting for the largest median household size of 4.33 persons per household. non-family households (153 | 27.0%) represent the smallest median household size with 1.25 persons per household.
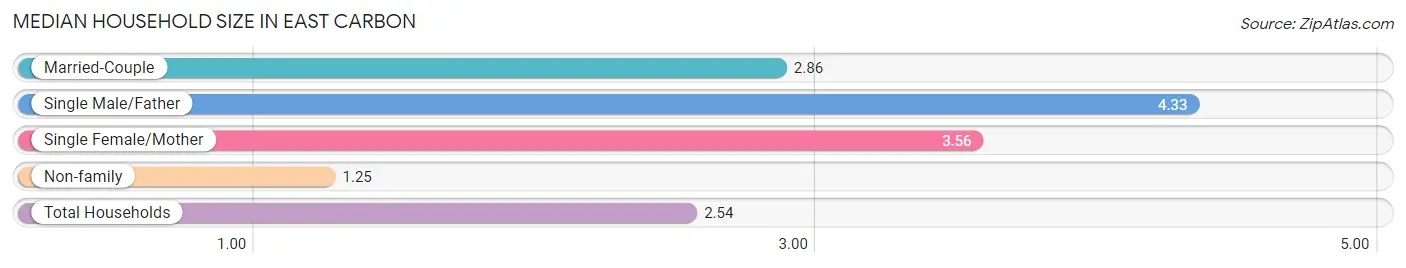
| Household Type | # Households | Household Size |
| Married-Couple | 342 (60.3%) | 2.86 |
| Single Male/Father | 18 (3.2%) | 4.33 |
| Single Female/Mother | 54 (9.5%) | 3.56 |
| Non-family | 153 (27.0%) | 1.25 |
| Total Households | 567 (100.0%) | 2.54 |
Household Size by Marriage Status in East Carbon
Out of a total of 567 households in East Carbon, 414 (73.0%) are family households, while 153 (27.0%) are nonfamily households. The most numerous type of family households are 2-person households, comprising 192, and the most common type of nonfamily households are 1-person households, comprising 103.
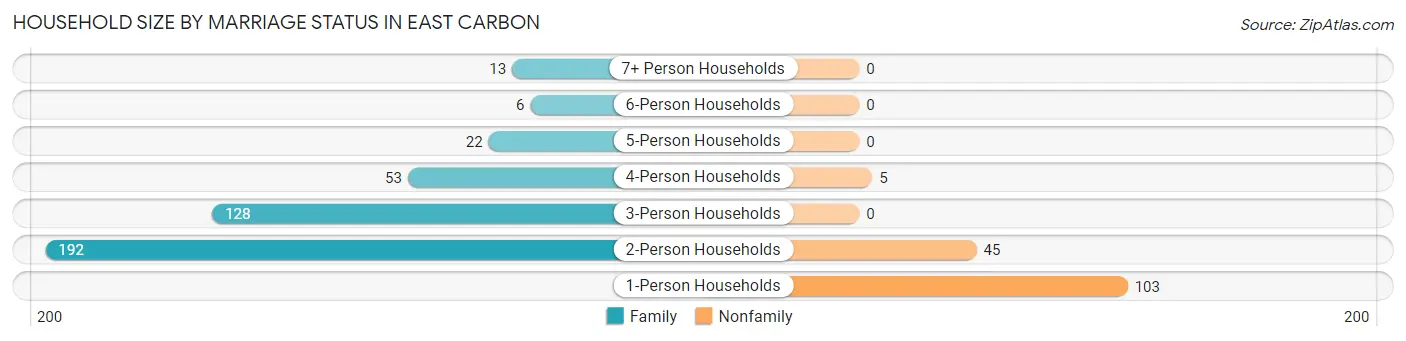
| Household Size | Family Households | Nonfamily Households |
| 1-Person Households | - | 103 (18.2%) |
| 2-Person Households | 192 (33.9%) | 45 (7.9%) |
| 3-Person Households | 128 (22.6%) | 0 (0.0%) |
| 4-Person Households | 53 (9.3%) | 5 (0.9%) |
| 5-Person Households | 22 (3.9%) | 0 (0.0%) |
| 6-Person Households | 6 (1.1%) | 0 (0.0%) |
| 7+ Person Households | 13 (2.3%) | 0 (0.0%) |
| Total | 414 (73.0%) | 153 (27.0%) |
Female Fertility in East Carbon
Fertility by Age in East Carbon
Average fertility rate in East Carbon is 36.0 births per 1,000 women. Women in the age bracket of 35 to 50 years have the highest fertility rate with 94.0 births per 1,000 women. Women in the age bracket of 35 to 50 years acount for 100.0% of all women with births.
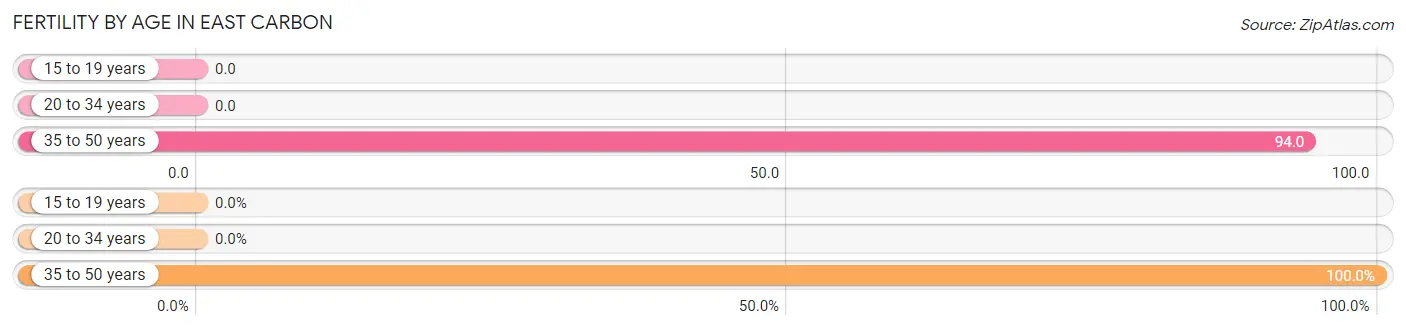
| Age Bracket | Women with Births | Births / 1,000 Women |
| 15 to 19 years | 0 (0.0%) | 0.0 |
| 20 to 34 years | 0 (0.0%) | 0.0 |
| 35 to 50 years | 9 (100.0%) | 94.0 |
| Total | 9 (100.0%) | 36.0 |
Fertility by Age by Marriage Status in East Carbon
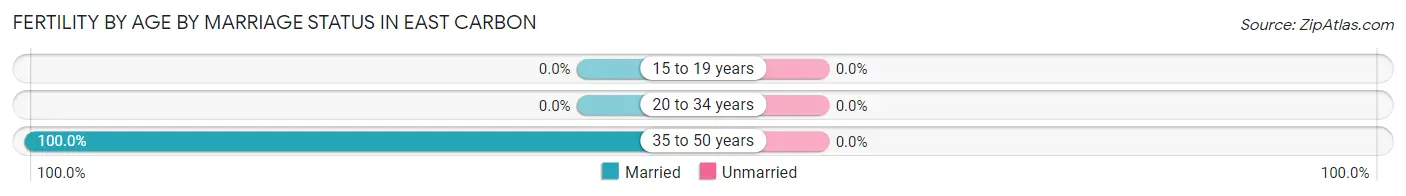
| Age Bracket | Married | Unmarried |
| 15 to 19 years | 0 (0.0%) | 0 (0.0%) |
| 20 to 34 years | 0 (0.0%) | 0 (0.0%) |
| 35 to 50 years | 9 (100.0%) | 0 (0.0%) |
| Total | 9 (100.0%) | 0 (0.0%) |
Fertility by Education in East Carbon
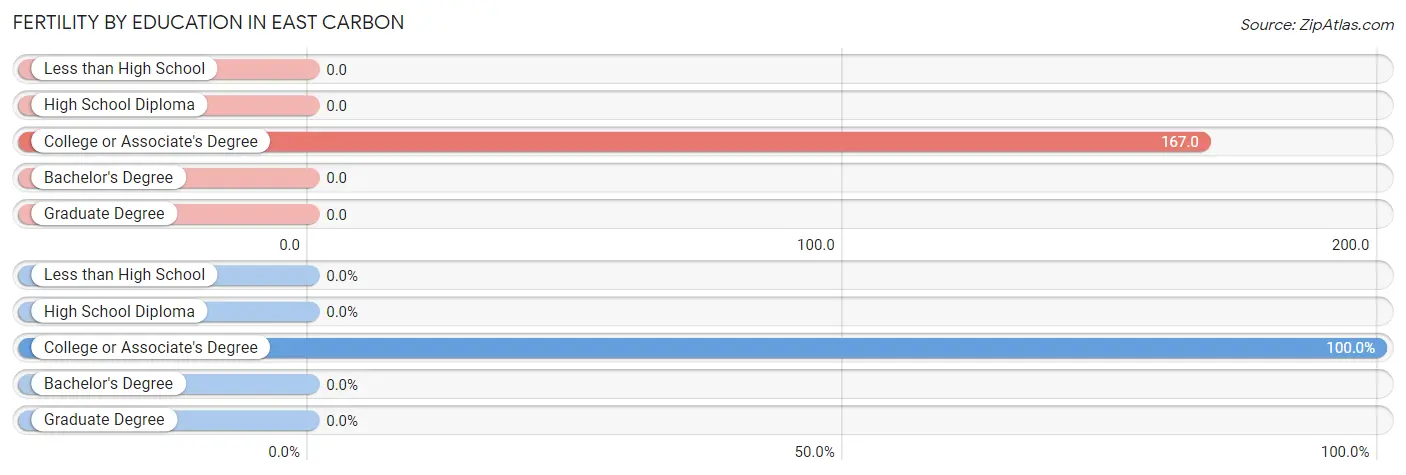
| Educational Attainment | Women with Births | Births / 1,000 Women |
| Less than High School | 0 (0.0%) | 0.0 |
| High School Diploma | 0 (0.0%) | 0.0 |
| College or Associate's Degree | 9 (100.0%) | 167.0 |
| Bachelor's Degree | 0 (0.0%) | 0.0 |
| Graduate Degree | 0 (0.0%) | 0.0 |
| Total | 9 (100.0%) | 36.0 |
Fertility by Education by Marriage Status in East Carbon
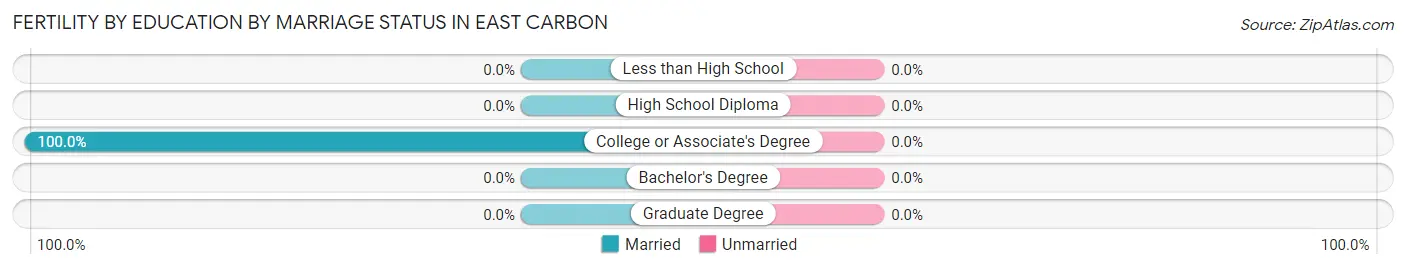
| Educational Attainment | Married | Unmarried |
| Less than High School | 0 (0.0%) | 0 (0.0%) |
| High School Diploma | 0 (0.0%) | 0 (0.0%) |
| College or Associate's Degree | 9 (100.0%) | 0 (0.0%) |
| Bachelor's Degree | 0 (0.0%) | 0 (0.0%) |
| Graduate Degree | 0 (0.0%) | 0 (0.0%) |
| Total | 9 (100.0%) | 0 (0.0%) |
Employment Characteristics in East Carbon
Employment by Class of Employer in East Carbon
Among the 446 employed individuals in East Carbon, private company employees (338 | 75.8%), federal government employees (39 | 8.7%), and self-employed (not incorporated) (25 | 5.6%) make up the most common classes of employment.
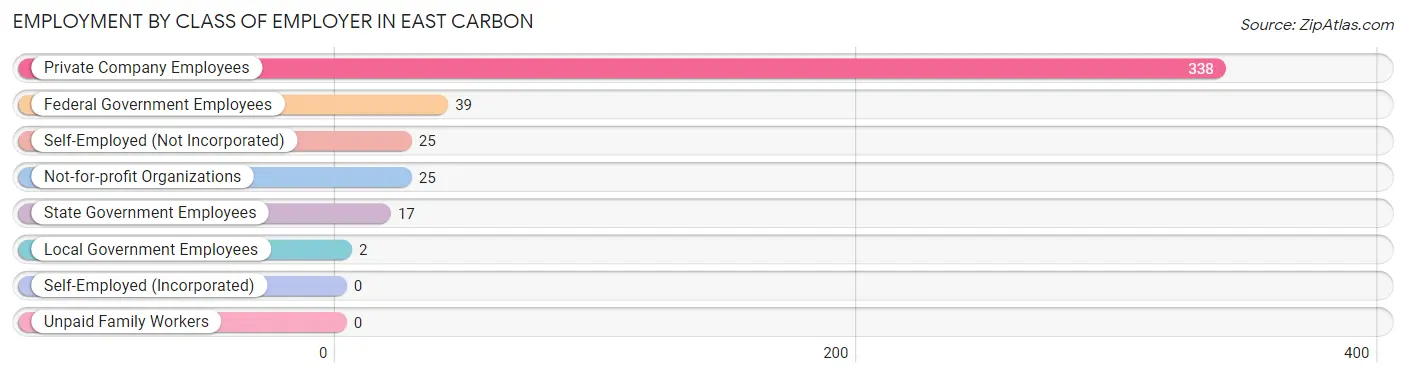
| Employer Class | # Employees | % Employees |
| Private Company Employees | 338 | 75.8% |
| Self-Employed (Incorporated) | 0 | 0.0% |
| Self-Employed (Not Incorporated) | 25 | 5.6% |
| Not-for-profit Organizations | 25 | 5.6% |
| Local Government Employees | 2 | 0.4% |
| State Government Employees | 17 | 3.8% |
| Federal Government Employees | 39 | 8.7% |
| Unpaid Family Workers | 0 | 0.0% |
| Total | 446 | 100.0% |
Employment Status by Age in East Carbon
According to the labor force statistics for East Carbon, out of the total population over 16 years of age (1,133), 48.1% or 545 individuals are in the labor force, with 14.5% or 79 of them unemployed. The age group with the highest labor force participation rate is 20 to 24 years, with 100.0% or 53 individuals in the labor force. Within the labor force, the 16 to 19 years age range has the highest percentage of unemployed individuals, with 60.0% or 18 of them being unemployed.
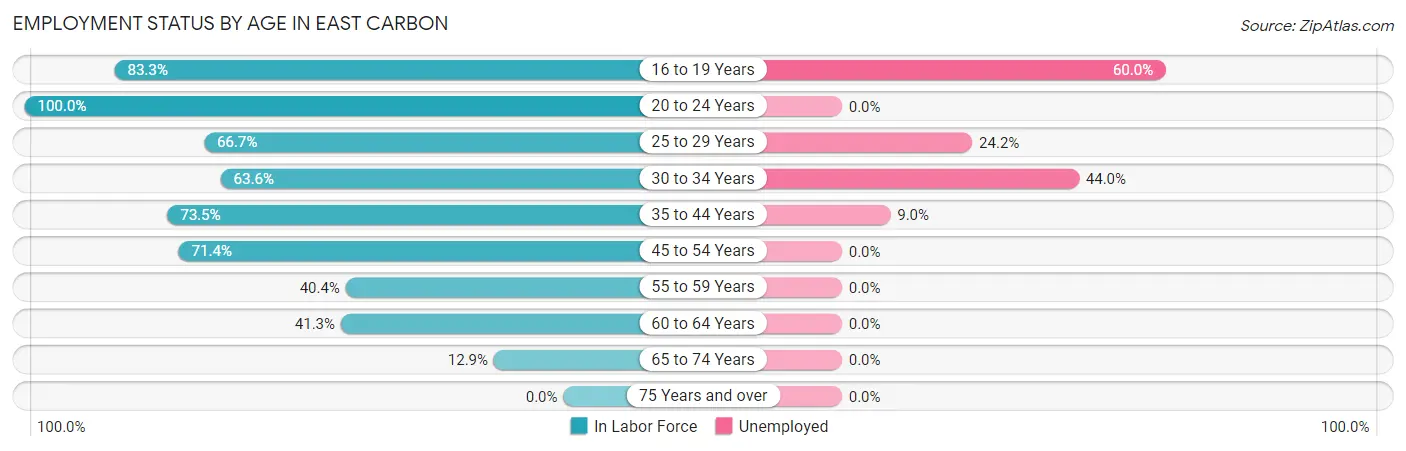
| Age Bracket | In Labor Force | Unemployed |
| 16 to 19 Years | 30 (83.3%) | 18 (60.0%) |
| 20 to 24 Years | 53 (100.0%) | 0 (0.0%) |
| 25 to 29 Years | 62 (66.7%) | 15 (24.2%) |
| 30 to 34 Years | 84 (63.6%) | 37 (44.0%) |
| 35 to 44 Years | 100 (73.5%) | 9 (9.0%) |
| 45 to 54 Years | 120 (71.4%) | 0 (0.0%) |
| 55 to 59 Years | 38 (40.4%) | 0 (0.0%) |
| 60 to 64 Years | 31 (41.3%) | 0 (0.0%) |
| 65 to 74 Years | 27 (12.9%) | 0 (0.0%) |
| 75 Years and over | 0 (0.0%) | 0 (0.0%) |
| Total | 545 (48.1%) | 79 (14.5%) |
Employment Status by Educational Attainment in East Carbon
According to labor force statistics for East Carbon, 62.3% of individuals (435) out of the total population between 25 and 64 years of age (698) are in the labor force, with 14.0% or 61 of them being unemployed. The group with the highest labor force participation rate are those with the educational attainment of bachelor's degree or higher, with 81.2% or 69 individuals in the labor force. Within the labor force, individuals with less than high school education have the highest percentage of unemployment, with 63.8% or 37 of them being unemployed.
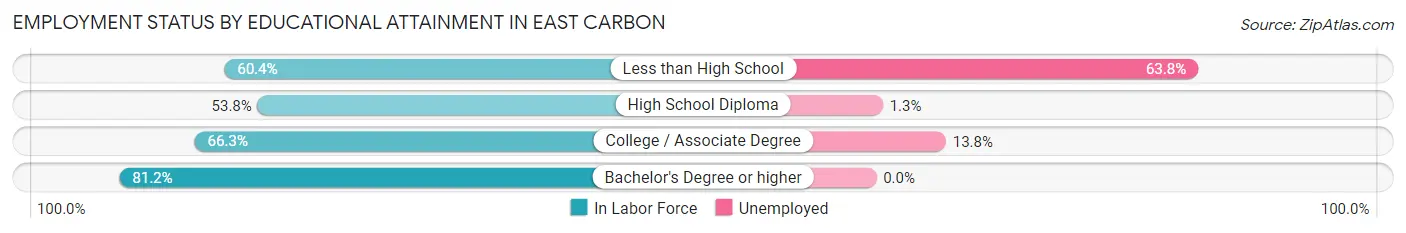
| Educational Attainment | In Labor Force | Unemployed |
| Less than High School | 58 (60.4%) | 61 (63.8%) |
| High School Diploma | 149 (53.8%) | 4 (1.3%) |
| College / Associate Degree | 159 (66.3%) | 33 (13.8%) |
| Bachelor's Degree or higher | 69 (81.2%) | 0 (0.0%) |
| Total | 435 (62.3%) | 98 (14.0%) |
Employment Occupations by Sex in East Carbon
Management, Business, Science and Arts Occupations
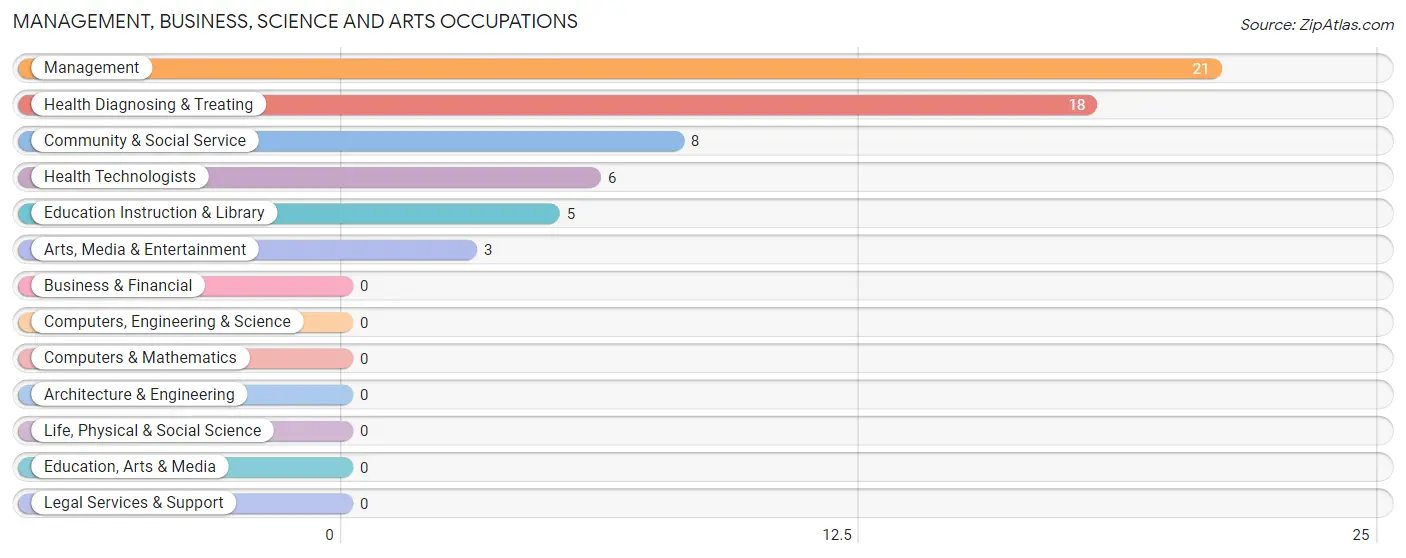
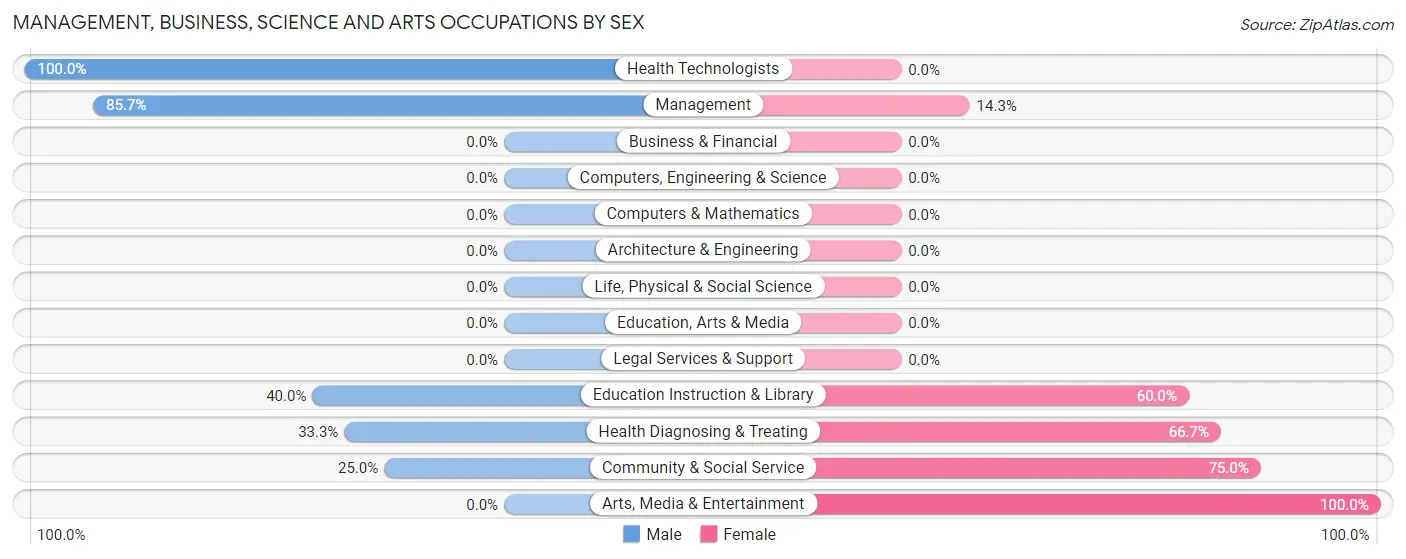
The most common Management, Business, Science and Arts occupations in East Carbon are Management (21 | 4.5%), Health Diagnosing & Treating (18 | 3.9%), Community & Social Service (8 | 1.7%), Health Technologists (6 | 1.3%), and Education Instruction & Library (5 | 1.1%).
Management, Business, Science and Arts Occupations by Sex
Within the Management, Business, Science and Arts occupations in East Carbon, the most male-oriented occupations are Health Technologists (100.0%), Management (85.7%), and Education Instruction & Library (40.0%), while the most female-oriented occupations are Arts, Media & Entertainment (100.0%), Community & Social Service (75.0%), and Health Diagnosing & Treating (66.7%).
| Occupation | Male | Female |
| Management | 18 (85.7%) | 3 (14.3%) |
| Business & Financial | 0 (0.0%) | 0 (0.0%) |
| Computers, Engineering & Science | 0 (0.0%) | 0 (0.0%) |
| Computers & Mathematics | 0 (0.0%) | 0 (0.0%) |
| Architecture & Engineering | 0 (0.0%) | 0 (0.0%) |
| Life, Physical & Social Science | 0 (0.0%) | 0 (0.0%) |
| Community & Social Service | 2 (25.0%) | 6 (75.0%) |
| Education, Arts & Media | 0 (0.0%) | 0 (0.0%) |
| Legal Services & Support | 0 (0.0%) | 0 (0.0%) |
| Education Instruction & Library | 2 (40.0%) | 3 (60.0%) |
| Arts, Media & Entertainment | 0 (0.0%) | 3 (100.0%) |
| Health Diagnosing & Treating | 6 (33.3%) | 12 (66.7%) |
| Health Technologists | 6 (100.0%) | 0 (0.0%) |
| Total (Category) | 26 (55.3%) | 21 (44.7%) |
| Total (Overall) | 295 (63.3%) | 171 (36.7%) |
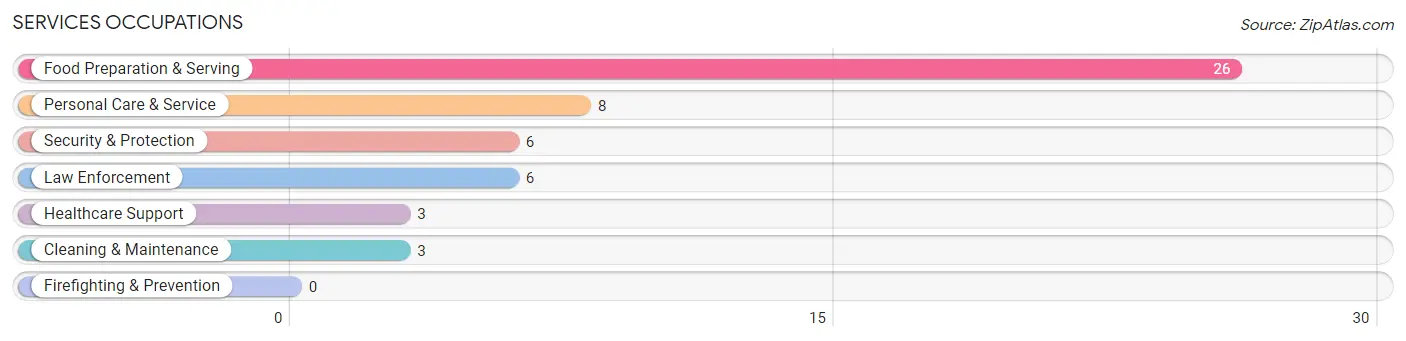
Services Occupations
The most common Services occupations in East Carbon are Food Preparation & Serving (26 | 5.6%), Personal Care & Service (8 | 1.7%), Security & Protection (6 | 1.3%), Law Enforcement (6 | 1.3%), and Healthcare Support (3 | 0.6%).
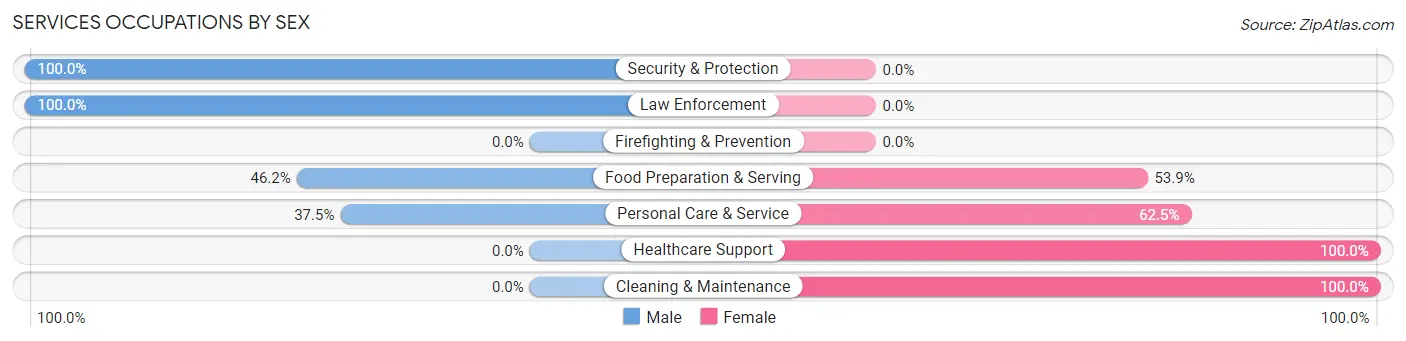
Services Occupations by Sex
Within the Services occupations in East Carbon, the most male-oriented occupations are Security & Protection (100.0%), Law Enforcement (100.0%), and Food Preparation & Serving (46.2%), while the most female-oriented occupations are Healthcare Support (100.0%), Cleaning & Maintenance (100.0%), and Personal Care & Service (62.5%).
| Occupation | Male | Female |
| Healthcare Support | 0 (0.0%) | 3 (100.0%) |
| Security & Protection | 6 (100.0%) | 0 (0.0%) |
| Firefighting & Prevention | 0 (0.0%) | 0 (0.0%) |
| Law Enforcement | 6 (100.0%) | 0 (0.0%) |
| Food Preparation & Serving | 12 (46.2%) | 14 (53.8%) |
| Cleaning & Maintenance | 0 (0.0%) | 3 (100.0%) |
| Personal Care & Service | 3 (37.5%) | 5 (62.5%) |
| Total (Category) | 21 (45.7%) | 25 (54.3%) |
| Total (Overall) | 295 (63.3%) | 171 (36.7%) |
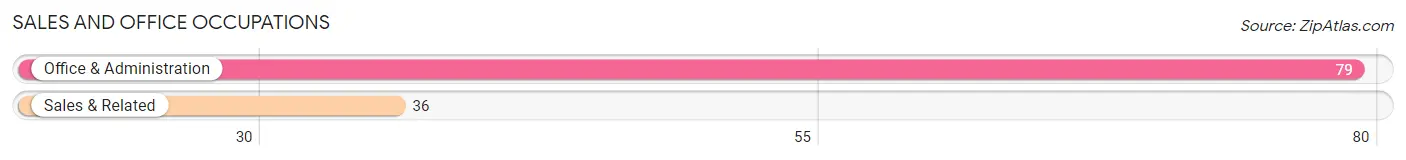
Sales and Office Occupations
The most common Sales and Office occupations in East Carbon are Office & Administration (79 | 17.0%), and Sales & Related (36 | 7.7%).
Sales and Office Occupations by Sex
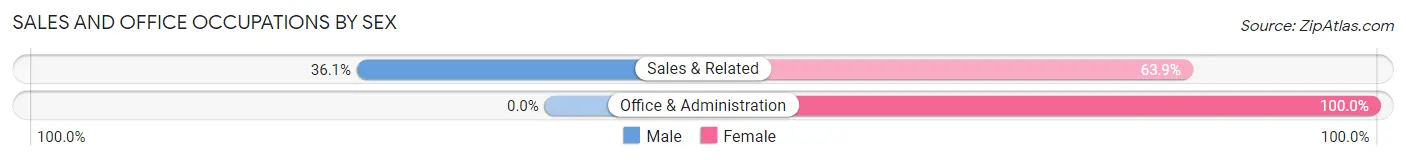
| Occupation | Male | Female |
| Sales & Related | 13 (36.1%) | 23 (63.9%) |
| Office & Administration | 0 (0.0%) | 79 (100.0%) |
| Total (Category) | 13 (11.3%) | 102 (88.7%) |
| Total (Overall) | 295 (63.3%) | 171 (36.7%) |
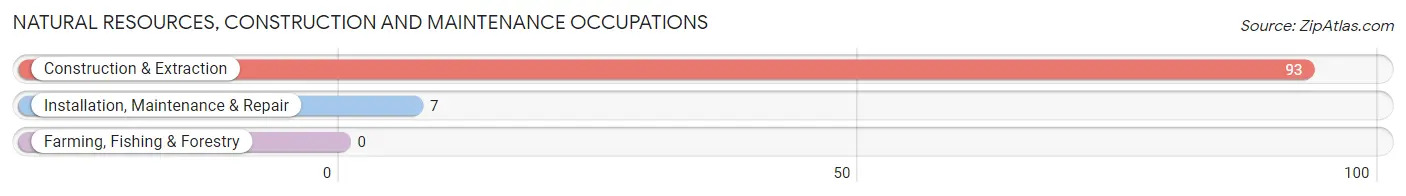
Natural Resources, Construction and Maintenance Occupations
The most common Natural Resources, Construction and Maintenance occupations in East Carbon are Construction & Extraction (93 | 20.0%), and Installation, Maintenance & Repair (7 | 1.5%).
Natural Resources, Construction and Maintenance Occupations by Sex
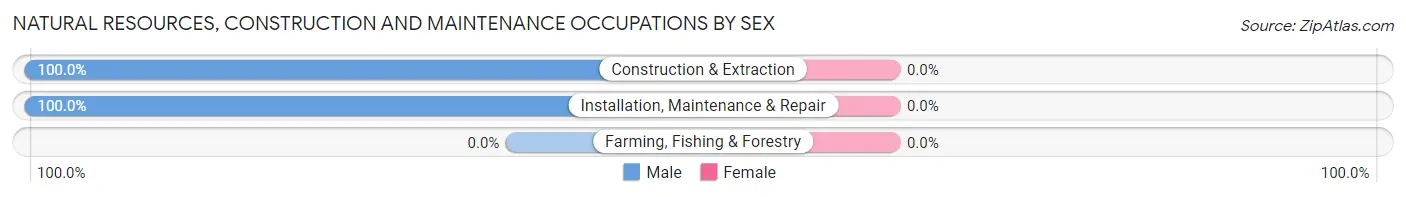
| Occupation | Male | Female |
| Farming, Fishing & Forestry | 0 (0.0%) | 0 (0.0%) |
| Construction & Extraction | 93 (100.0%) | 0 (0.0%) |
| Installation, Maintenance & Repair | 7 (100.0%) | 0 (0.0%) |
| Total (Category) | 100 (100.0%) | 0 (0.0%) |
| Total (Overall) | 295 (63.3%) | 171 (36.7%) |
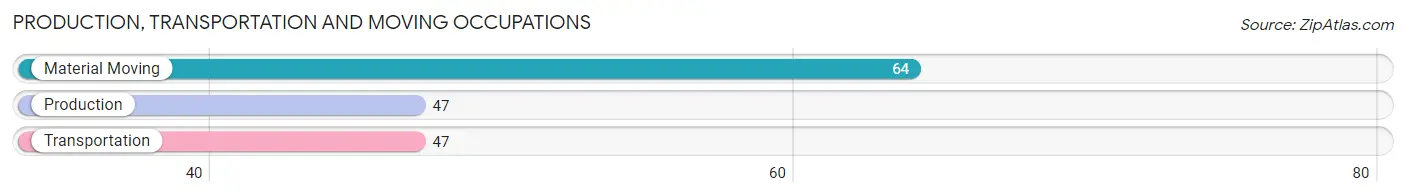
Production, Transportation and Moving Occupations
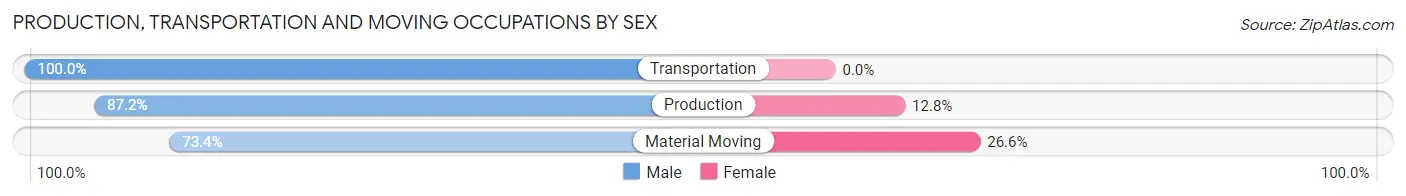
The most common Production, Transportation and Moving occupations in East Carbon are Material Moving (64 | 13.7%), Production (47 | 10.1%), and Transportation (47 | 10.1%).
Production, Transportation and Moving Occupations by Sex
| Occupation | Male | Female |
| Production | 41 (87.2%) | 6 (12.8%) |
| Transportation | 47 (100.0%) | 0 (0.0%) |
| Material Moving | 47 (73.4%) | 17 (26.6%) |
| Total (Category) | 135 (85.4%) | 23 (14.6%) |
| Total (Overall) | 295 (63.3%) | 171 (36.7%) |
Employment Industries by Sex in East Carbon
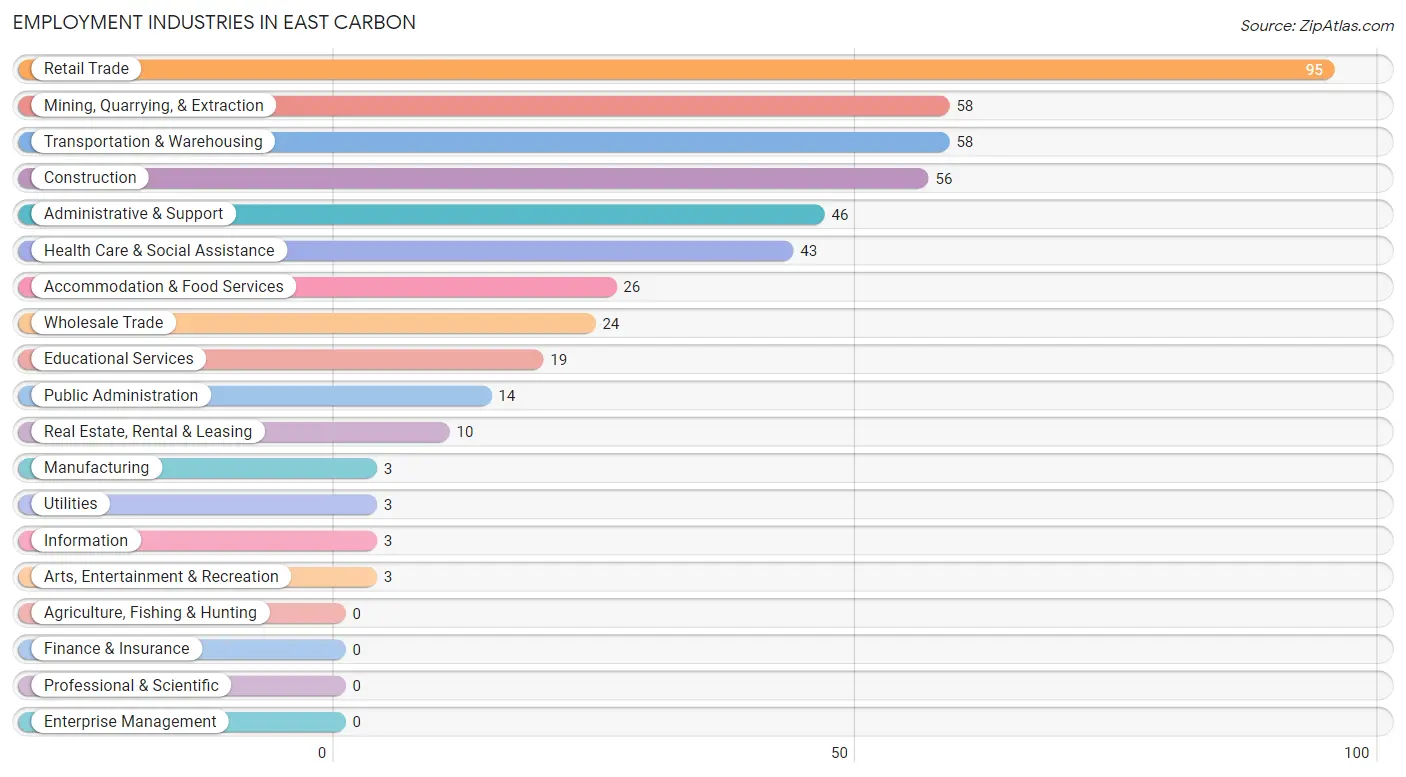
Employment Industries in East Carbon
The major employment industries in East Carbon include Retail Trade (95 | 20.4%), Mining, Quarrying, & Extraction (58 | 12.4%), Transportation & Warehousing (58 | 12.4%), Construction (56 | 12.0%), and Administrative & Support (46 | 9.9%).
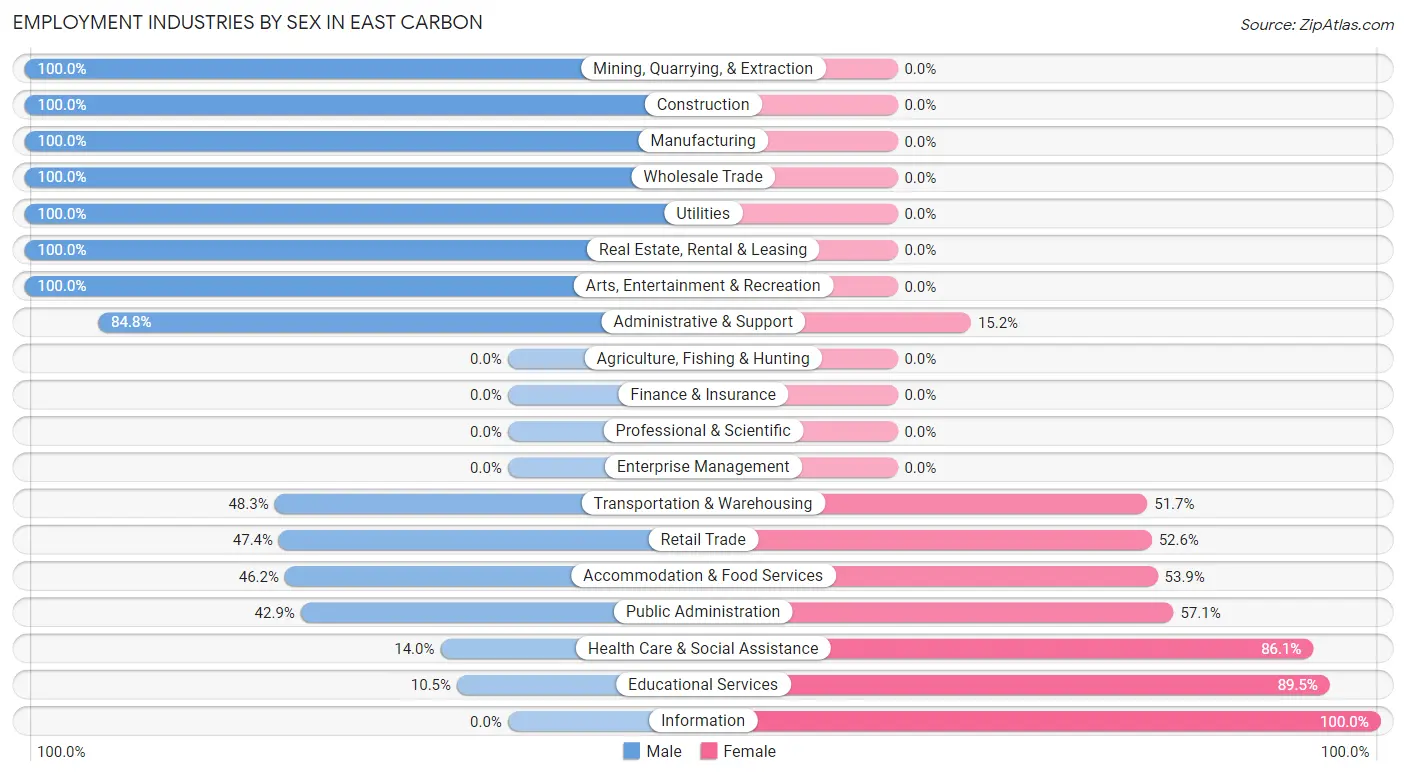
Employment Industries by Sex in East Carbon
The East Carbon industries that see more men than women are Mining, Quarrying, & Extraction (100.0%), Construction (100.0%), and Manufacturing (100.0%), whereas the industries that tend to have a higher number of women are Information (100.0%), Educational Services (89.5%), and Health Care & Social Assistance (86.1%).
| Industry | Male | Female |
| Agriculture, Fishing & Hunting | 0 (0.0%) | 0 (0.0%) |
| Mining, Quarrying, & Extraction | 58 (100.0%) | 0 (0.0%) |
| Construction | 56 (100.0%) | 0 (0.0%) |
| Manufacturing | 3 (100.0%) | 0 (0.0%) |
| Wholesale Trade | 24 (100.0%) | 0 (0.0%) |
| Retail Trade | 45 (47.4%) | 50 (52.6%) |
| Transportation & Warehousing | 28 (48.3%) | 30 (51.7%) |
| Utilities | 3 (100.0%) | 0 (0.0%) |
| Information | 0 (0.0%) | 3 (100.0%) |
| Finance & Insurance | 0 (0.0%) | 0 (0.0%) |
| Real Estate, Rental & Leasing | 10 (100.0%) | 0 (0.0%) |
| Professional & Scientific | 0 (0.0%) | 0 (0.0%) |
| Enterprise Management | 0 (0.0%) | 0 (0.0%) |
| Administrative & Support | 39 (84.8%) | 7 (15.2%) |
| Educational Services | 2 (10.5%) | 17 (89.5%) |
| Health Care & Social Assistance | 6 (14.0%) | 37 (86.1%) |
| Arts, Entertainment & Recreation | 3 (100.0%) | 0 (0.0%) |
| Accommodation & Food Services | 12 (46.2%) | 14 (53.8%) |
| Public Administration | 6 (42.9%) | 8 (57.1%) |
| Total | 295 (63.3%) | 171 (36.7%) |
Education in East Carbon
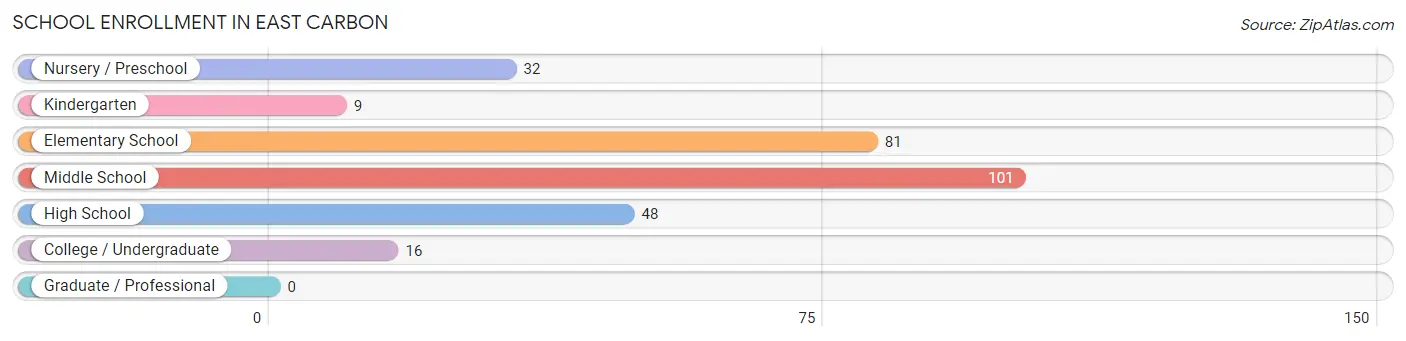
School Enrollment in East Carbon
The most common levels of schooling among the 287 students in East Carbon are middle school (101 | 35.2%), elementary school (81 | 28.2%), and high school (48 | 16.7%).
| School Level | # Students | % Students |
| Nursery / Preschool | 32 | 11.2% |
| Kindergarten | 9 | 3.1% |
| Elementary School | 81 | 28.2% |
| Middle School | 101 | 35.2% |
| High School | 48 | 16.7% |
| College / Undergraduate | 16 | 5.6% |
| Graduate / Professional | 0 | 0.0% |
| Total | 287 | 100.0% |
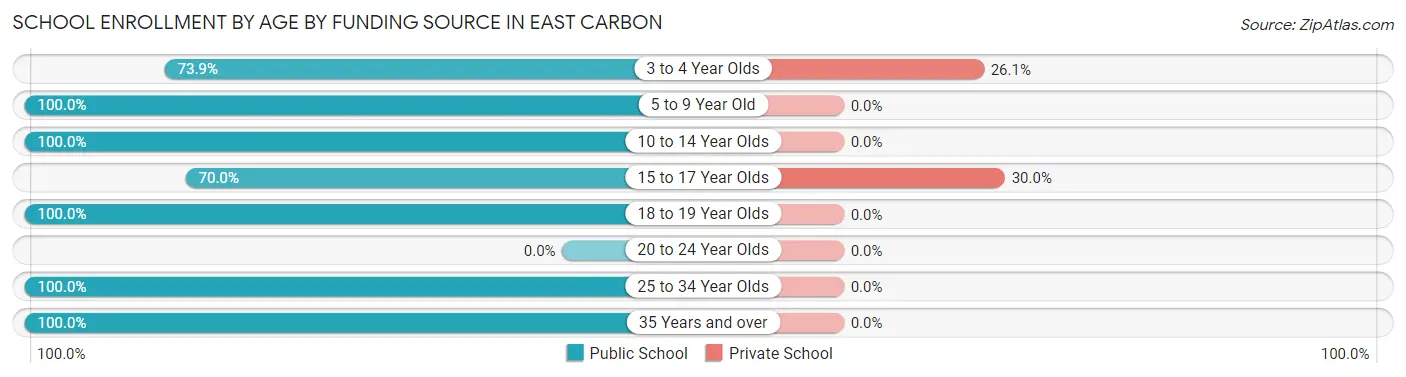
School Enrollment by Age by Funding Source in East Carbon
Out of a total of 287 students who are enrolled in schools in East Carbon, 15 (5.2%) attend a private institution, while the remaining 272 (94.8%) are enrolled in public schools. The age group of 15 to 17 year olds has the highest likelihood of being enrolled in private schools, with 9 (30.0% in the age bracket) enrolled. Conversely, the age group of 5 to 9 year old has the lowest likelihood of being enrolled in a private school, with 87 (100.0% in the age bracket) attending a public institution.
| Age Bracket | Public School | Private School |
| 3 to 4 Year Olds | 17 (73.9%) | 6 (26.1%) |
| 5 to 9 Year Old | 87 (100.0%) | 0 (0.0%) |
| 10 to 14 Year Olds | 123 (100.0%) | 0 (0.0%) |
| 15 to 17 Year Olds | 21 (70.0%) | 9 (30.0%) |
| 18 to 19 Year Olds | 10 (100.0%) | 0 (0.0%) |
| 20 to 24 Year Olds | 0 (0.0%) | 0 (0.0%) |
| 25 to 34 Year Olds | 7 (100.0%) | 0 (0.0%) |
| 35 Years and over | 7 (100.0%) | 0 (0.0%) |
| Total | 272 (94.8%) | 15 (5.2%) |
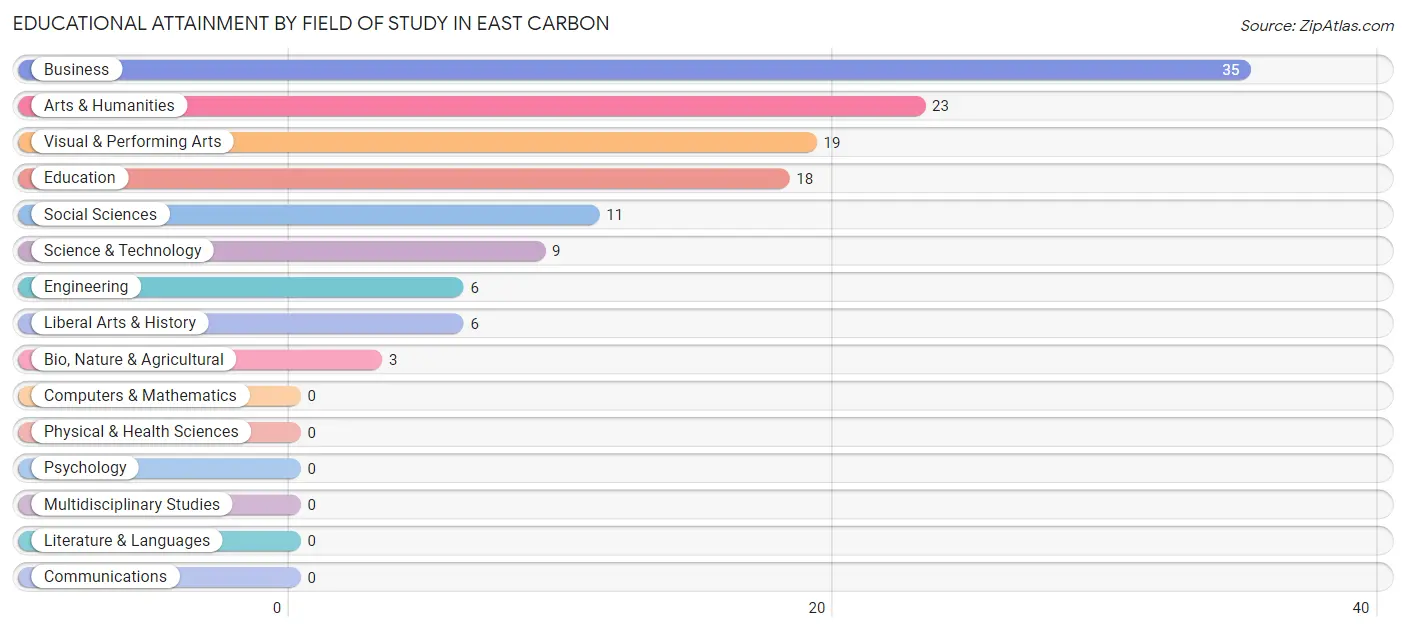
Educational Attainment by Field of Study in East Carbon
Business (35 | 26.9%), arts & humanities (23 | 17.7%), visual & performing arts (19 | 14.6%), education (18 | 13.9%), and social sciences (11 | 8.5%) are the most common fields of study among 130 individuals in East Carbon who have obtained a bachelor's degree or higher.
| Field of Study | # Graduates | % Graduates |
| Computers & Mathematics | 0 | 0.0% |
| Bio, Nature & Agricultural | 3 | 2.3% |
| Physical & Health Sciences | 0 | 0.0% |
| Psychology | 0 | 0.0% |
| Social Sciences | 11 | 8.5% |
| Engineering | 6 | 4.6% |
| Multidisciplinary Studies | 0 | 0.0% |
| Science & Technology | 9 | 6.9% |
| Business | 35 | 26.9% |
| Education | 18 | 13.9% |
| Literature & Languages | 0 | 0.0% |
| Liberal Arts & History | 6 | 4.6% |
| Visual & Performing Arts | 19 | 14.6% |
| Communications | 0 | 0.0% |
| Arts & Humanities | 23 | 17.7% |
| Total | 130 | 100.0% |
Transportation & Commute in East Carbon
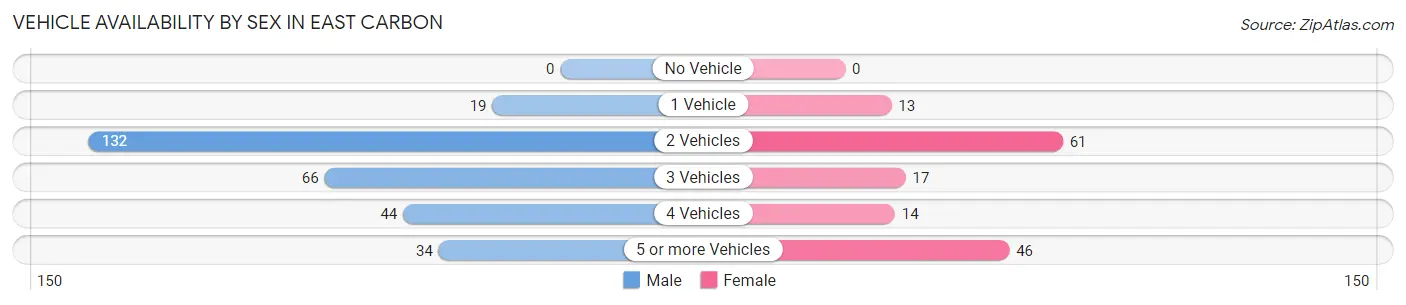
Vehicle Availability by Sex in East Carbon
The most prevalent vehicle ownership categories in East Carbon are males with 2 vehicles (132, accounting for 44.8%) and females with 2 vehicles (61, making up 87.4%).
| Vehicles Available | Male | Female |
| No Vehicle | 0 (0.0%) | 0 (0.0%) |
| 1 Vehicle | 19 (6.4%) | 13 (8.6%) |
| 2 Vehicles | 132 (44.8%) | 61 (40.4%) |
| 3 Vehicles | 66 (22.4%) | 17 (11.3%) |
| 4 Vehicles | 44 (14.9%) | 14 (9.3%) |
| 5 or more Vehicles | 34 (11.5%) | 46 (30.5%) |
| Total | 295 (100.0%) | 151 (100.0%) |
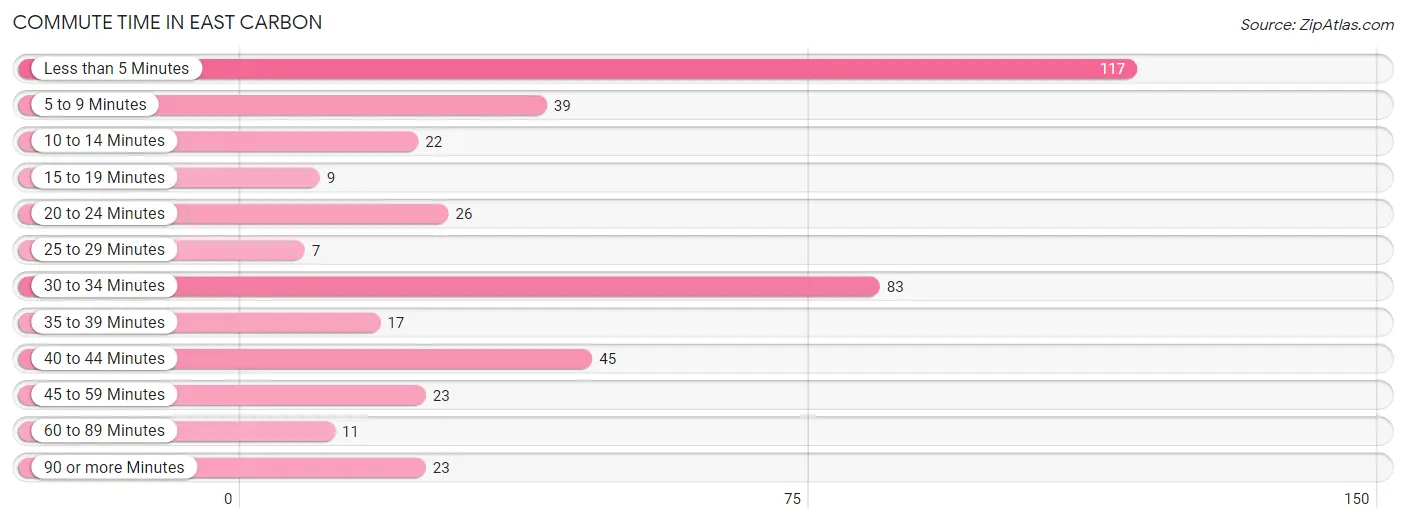
Commute Time in East Carbon
The most frequently occuring commute durations in East Carbon are less than 5 minutes (117 commuters, 27.7%), 30 to 34 minutes (83 commuters, 19.7%), and 40 to 44 minutes (45 commuters, 10.7%).
| Commute Time | # Commuters | % Commuters |
| Less than 5 Minutes | 117 | 27.7% |
| 5 to 9 Minutes | 39 | 9.2% |
| 10 to 14 Minutes | 22 | 5.2% |
| 15 to 19 Minutes | 9 | 2.1% |
| 20 to 24 Minutes | 26 | 6.2% |
| 25 to 29 Minutes | 7 | 1.7% |
| 30 to 34 Minutes | 83 | 19.7% |
| 35 to 39 Minutes | 17 | 4.0% |
| 40 to 44 Minutes | 45 | 10.7% |
| 45 to 59 Minutes | 23 | 5.4% |
| 60 to 89 Minutes | 11 | 2.6% |
| 90 or more Minutes | 23 | 5.4% |
Commute Time by Sex in East Carbon
The most common commute times in East Carbon are 30 to 34 minutes (70 commuters, 25.6%) for males and less than 5 minutes (90 commuters, 60.8%) for females.
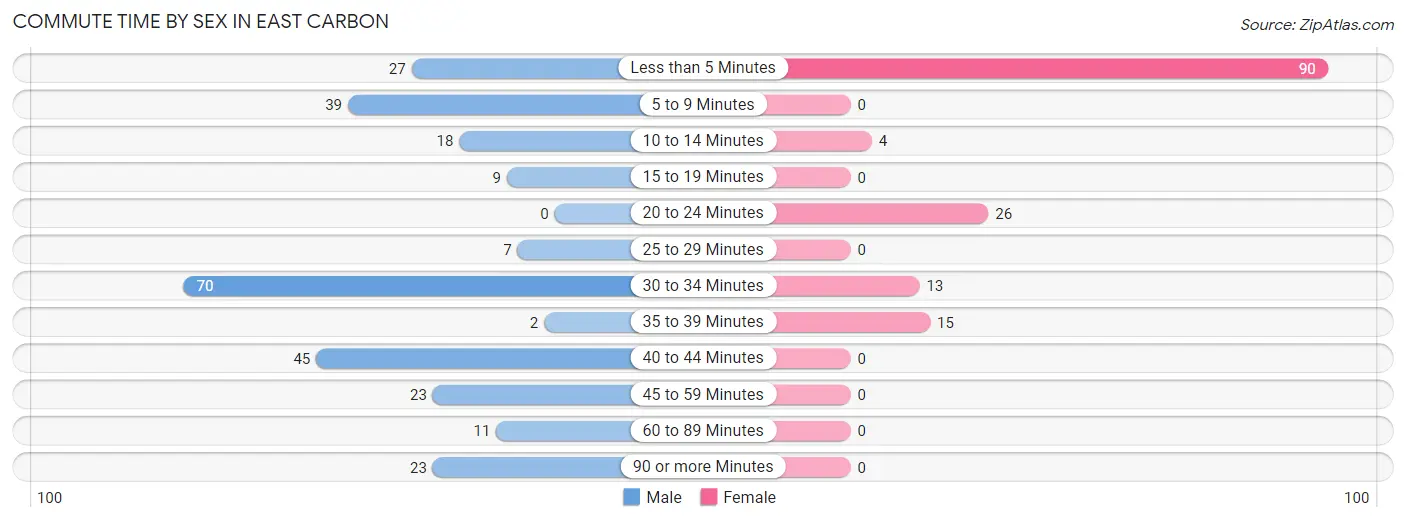
| Commute Time | Male | Female |
| Less than 5 Minutes | 27 (9.9%) | 90 (60.8%) |
| 5 to 9 Minutes | 39 (14.2%) | 0 (0.0%) |
| 10 to 14 Minutes | 18 (6.6%) | 4 (2.7%) |
| 15 to 19 Minutes | 9 (3.3%) | 0 (0.0%) |
| 20 to 24 Minutes | 0 (0.0%) | 26 (17.6%) |
| 25 to 29 Minutes | 7 (2.5%) | 0 (0.0%) |
| 30 to 34 Minutes | 70 (25.6%) | 13 (8.8%) |
| 35 to 39 Minutes | 2 (0.7%) | 15 (10.1%) |
| 40 to 44 Minutes | 45 (16.4%) | 0 (0.0%) |
| 45 to 59 Minutes | 23 (8.4%) | 0 (0.0%) |
| 60 to 89 Minutes | 11 (4.0%) | 0 (0.0%) |
| 90 or more Minutes | 23 (8.4%) | 0 (0.0%) |
Time of Departure to Work by Sex in East Carbon
The most frequent times of departure to work in East Carbon are 6:00 AM to 6:29 AM (76, 27.7%) for males and 8:00 AM to 8:29 AM (37, 25.0%) for females.
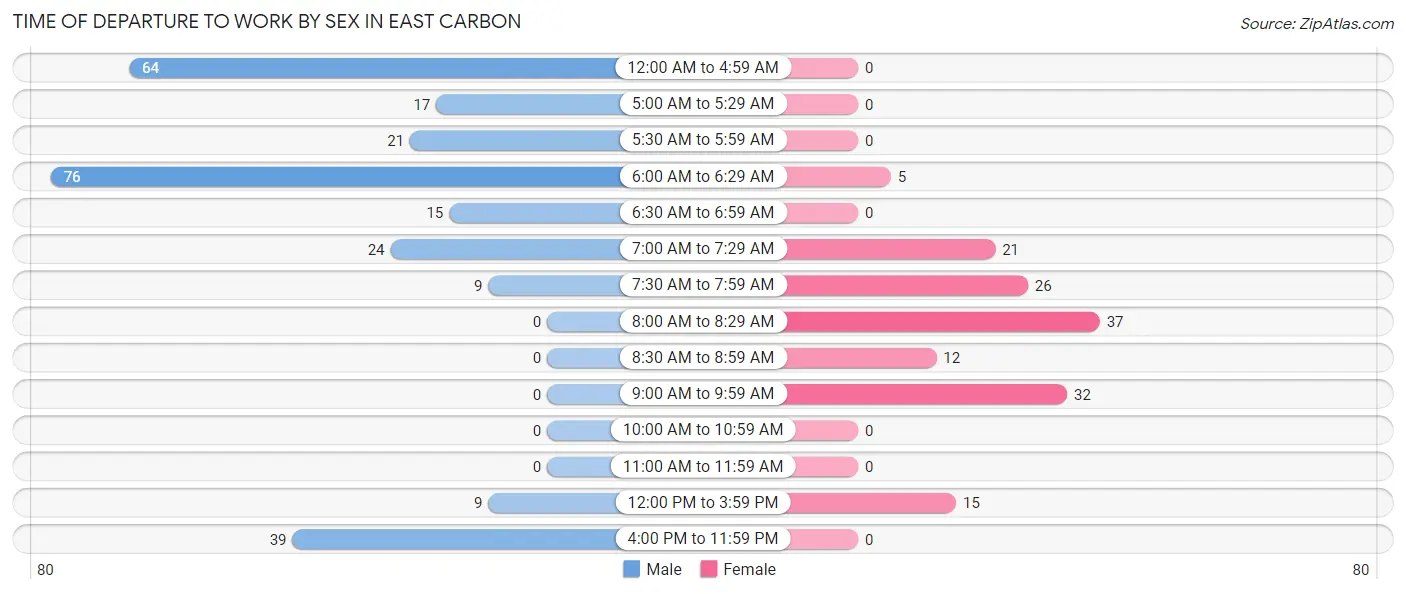
| Time of Departure | Male | Female |
| 12:00 AM to 4:59 AM | 64 (23.4%) | 0 (0.0%) |
| 5:00 AM to 5:29 AM | 17 (6.2%) | 0 (0.0%) |
| 5:30 AM to 5:59 AM | 21 (7.7%) | 0 (0.0%) |
| 6:00 AM to 6:29 AM | 76 (27.7%) | 5 (3.4%) |
| 6:30 AM to 6:59 AM | 15 (5.5%) | 0 (0.0%) |
| 7:00 AM to 7:29 AM | 24 (8.8%) | 21 (14.2%) |
| 7:30 AM to 7:59 AM | 9 (3.3%) | 26 (17.6%) |
| 8:00 AM to 8:29 AM | 0 (0.0%) | 37 (25.0%) |
| 8:30 AM to 8:59 AM | 0 (0.0%) | 12 (8.1%) |
| 9:00 AM to 9:59 AM | 0 (0.0%) | 32 (21.6%) |
| 10:00 AM to 10:59 AM | 0 (0.0%) | 0 (0.0%) |
| 11:00 AM to 11:59 AM | 0 (0.0%) | 0 (0.0%) |
| 12:00 PM to 3:59 PM | 9 (3.3%) | 15 (10.1%) |
| 4:00 PM to 11:59 PM | 39 (14.2%) | 0 (0.0%) |
| Total | 274 (100.0%) | 148 (100.0%) |
Housing Occupancy in East Carbon
Occupancy by Ownership in East Carbon
Of the total 567 dwellings in East Carbon, owner-occupied units account for 385 (67.9%), while renter-occupied units make up 182 (32.1%).
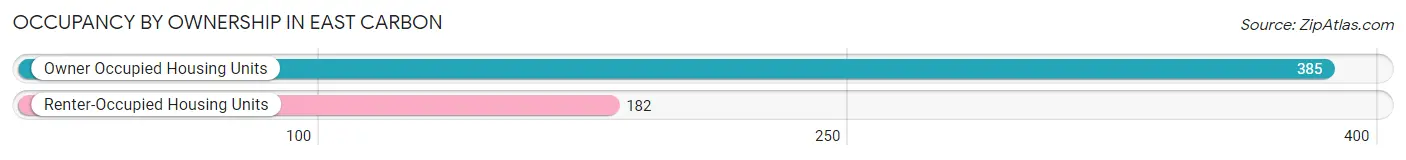
| Occupancy | # Housing Units | % Housing Units |
| Owner Occupied Housing Units | 385 | 67.9% |
| Renter-Occupied Housing Units | 182 | 32.1% |
| Total Occupied Housing Units | 567 | 100.0% |
Occupancy by Household Size in East Carbon
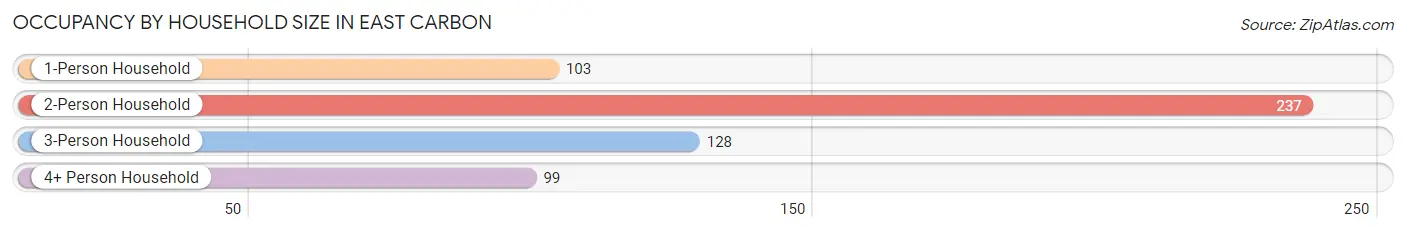
| Household Size | # Housing Units | % Housing Units |
| 1-Person Household | 103 | 18.2% |
| 2-Person Household | 237 | 41.8% |
| 3-Person Household | 128 | 22.6% |
| 4+ Person Household | 99 | 17.5% |
| Total Housing Units | 567 | 100.0% |
Occupancy by Ownership by Household Size in East Carbon
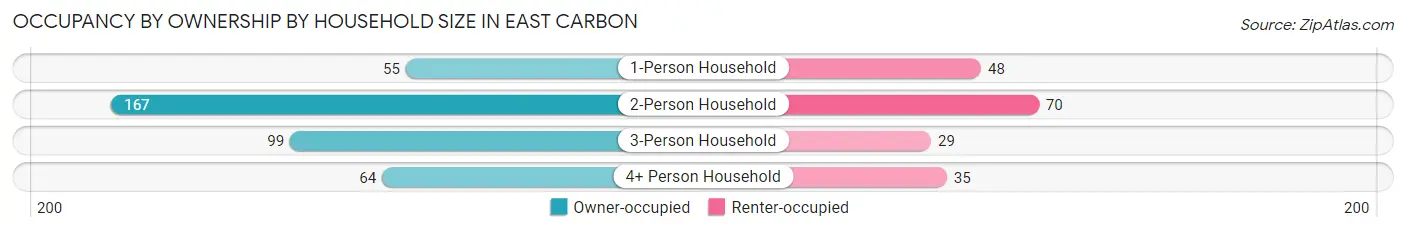
| Household Size | Owner-occupied | Renter-occupied |
| 1-Person Household | 55 (53.4%) | 48 (46.6%) |
| 2-Person Household | 167 (70.5%) | 70 (29.5%) |
| 3-Person Household | 99 (77.3%) | 29 (22.7%) |
| 4+ Person Household | 64 (64.6%) | 35 (35.3%) |
| Total Housing Units | 385 (67.9%) | 182 (32.1%) |
Occupancy by Educational Attainment in East Carbon
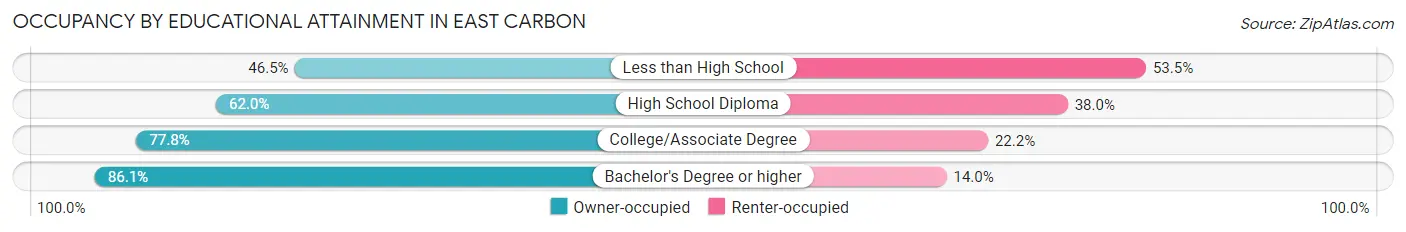
| Household Size | Owner-occupied | Renter-occupied |
| Less than High School | 40 (46.5%) | 46 (53.5%) |
| High School Diploma | 129 (62.0%) | 79 (38.0%) |
| College/Associate Degree | 179 (77.8%) | 51 (22.2%) |
| Bachelor's Degree or higher | 37 (86.1%) | 6 (14.0%) |
Occupancy by Age of Householder in East Carbon
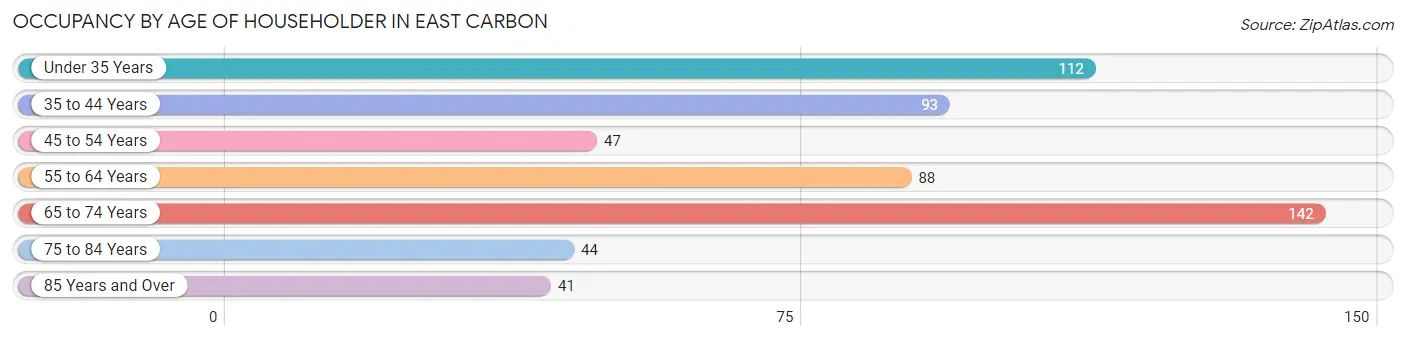
| Age Bracket | # Households | % Households |
| Under 35 Years | 112 | 19.8% |
| 35 to 44 Years | 93 | 16.4% |
| 45 to 54 Years | 47 | 8.3% |
| 55 to 64 Years | 88 | 15.5% |
| 65 to 74 Years | 142 | 25.0% |
| 75 to 84 Years | 44 | 7.8% |
| 85 Years and Over | 41 | 7.2% |
| Total | 567 | 100.0% |
Housing Finances in East Carbon
Median Income by Occupancy in East Carbon
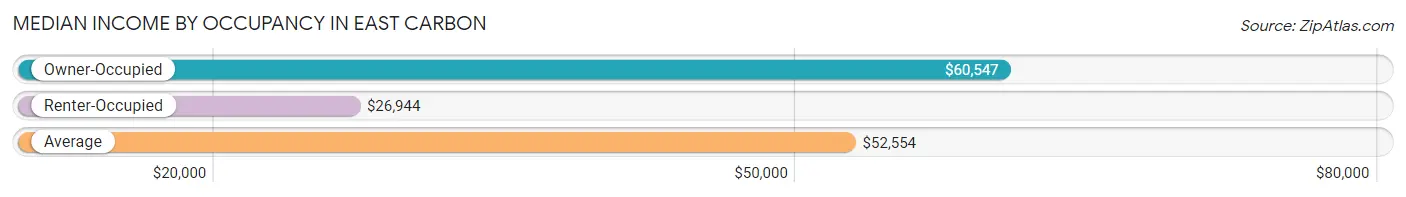
| Occupancy Type | # Households | Median Income |
| Owner-Occupied | 385 (67.9%) | $60,547 |
| Renter-Occupied | 182 (32.1%) | $26,944 |
| Average | 567 (100.0%) | $52,554 |
Occupancy by Householder Income Bracket in East Carbon
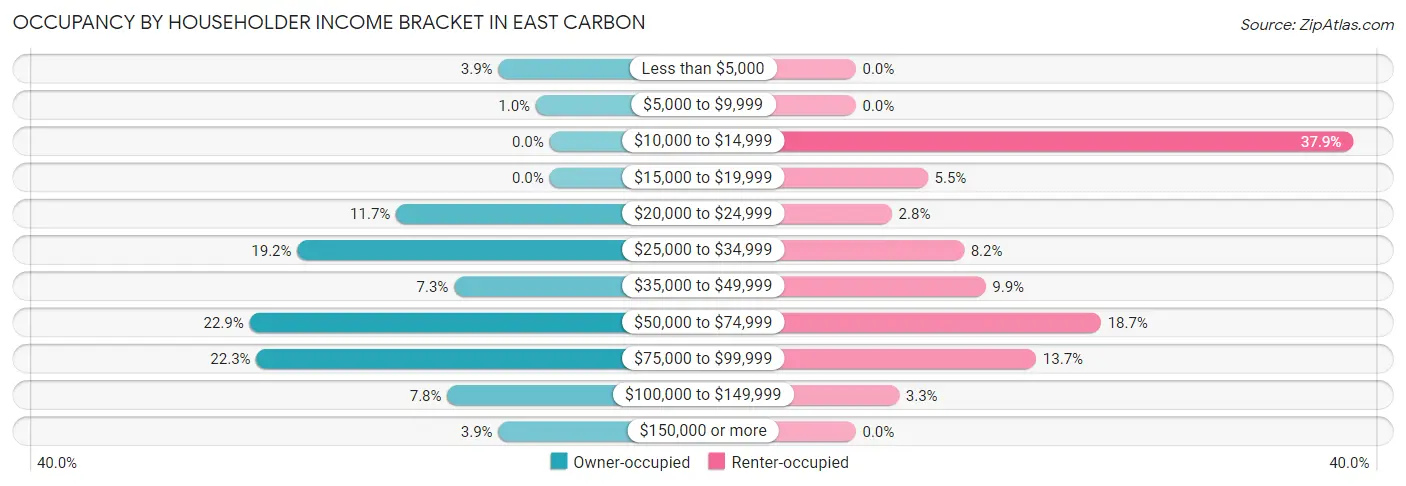
| Income Bracket | Owner-occupied | Renter-occupied |
| Less than $5,000 | 15 (3.9%) | 0 (0.0%) |
| $5,000 to $9,999 | 4 (1.0%) | 0 (0.0%) |
| $10,000 to $14,999 | 0 (0.0%) | 69 (37.9%) |
| $15,000 to $19,999 | 0 (0.0%) | 10 (5.5%) |
| $20,000 to $24,999 | 45 (11.7%) | 5 (2.8%) |
| $25,000 to $34,999 | 74 (19.2%) | 15 (8.2%) |
| $35,000 to $49,999 | 28 (7.3%) | 18 (9.9%) |
| $50,000 to $74,999 | 88 (22.9%) | 34 (18.7%) |
| $75,000 to $99,999 | 86 (22.3%) | 25 (13.7%) |
| $100,000 to $149,999 | 30 (7.8%) | 6 (3.3%) |
| $150,000 or more | 15 (3.9%) | 0 (0.0%) |
| Total | 385 (100.0%) | 182 (100.0%) |
Monthly Housing Cost Tiers in East Carbon
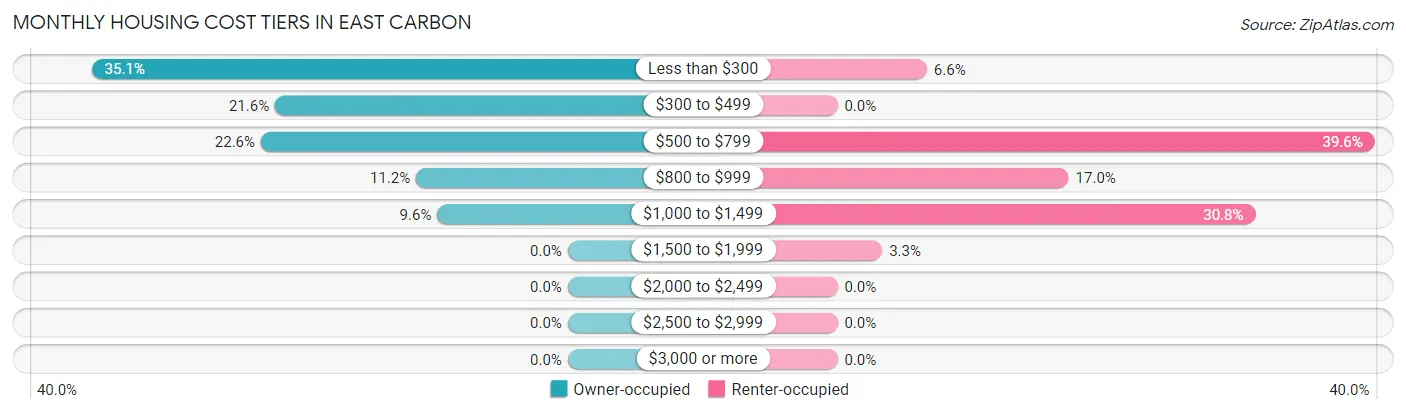
| Monthly Cost | Owner-occupied | Renter-occupied |
| Less than $300 | 135 (35.1%) | 12 (6.6%) |
| $300 to $499 | 83 (21.6%) | 0 (0.0%) |
| $500 to $799 | 87 (22.6%) | 72 (39.6%) |
| $800 to $999 | 43 (11.2%) | 31 (17.0%) |
| $1,000 to $1,499 | 37 (9.6%) | 56 (30.8%) |
| $1,500 to $1,999 | 0 (0.0%) | 6 (3.3%) |
| $2,000 to $2,499 | 0 (0.0%) | 0 (0.0%) |
| $2,500 to $2,999 | 0 (0.0%) | 0 (0.0%) |
| $3,000 or more | 0 (0.0%) | 0 (0.0%) |
| Total | 385 (100.0%) | 182 (100.0%) |
Physical Housing Characteristics in East Carbon
Housing Structures in East Carbon
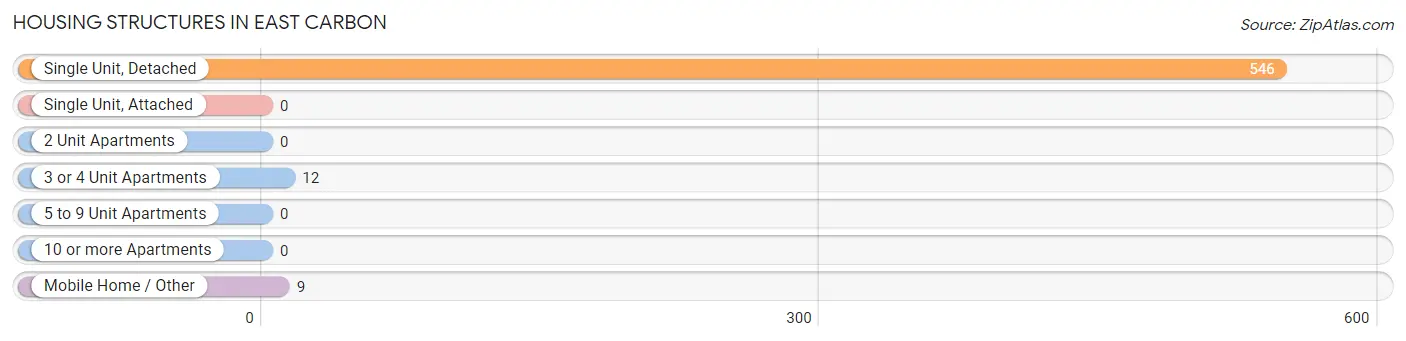
| Structure Type | # Housing Units | % Housing Units |
| Single Unit, Detached | 546 | 96.3% |
| Single Unit, Attached | 0 | 0.0% |
| 2 Unit Apartments | 0 | 0.0% |
| 3 or 4 Unit Apartments | 12 | 2.1% |
| 5 to 9 Unit Apartments | 0 | 0.0% |
| 10 or more Apartments | 0 | 0.0% |
| Mobile Home / Other | 9 | 1.6% |
| Total | 567 | 100.0% |
Housing Structures by Occupancy in East Carbon
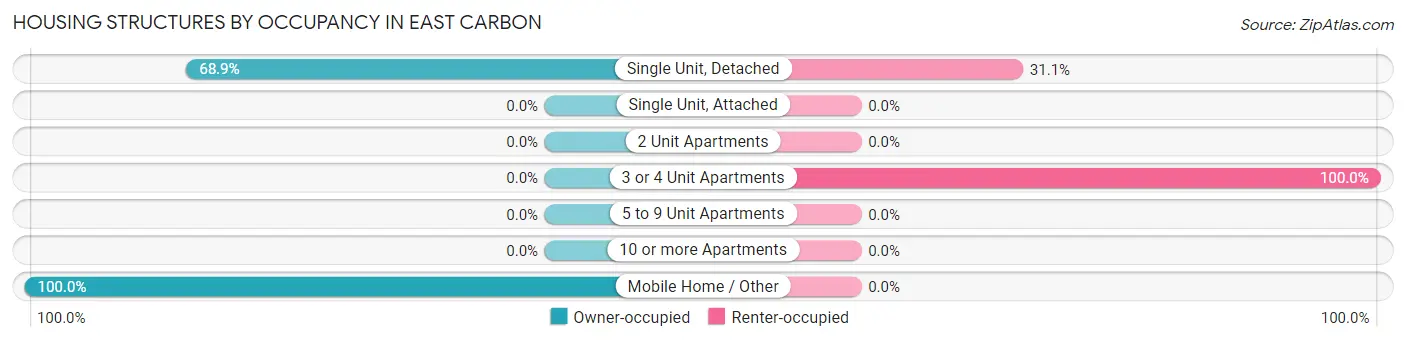
| Structure Type | Owner-occupied | Renter-occupied |
| Single Unit, Detached | 376 (68.9%) | 170 (31.1%) |
| Single Unit, Attached | 0 (0.0%) | 0 (0.0%) |
| 2 Unit Apartments | 0 (0.0%) | 0 (0.0%) |
| 3 or 4 Unit Apartments | 0 (0.0%) | 12 (100.0%) |
| 5 to 9 Unit Apartments | 0 (0.0%) | 0 (0.0%) |
| 10 or more Apartments | 0 (0.0%) | 0 (0.0%) |
| Mobile Home / Other | 9 (100.0%) | 0 (0.0%) |
| Total | 385 (67.9%) | 182 (32.1%) |
Housing Structures by Number of Rooms in East Carbon
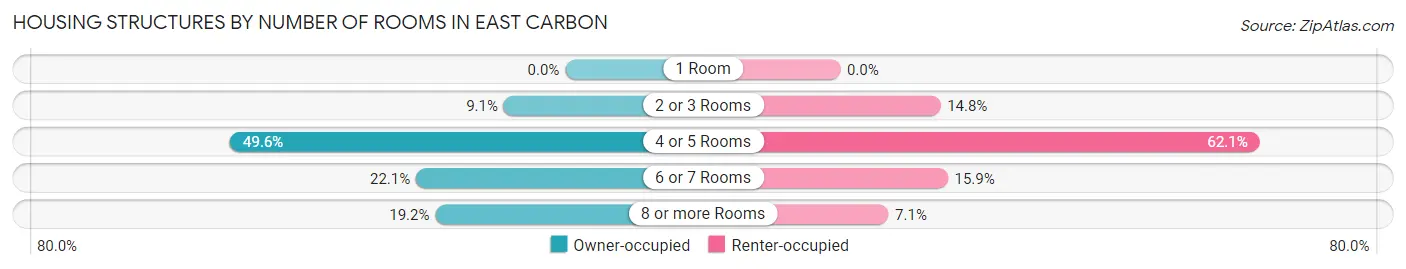
| Number of Rooms | Owner-occupied | Renter-occupied |
| 1 Room | 0 (0.0%) | 0 (0.0%) |
| 2 or 3 Rooms | 35 (9.1%) | 27 (14.8%) |
| 4 or 5 Rooms | 191 (49.6%) | 113 (62.1%) |
| 6 or 7 Rooms | 85 (22.1%) | 29 (15.9%) |
| 8 or more Rooms | 74 (19.2%) | 13 (7.1%) |
| Total | 385 (100.0%) | 182 (100.0%) |
Housing Structure by Heating Type in East Carbon
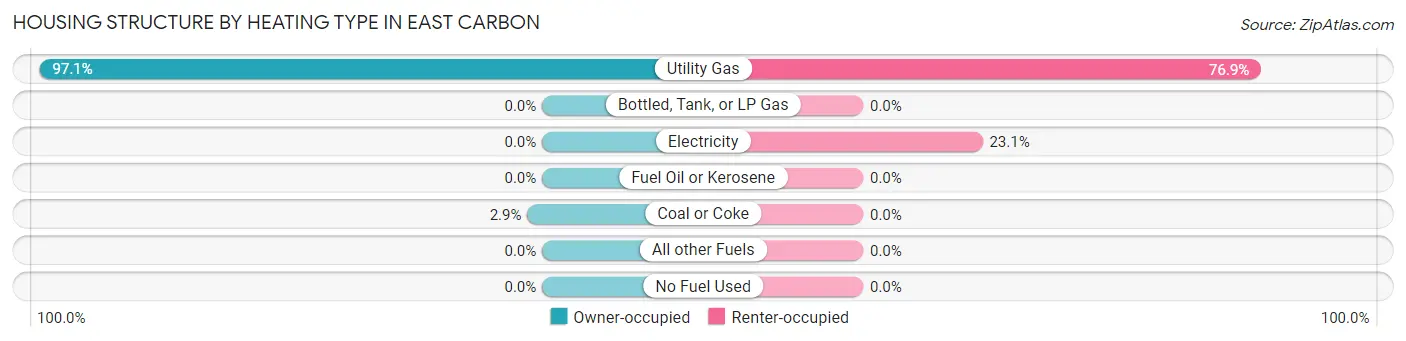
| Heating Type | Owner-occupied | Renter-occupied |
| Utility Gas | 374 (97.1%) | 140 (76.9%) |
| Bottled, Tank, or LP Gas | 0 (0.0%) | 0 (0.0%) |
| Electricity | 0 (0.0%) | 42 (23.1%) |
| Fuel Oil or Kerosene | 0 (0.0%) | 0 (0.0%) |
| Coal or Coke | 11 (2.9%) | 0 (0.0%) |
| All other Fuels | 0 (0.0%) | 0 (0.0%) |
| No Fuel Used | 0 (0.0%) | 0 (0.0%) |
| Total | 385 (100.0%) | 182 (100.0%) |
Household Vehicle Usage in East Carbon
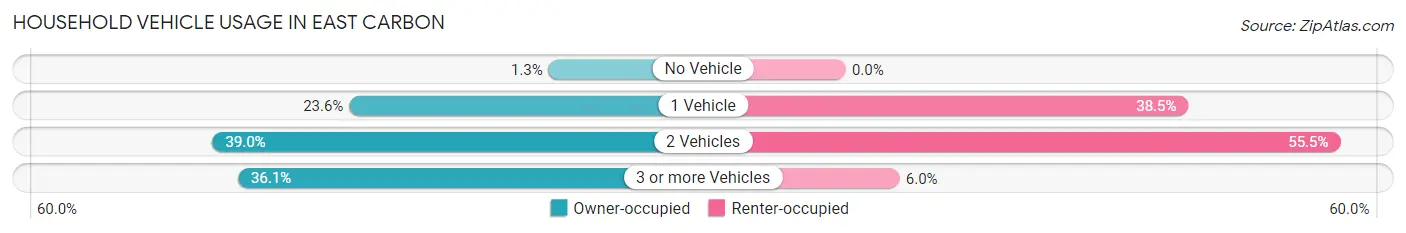
| Vehicles per Household | Owner-occupied | Renter-occupied |
| No Vehicle | 5 (1.3%) | 0 (0.0%) |
| 1 Vehicle | 91 (23.6%) | 70 (38.5%) |
| 2 Vehicles | 150 (39.0%) | 101 (55.5%) |
| 3 or more Vehicles | 139 (36.1%) | 11 (6.0%) |
| Total | 385 (100.0%) | 182 (100.0%) |
Real Estate & Mortgages in East Carbon
Real Estate and Mortgage Overview in East Carbon
| Characteristic | Without Mortgage | With Mortgage |
| Housing Units | 212 | 173 |
| Median Property Value | $69,400 | $83,200 |
| Median Household Income | $60,313 | $15 |
| Monthly Housing Costs | $272 | $0 |
| Real Estate Taxes | $549 | $7 |
Property Value by Mortgage Status in East Carbon
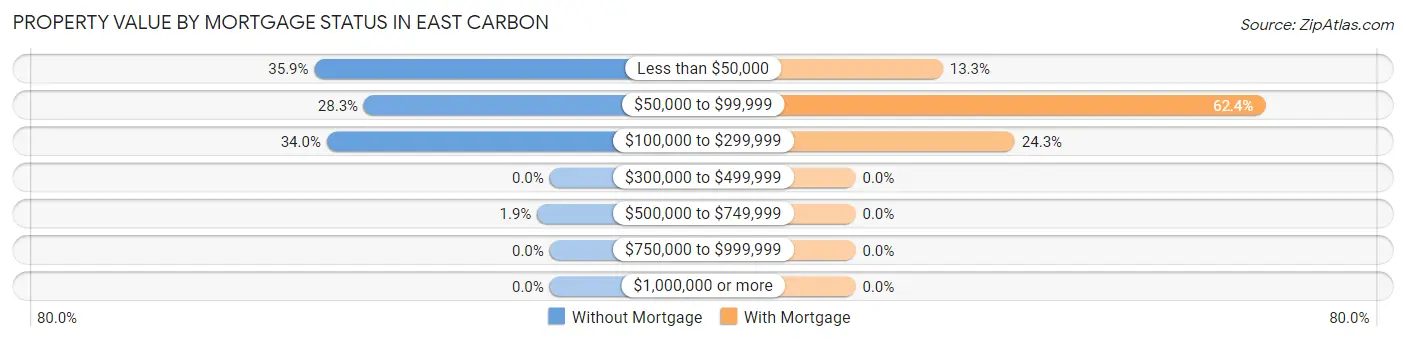
| Property Value | Without Mortgage | With Mortgage |
| Less than $50,000 | 76 (35.8%) | 23 (13.3%) |
| $50,000 to $99,999 | 60 (28.3%) | 108 (62.4%) |
| $100,000 to $299,999 | 72 (34.0%) | 42 (24.3%) |
| $300,000 to $499,999 | 0 (0.0%) | 0 (0.0%) |
| $500,000 to $749,999 | 4 (1.9%) | 0 (0.0%) |
| $750,000 to $999,999 | 0 (0.0%) | 0 (0.0%) |
| $1,000,000 or more | 0 (0.0%) | 0 (0.0%) |
| Total | 212 (100.0%) | 173 (100.0%) |
Household Income by Mortgage Status in East Carbon
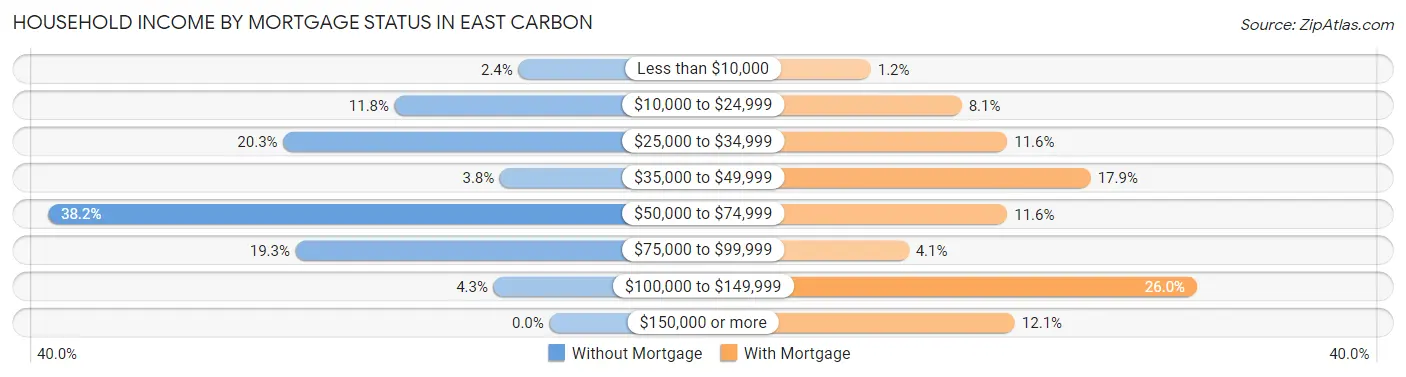
| Household Income | Without Mortgage | With Mortgage |
| Less than $10,000 | 5 (2.4%) | 2 (1.2%) |
| $10,000 to $24,999 | 25 (11.8%) | 14 (8.1%) |
| $25,000 to $34,999 | 43 (20.3%) | 20 (11.6%) |
| $35,000 to $49,999 | 8 (3.8%) | 31 (17.9%) |
| $50,000 to $74,999 | 81 (38.2%) | 20 (11.6%) |
| $75,000 to $99,999 | 41 (19.3%) | 7 (4.1%) |
| $100,000 to $149,999 | 9 (4.3%) | 45 (26.0%) |
| $150,000 or more | 0 (0.0%) | 21 (12.1%) |
| Total | 212 (100.0%) | 173 (100.0%) |
Property Value to Household Income Ratio in East Carbon
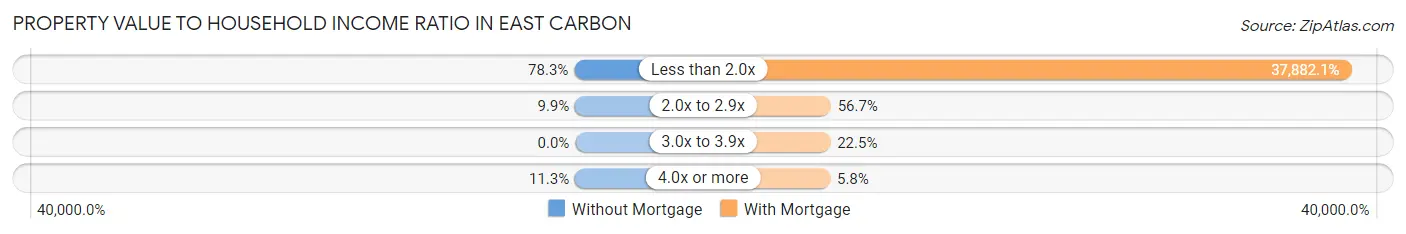
| Value-to-Income Ratio | Without Mortgage | With Mortgage |
| Less than 2.0x | 166 (78.3%) | 65,536 (37,882.1%) |
| 2.0x to 2.9x | 21 (9.9%) | 98 (56.7%) |
| 3.0x to 3.9x | 0 (0.0%) | 39 (22.5%) |
| 4.0x or more | 24 (11.3%) | 10 (5.8%) |
| Total | 212 (100.0%) | 173 (100.0%) |
Real Estate Taxes by Mortgage Status in East Carbon
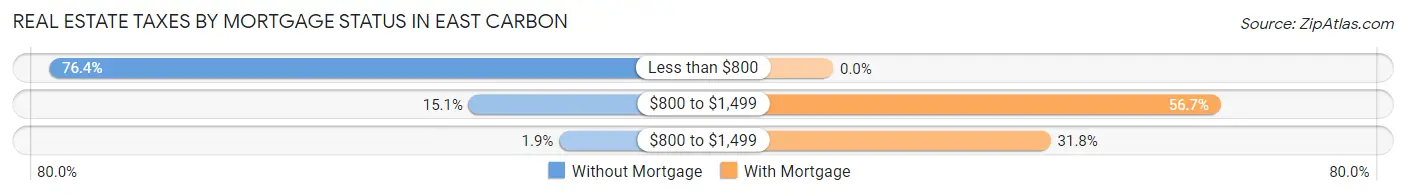
| Property Taxes | Without Mortgage | With Mortgage |
| Less than $800 | 162 (76.4%) | 0 (0.0%) |
| $800 to $1,499 | 32 (15.1%) | 98 (56.7%) |
| $800 to $1,499 | 4 (1.9%) | 55 (31.8%) |
| Total | 212 (100.0%) | 173 (100.0%) |
Health & Disability in East Carbon
Health Insurance Coverage by Age in East Carbon
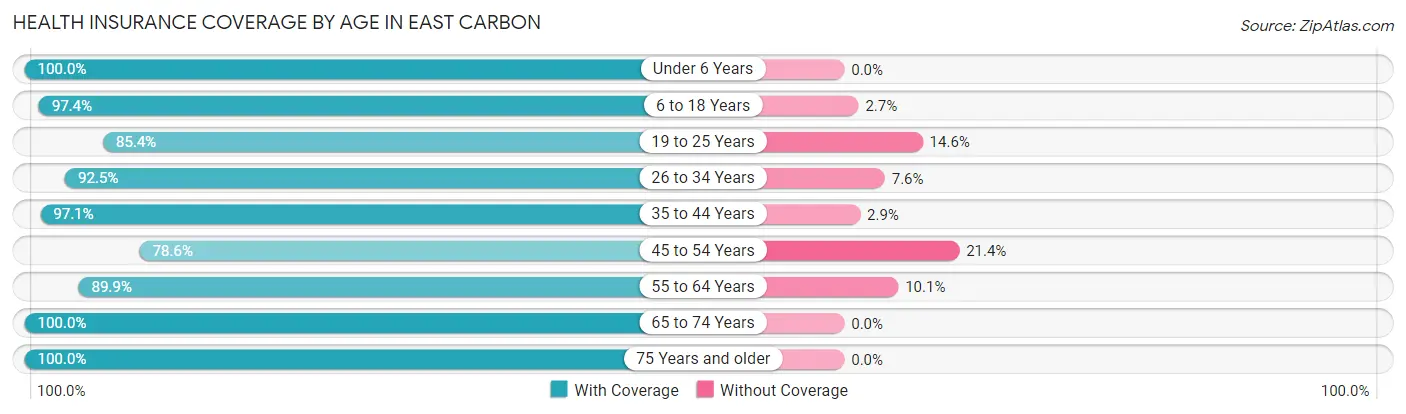
| Age Bracket | With Coverage | Without Coverage |
| Under 6 Years | 95 (100.0%) | 0 (0.0%) |
| 6 to 18 Years | 220 (97.4%) | 6 (2.6%) |
| 19 to 25 Years | 76 (85.4%) | 13 (14.6%) |
| 26 to 34 Years | 196 (92.4%) | 16 (7.5%) |
| 35 to 44 Years | 132 (97.1%) | 4 (2.9%) |
| 45 to 54 Years | 132 (78.6%) | 36 (21.4%) |
| 55 to 64 Years | 152 (89.9%) | 17 (10.1%) |
| 65 to 74 Years | 210 (100.0%) | 0 (0.0%) |
| 75 Years and older | 136 (100.0%) | 0 (0.0%) |
| Total | 1,349 (93.6%) | 92 (6.4%) |
Health Insurance Coverage by Citizenship Status in East Carbon
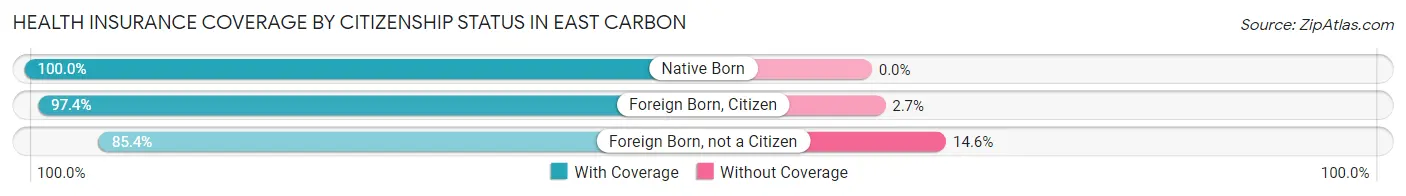
| Citizenship Status | With Coverage | Without Coverage |
| Native Born | 95 (100.0%) | 0 (0.0%) |
| Foreign Born, Citizen | 220 (97.4%) | 6 (2.6%) |
| Foreign Born, not a Citizen | 76 (85.4%) | 13 (14.6%) |
Health Insurance Coverage by Household Income in East Carbon
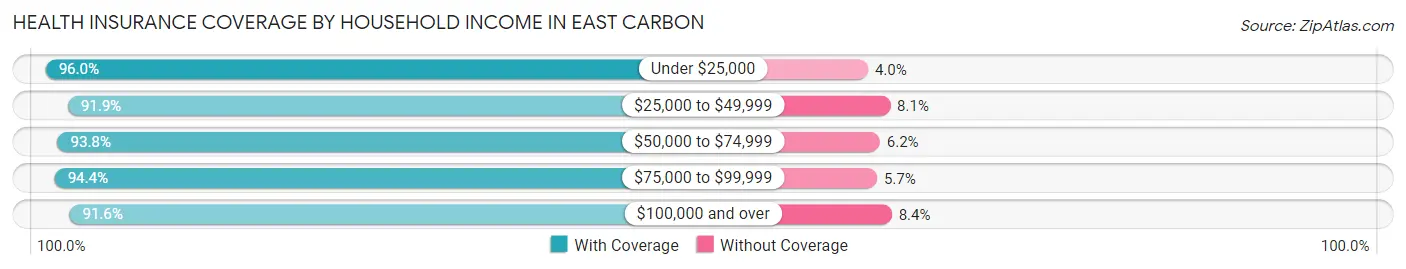
| Household Income | With Coverage | Without Coverage |
| Under $25,000 | 290 (96.0%) | 12 (4.0%) |
| $25,000 to $49,999 | 328 (91.9%) | 29 (8.1%) |
| $50,000 to $74,999 | 212 (93.8%) | 14 (6.2%) |
| $75,000 to $99,999 | 334 (94.4%) | 20 (5.7%) |
| $100,000 and over | 185 (91.6%) | 17 (8.4%) |
Public vs Private Health Insurance Coverage by Age in East Carbon
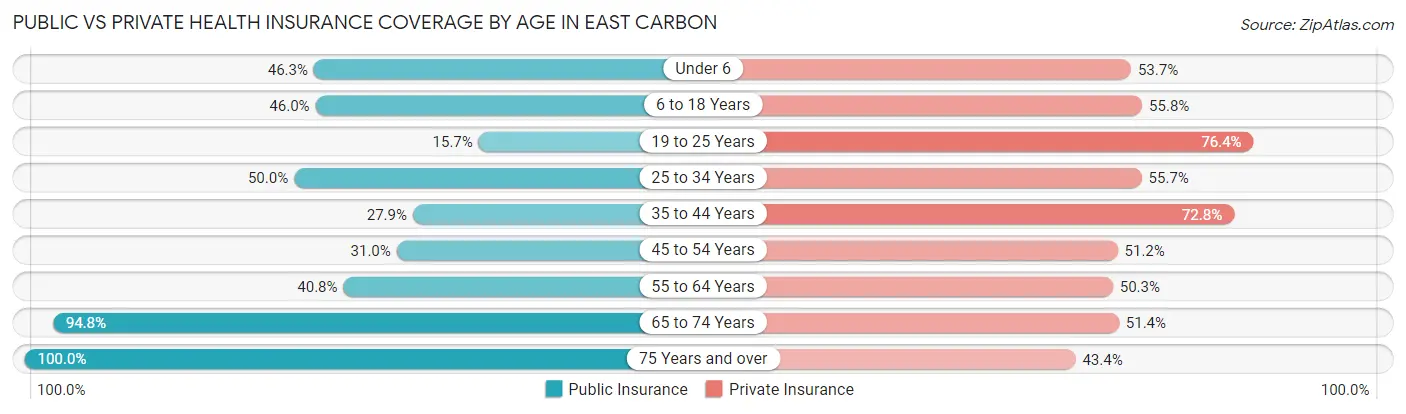
| Age Bracket | Public Insurance | Private Insurance |
| Under 6 | 44 (46.3%) | 51 (53.7%) |
| 6 to 18 Years | 104 (46.0%) | 126 (55.7%) |
| 19 to 25 Years | 14 (15.7%) | 68 (76.4%) |
| 25 to 34 Years | 106 (50.0%) | 118 (55.7%) |
| 35 to 44 Years | 38 (27.9%) | 99 (72.8%) |
| 45 to 54 Years | 52 (30.9%) | 86 (51.2%) |
| 55 to 64 Years | 69 (40.8%) | 85 (50.3%) |
| 65 to 74 Years | 199 (94.8%) | 108 (51.4%) |
| 75 Years and over | 136 (100.0%) | 59 (43.4%) |
| Total | 762 (52.9%) | 800 (55.5%) |
Disability Status by Sex by Age in East Carbon
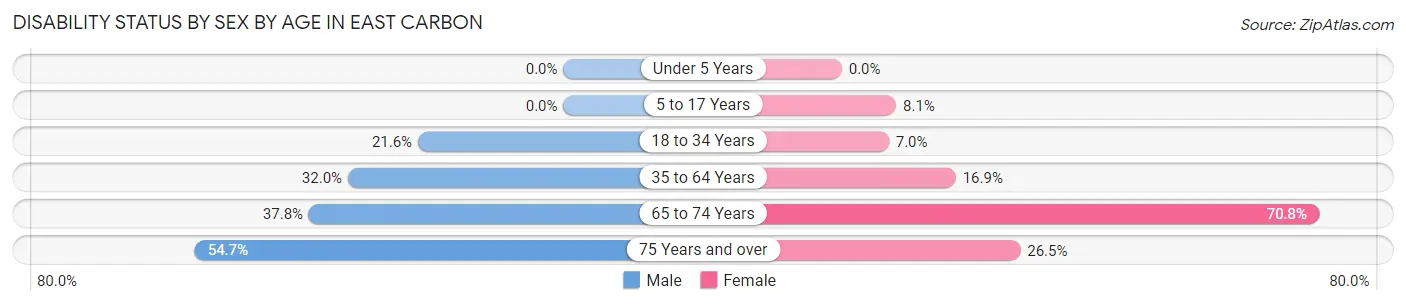
| Age Bracket | Male | Female |
| Under 5 Years | 0 (0.0%) | 0 (0.0%) |
| 5 to 17 Years | 0 (0.0%) | 10 (8.1%) |
| 18 to 34 Years | 38 (21.6%) | 9 (7.0%) |
| 35 to 64 Years | 87 (32.0%) | 34 (16.9%) |
| 65 to 74 Years | 34 (37.8%) | 85 (70.8%) |
| 75 Years and over | 29 (54.7%) | 22 (26.5%) |
Disability Class by Sex by Age in East Carbon
Disability Class: Hearing Difficulty
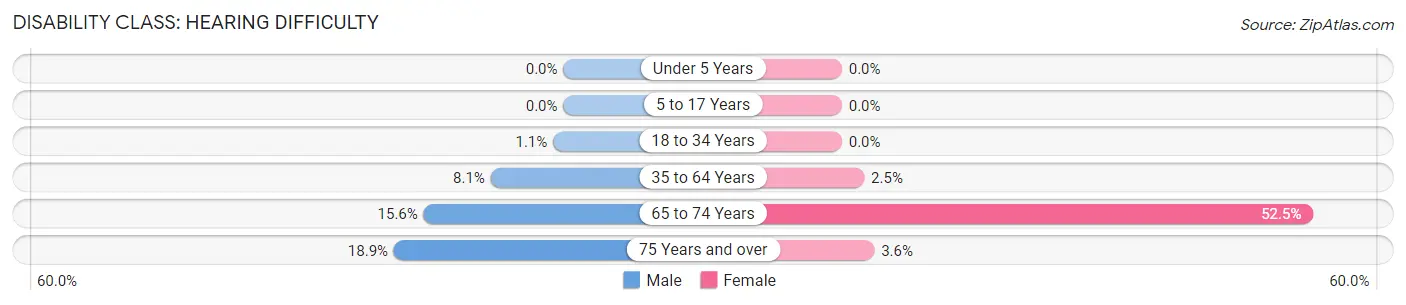
| Age Bracket | Male | Female |
| Under 5 Years | 0 (0.0%) | 0 (0.0%) |
| 5 to 17 Years | 0 (0.0%) | 0 (0.0%) |
| 18 to 34 Years | 2 (1.1%) | 0 (0.0%) |
| 35 to 64 Years | 22 (8.1%) | 5 (2.5%) |
| 65 to 74 Years | 14 (15.6%) | 63 (52.5%) |
| 75 Years and over | 10 (18.9%) | 3 (3.6%) |
Disability Class: Vision Difficulty
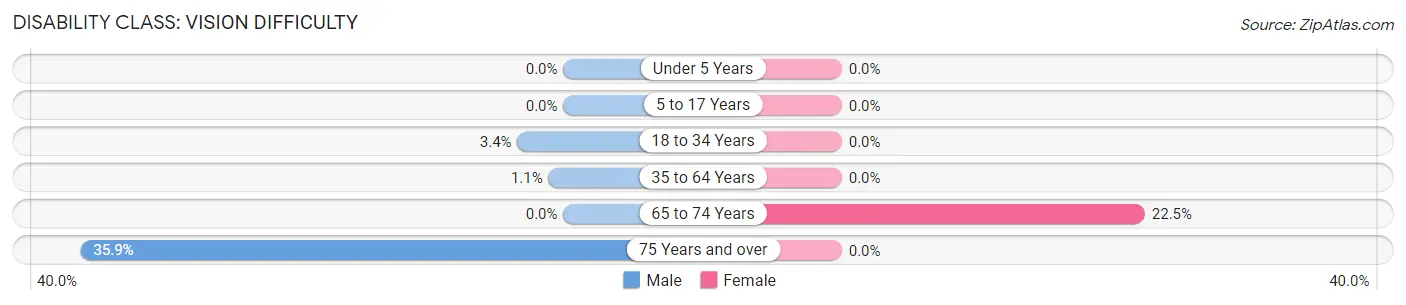
| Age Bracket | Male | Female |
| Under 5 Years | 0 (0.0%) | 0 (0.0%) |
| 5 to 17 Years | 0 (0.0%) | 0 (0.0%) |
| 18 to 34 Years | 6 (3.4%) | 0 (0.0%) |
| 35 to 64 Years | 3 (1.1%) | 0 (0.0%) |
| 65 to 74 Years | 0 (0.0%) | 27 (22.5%) |
| 75 Years and over | 19 (35.8%) | 0 (0.0%) |
Disability Class: Cognitive Difficulty
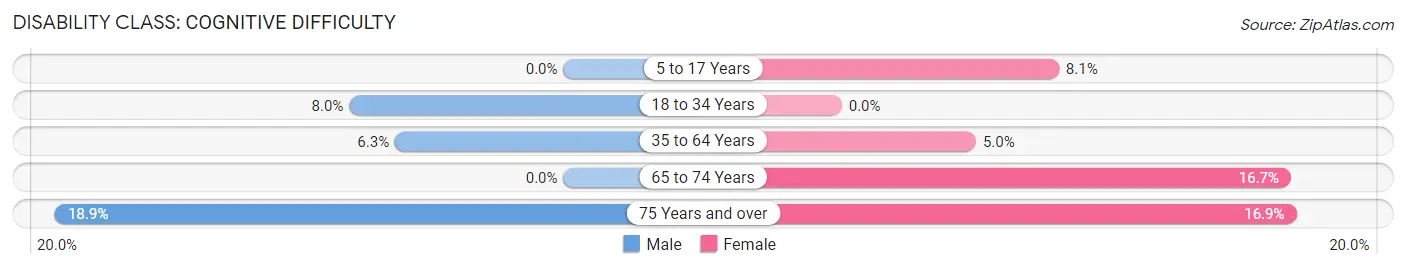
| Age Bracket | Male | Female |
| 5 to 17 Years | 0 (0.0%) | 10 (8.1%) |
| 18 to 34 Years | 14 (8.0%) | 0 (0.0%) |
| 35 to 64 Years | 17 (6.2%) | 10 (5.0%) |
| 65 to 74 Years | 0 (0.0%) | 20 (16.7%) |
| 75 Years and over | 10 (18.9%) | 14 (16.9%) |
Disability Class: Ambulatory Difficulty
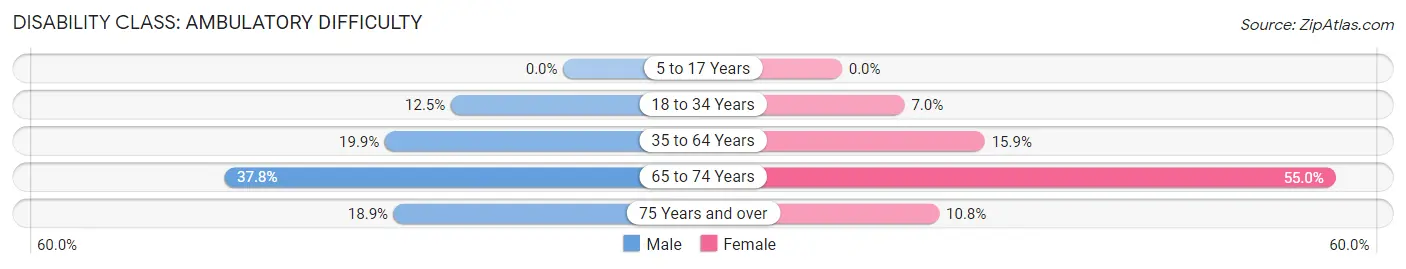
| Age Bracket | Male | Female |
| 5 to 17 Years | 0 (0.0%) | 0 (0.0%) |
| 18 to 34 Years | 22 (12.5%) | 9 (7.0%) |
| 35 to 64 Years | 54 (19.9%) | 32 (15.9%) |
| 65 to 74 Years | 34 (37.8%) | 66 (55.0%) |
| 75 Years and over | 10 (18.9%) | 9 (10.8%) |
Disability Class: Self-Care Difficulty
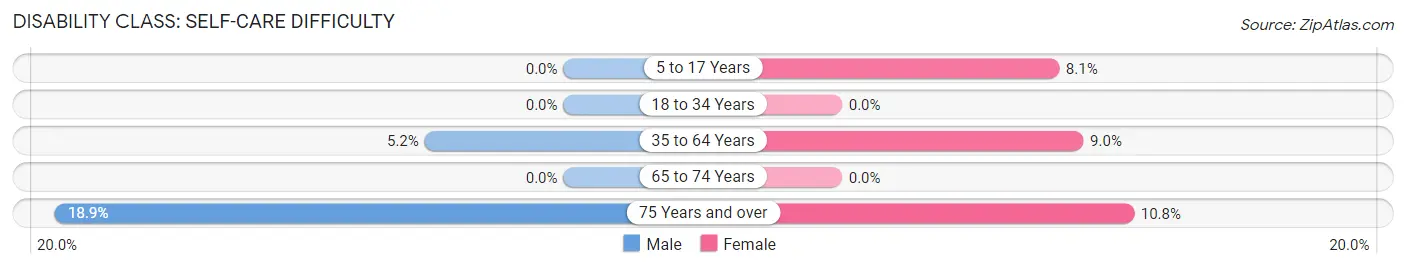
| Age Bracket | Male | Female |
| 5 to 17 Years | 0 (0.0%) | 10 (8.1%) |
| 18 to 34 Years | 0 (0.0%) | 0 (0.0%) |
| 35 to 64 Years | 14 (5.1%) | 18 (9.0%) |
| 65 to 74 Years | 0 (0.0%) | 0 (0.0%) |
| 75 Years and over | 10 (18.9%) | 9 (10.8%) |
Technology Access in East Carbon
Computing Device Access in East Carbon
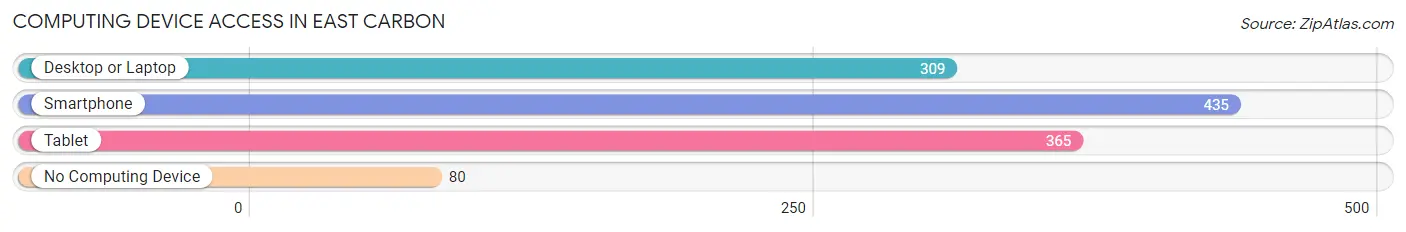
| Device Type | # Households | % Households |
| Desktop or Laptop | 309 | 54.5% |
| Smartphone | 435 | 76.7% |
| Tablet | 365 | 64.4% |
| No Computing Device | 80 | 14.1% |
| Total | 567 | 100.0% |
Internet Access in East Carbon
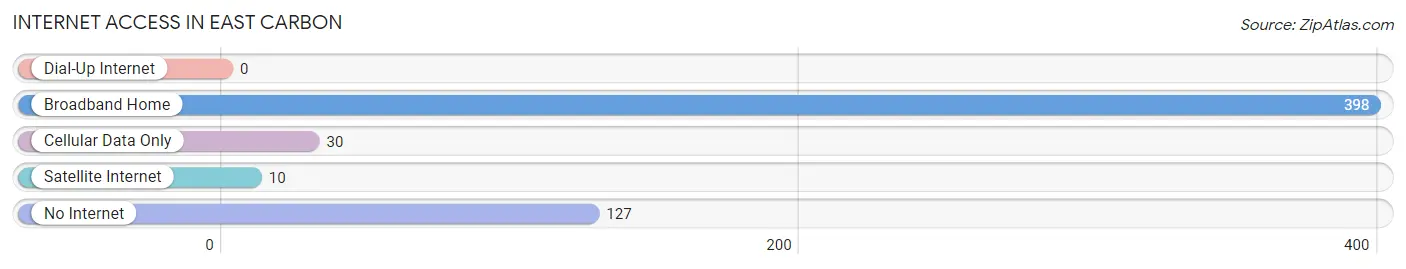
| Internet Type | # Households | % Households |
| Dial-Up Internet | 0 | 0.0% |
| Broadband Home | 398 | 70.2% |
| Cellular Data Only | 30 | 5.3% |
| Satellite Internet | 10 | 1.8% |
| No Internet | 127 | 22.4% |
| Total | 567 | 100.0% |
East Carbon Summary
East Carbon is a small city located in Carbon County, Utah. It is situated in the eastern part of the state, near the border with Colorado. The city has a population of approximately 1,500 people and is part of the Price Metropolitan Statistical Area.
Geography
East Carbon is located in the eastern part of Carbon County, Utah. It is situated at an elevation of 5,845 feet (1,782 m) above sea level. The city is located in the Uinta Basin, which is a large intermountain basin that covers much of northeastern Utah and southwestern Wyoming. The city is bordered by the Book Cliffs to the north, the Wasatch Plateau to the east, and the San Rafael Swell to the south. The city is located approximately 30 miles (48 km) east of Price, the county seat of Carbon County.
Climate
East Carbon has a semi-arid climate, with hot summers and cold winters. The average high temperature in July is 90°F (32°C), and the average low temperature in January is 16°F (-9°C). The city receives an average of 8.5 inches (21.6 cm) of precipitation per year, with most of it falling in the spring and summer months.
Demographics
As of the 2010 census, there were 1,521 people living in East Carbon. The racial makeup of the city was 91.2% White, 0.2% African American, 0.7% Native American, 0.2% Asian, 0.1% Pacific Islander, 5.3% from other races, and 2.3% from two or more races. Hispanic or Latino of any race were 11.2% of the population.
Economy
The economy of East Carbon is largely based on the mining and energy industries. The city is home to several coal mines, as well as oil and gas production. The city is also home to several manufacturing companies, including a plastics plant and a metal fabrication plant. The city is also home to several retail stores, restaurants, and other businesses.
Education
East Carbon is served by the Carbon School District. The district operates two elementary schools, one middle school, and one high school. The city is also home to a branch of the College of Eastern Utah, which offers a variety of associate and bachelor's degree programs.
Conclusion
East Carbon is a small city located in Carbon County, Utah. It is situated in the eastern part of the state, near the border with Colorado. The city has a population of approximately 1,500 people and is part of the Price Metropolitan Statistical Area. The economy of East Carbon is largely based on the mining and energy industries, and the city is also home to several manufacturing companies, retail stores, restaurants, and other businesses. The city is served by the Carbon School District, and is also home to a branch of the College of Eastern Utah.
Common Questions
What is Per Capita Income in East Carbon?
Per Capita income in East Carbon is $24,561.
What is the Median Family Income in East Carbon?
Median Family Income in East Carbon is $61,667.
What is the Median Household income in East Carbon?
Median Household Income in East Carbon is $52,554.
What is Income or Wage Gap in East Carbon?
Income or Wage Gap in East Carbon is 54.4%.
Women in East Carbon earn 45.6 cents for every dollar earned by a man.
What is Inequality or Gini Index in East Carbon?
Inequality or Gini Index in East Carbon is 0.38.
What is the Total Population of East Carbon?
Total Population of East Carbon is 1,441.
What is the Total Male Population of East Carbon?
Total Male Population of East Carbon is 764.
What is the Total Female Population of East Carbon?
Total Female Population of East Carbon is 677.
What is the Ratio of Males per 100 Females in East Carbon?
There are 112.85 Males per 100 Females in East Carbon.
What is the Ratio of Females per 100 Males in East Carbon?
There are 88.61 Females per 100 Males in East Carbon.
What is the Median Population Age in East Carbon?
Median Population Age in East Carbon is 40.4 Years.
What is the Average Family Size in East Carbon
Average Family Size in East Carbon is 3.0 People.
What is the Average Household Size in East Carbon
Average Household Size in East Carbon is 2.5 People.
How Large is the Labor Force in East Carbon?
There are 545 People in the Labor Forcein in East Carbon.
What is the Percentage of People in the Labor Force in East Carbon?
48.1% of People are in the Labor Force in East Carbon.
What is the Unemployment Rate in East Carbon?
Unemployment Rate in East Carbon is 14.5%.