Garden City, UT Map & Demographics
Garden City Map
Garden City Overview
$24,855
PER CAPITA INCOME
$66,731
AVG FAMILY INCOME
$63,125
AVG HOUSEHOLD INCOME
23.3%
WAGE / INCOME GAP [ % ]
76.7¢/ $1
WAGE / INCOME GAP [ $ ]
0.39
INEQUALITY / GINI INDEX
530
TOTAL POPULATION
300
MALE POPULATION
230
FEMALE POPULATION
130.43
MALES / 100 FEMALES
76.67
FEMALES / 100 MALES
36.5
MEDIAN AGE
3.6
AVG FAMILY SIZE
2.9
AVG HOUSEHOLD SIZE
219
LABOR FORCE [ PEOPLE ]
61.7%
PERCENT IN LABOR FORCE
3.2%
UNEMPLOYMENT RATE
Garden City Zip Codes
Garden City Area Codes
Income in Garden City
Income Overview in Garden City
Per Capita Income in Garden City is $24,855, while median incomes of families and households are $66,731 and $63,125 respectively.
| Characteristic | Number | Measure |
| Per Capita Income | 530 | $24,855 |
| Median Family Income | 130 | $66,731 |
| Mean Family Income | 130 | $88,368 |
| Median Household Income | 178 | $63,125 |
| Mean Household Income | 178 | $72,760 |
| Income Deficit | 130 | $0 |
| Wage / Income Gap (%) | 530 | 23.28% |
| Wage / Income Gap ($) | 530 | 76.72¢ per $1 |
| Gini / Inequality Index | 530 | 0.39 |
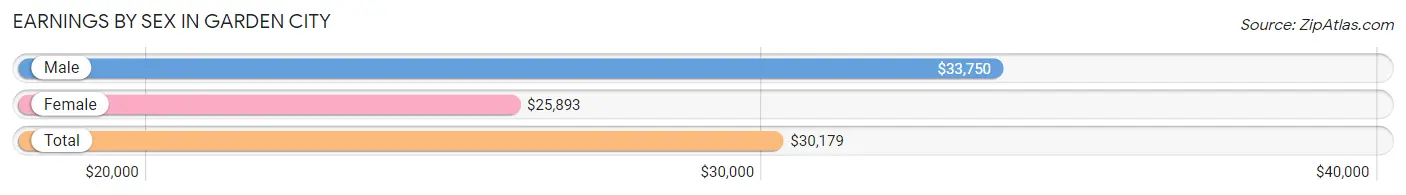
Earnings by Sex in Garden City
Average Earnings in Garden City are $30,179, $33,750 for men and $25,893 for women, a difference of 23.3%.
| Sex | Number | Average Earnings |
| Male | 140 (60.1%) | $33,750 |
| Female | 93 (39.9%) | $25,893 |
| Total | 233 (100.0%) | $30,179 |
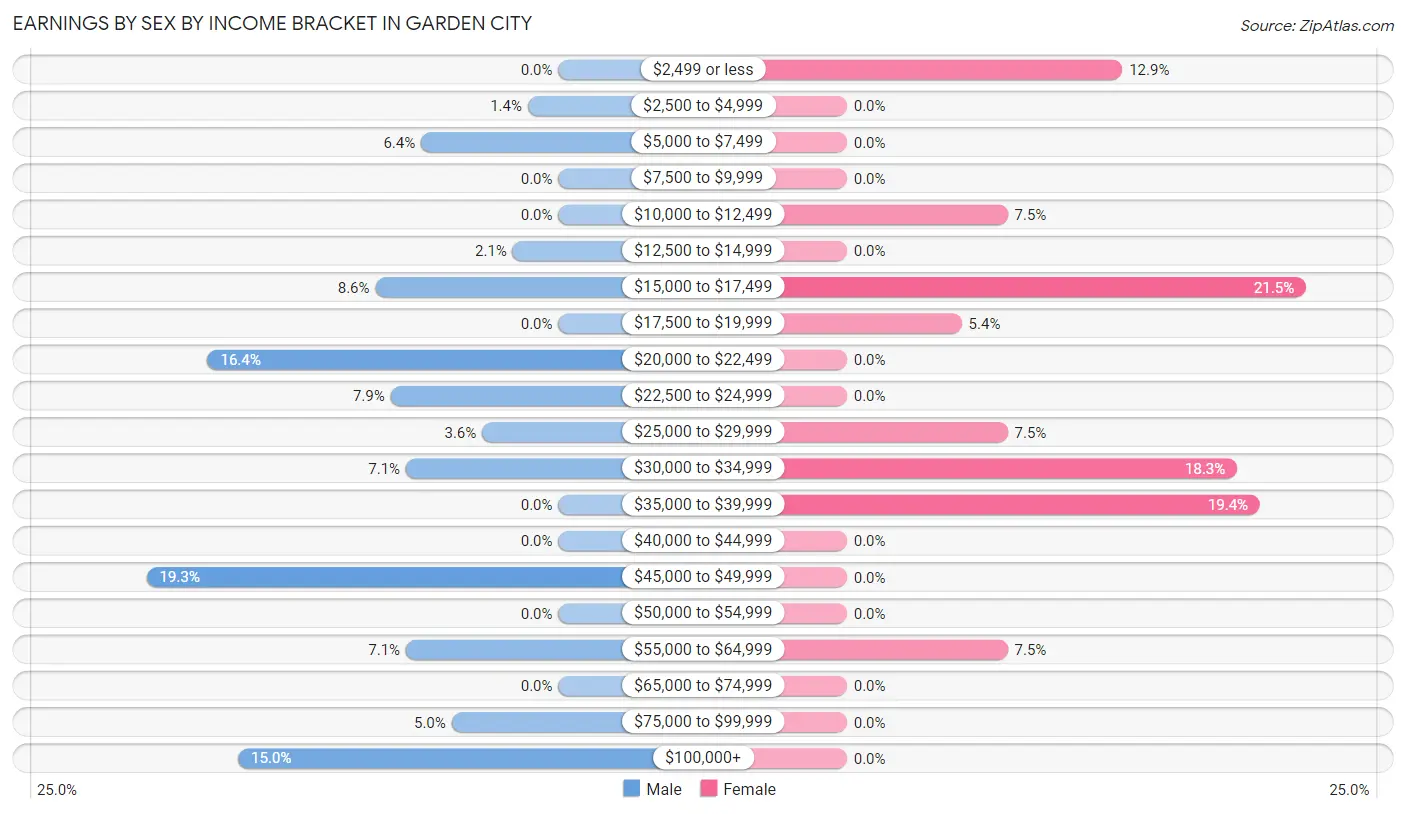
Earnings by Sex by Income Bracket in Garden City
The most common earnings brackets in Garden City are $45,000 to $49,999 for men (27 | 19.3%) and $15,000 to $17,499 for women (20 | 21.5%).
| Income | Male | Female |
| $2,499 or less | 0 (0.0%) | 12 (12.9%) |
| $2,500 to $4,999 | 2 (1.4%) | 0 (0.0%) |
| $5,000 to $7,499 | 9 (6.4%) | 0 (0.0%) |
| $7,500 to $9,999 | 0 (0.0%) | 0 (0.0%) |
| $10,000 to $12,499 | 0 (0.0%) | 7 (7.5%) |
| $12,500 to $14,999 | 3 (2.1%) | 0 (0.0%) |
| $15,000 to $17,499 | 12 (8.6%) | 20 (21.5%) |
| $17,500 to $19,999 | 0 (0.0%) | 5 (5.4%) |
| $20,000 to $22,499 | 23 (16.4%) | 0 (0.0%) |
| $22,500 to $24,999 | 11 (7.9%) | 0 (0.0%) |
| $25,000 to $29,999 | 5 (3.6%) | 7 (7.5%) |
| $30,000 to $34,999 | 10 (7.1%) | 17 (18.3%) |
| $35,000 to $39,999 | 0 (0.0%) | 18 (19.4%) |
| $40,000 to $44,999 | 0 (0.0%) | 0 (0.0%) |
| $45,000 to $49,999 | 27 (19.3%) | 0 (0.0%) |
| $50,000 to $54,999 | 0 (0.0%) | 0 (0.0%) |
| $55,000 to $64,999 | 10 (7.1%) | 7 (7.5%) |
| $65,000 to $74,999 | 0 (0.0%) | 0 (0.0%) |
| $75,000 to $99,999 | 7 (5.0%) | 0 (0.0%) |
| $100,000+ | 21 (15.0%) | 0 (0.0%) |
| Total | 140 (100.0%) | 93 (100.0%) |
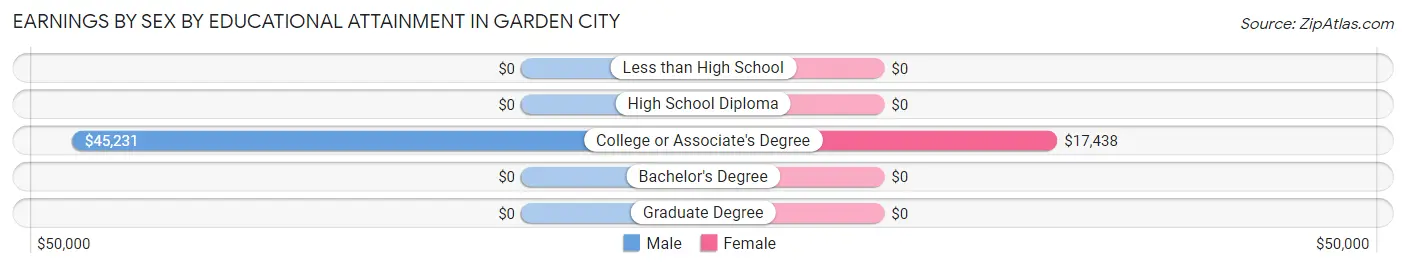
Earnings by Sex by Educational Attainment in Garden City
Average earnings in Garden City are $33,750 for men and $27,143 for women, a difference of 19.6%. Men with an educational attainment of college or associate's degree enjoy the highest average annual earnings of $45,231, while those with college or associate's degree education earn the least with $45,231. Women with an educational attainment of college or associate's degree earn the most with the average annual earnings of $17,438, while those with college or associate's degree education have the smallest earnings of $17,438.
| Educational Attainment | Male Income | Female Income |
| Less than High School | - | - |
| High School Diploma | - | - |
| College or Associate's Degree | $45,231 | $17,438 |
| Bachelor's Degree | - | - |
| Graduate Degree | - | - |
| Total | $33,750 | $27,143 |
Family Income in Garden City
Family Income Brackets in Garden City
According to the Garden City family income data, there are 53 families falling into the $50,000 to $74,999 income range, which is the most common income bracket and makes up 40.8% of all families.
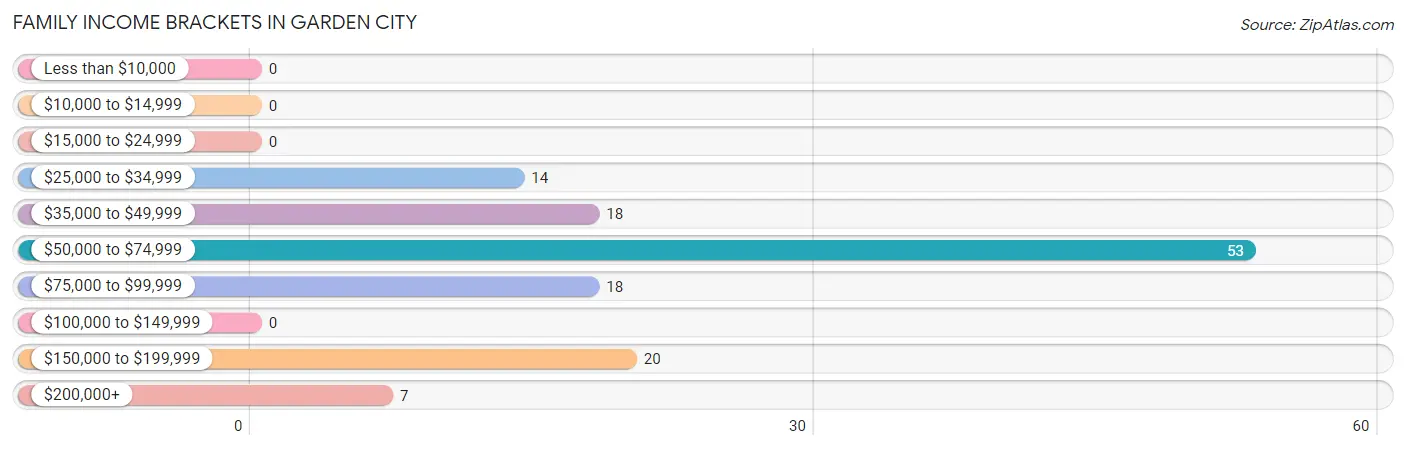
| Income Bracket | # Families | % Families |
| Less than $10,000 | 0 | 0.0% |
| $10,000 to $14,999 | 0 | 0.0% |
| $15,000 to $24,999 | 0 | 0.0% |
| $25,000 to $34,999 | 14 | 10.8% |
| $35,000 to $49,999 | 18 | 13.8% |
| $50,000 to $74,999 | 53 | 40.8% |
| $75,000 to $99,999 | 18 | 13.8% |
| $100,000 to $149,999 | 0 | 0.0% |
| $150,000 to $199,999 | 20 | 15.4% |
| $200,000+ | 7 | 5.4% |
Family Income by Famaliy Size in Garden City
2-person families (55 | 42.3%) account for the highest median family income in Garden City with $95,069 per family, while 2-person families (55 | 42.3%) have the highest median income of $47,534 per family member.
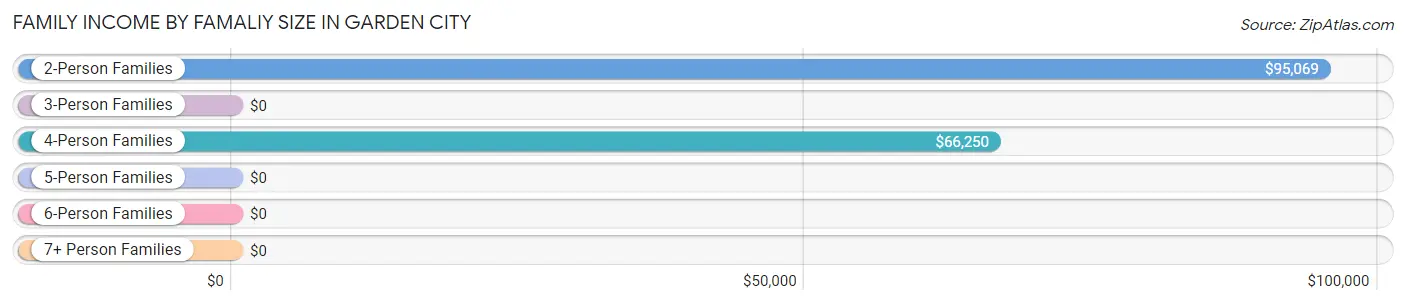
| Income Bracket | # Families | Median Income |
| 2-Person Families | 55 (42.3%) | $95,069 |
| 3-Person Families | 17 (13.1%) | $0 |
| 4-Person Families | 27 (20.8%) | $66,250 |
| 5-Person Families | 25 (19.2%) | $0 |
| 6-Person Families | 6 (4.6%) | $0 |
| 7+ Person Families | 0 (0.0%) | $0 |
| Total | 130 (100.0%) | $66,731 |
Family Income by Number of Earners in Garden City
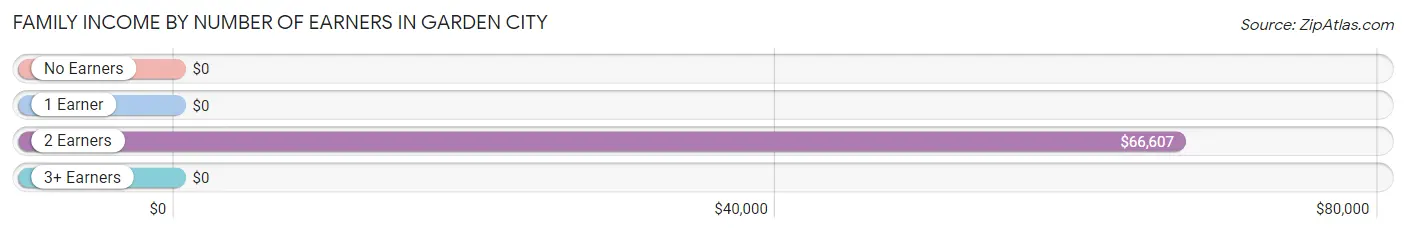
| Number of Earners | # Families | Median Income |
| No Earners | 6 (4.6%) | $0 |
| 1 Earner | 57 (43.9%) | $0 |
| 2 Earners | 43 (33.1%) | $66,607 |
| 3+ Earners | 24 (18.5%) | $0 |
| Total | 130 (100.0%) | $66,731 |
Household Income in Garden City
Household Income Brackets in Garden City
With 53 households falling in the category, the $50,000 to $74,999 income range is the most frequent in Garden City, accounting for 29.8% of all households.
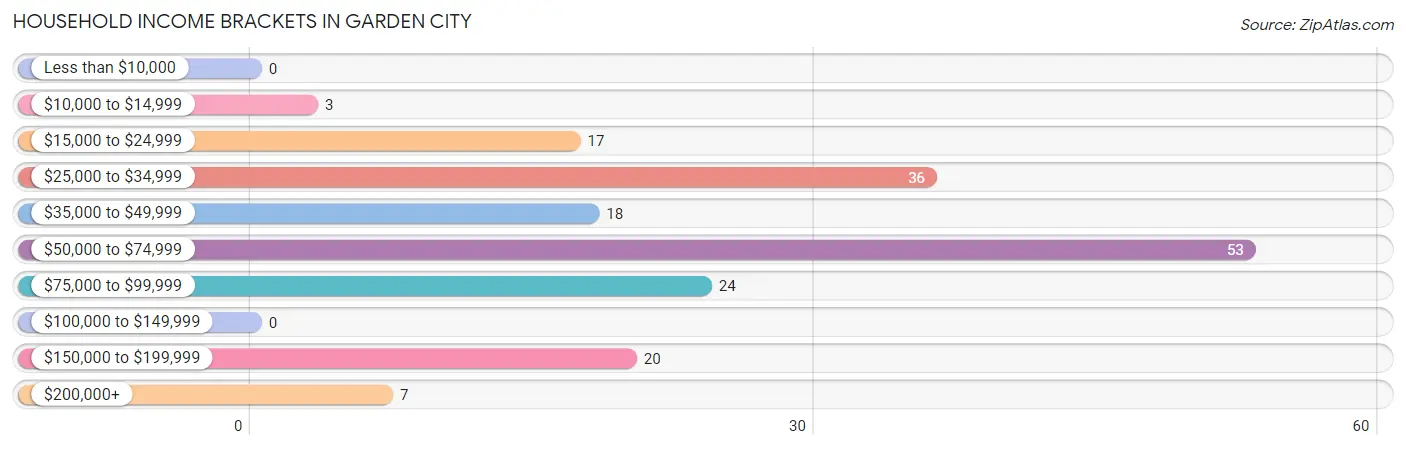
| Income Bracket | # Households | % Households |
| Less than $10,000 | 0 | 0.0% |
| $10,000 to $14,999 | 3 | 1.7% |
| $15,000 to $24,999 | 17 | 9.6% |
| $25,000 to $34,999 | 36 | 20.2% |
| $35,000 to $49,999 | 18 | 10.1% |
| $50,000 to $74,999 | 53 | 29.8% |
| $75,000 to $99,999 | 24 | 13.5% |
| $100,000 to $149,999 | 0 | 0.0% |
| $150,000 to $199,999 | 20 | 11.2% |
| $200,000+ | 7 | 3.9% |
Household Income by Householder Age in Garden City
The median household income in Garden City is $63,125, with the highest median household income of $63,021 found in the 45 to 64 years age bracket for the primary householder. A total of 25 households (14.0%) fall into this category.
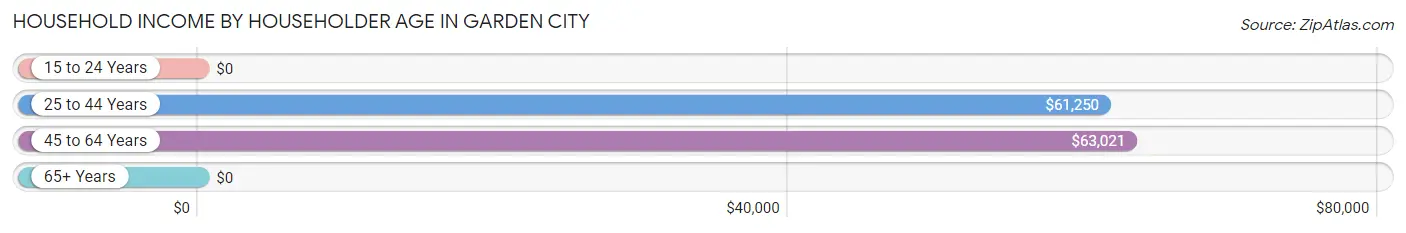
| Income Bracket | # Households | Median Income |
| 15 to 24 Years | 0 (0.0%) | $0 |
| 25 to 44 Years | 51 (28.6%) | $61,250 |
| 45 to 64 Years | 25 (14.0%) | $63,021 |
| 65+ Years | 102 (57.3%) | $0 |
| Total | 178 (100.0%) | $63,125 |
Poverty in Garden City
Income Below Poverty by Sex and Age in Garden City
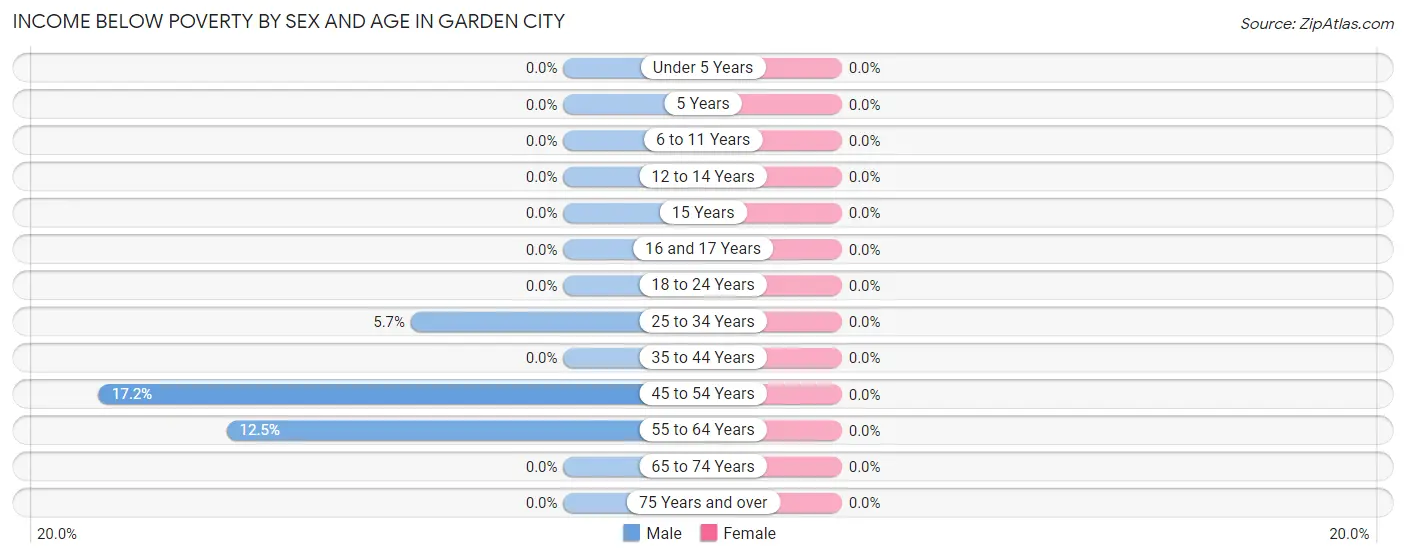
| Age Bracket | Male | Female |
| Under 5 Years | 0 (0.0%) | 0 (0.0%) |
| 5 Years | 0 (0.0%) | 0 (0.0%) |
| 6 to 11 Years | 0 (0.0%) | 0 (0.0%) |
| 12 to 14 Years | 0 (0.0%) | 0 (0.0%) |
| 15 Years | 0 (0.0%) | 0 (0.0%) |
| 16 and 17 Years | 0 (0.0%) | 0 (0.0%) |
| 18 to 24 Years | 0 (0.0%) | 0 (0.0%) |
| 25 to 34 Years | 3 (5.7%) | 0 (0.0%) |
| 35 to 44 Years | 0 (0.0%) | 0 (0.0%) |
| 45 to 54 Years | 5 (17.2%) | 0 (0.0%) |
| 55 to 64 Years | 3 (12.5%) | 0 (0.0%) |
| 65 to 74 Years | 0 (0.0%) | 0 (0.0%) |
| 75 Years and over | 0 (0.0%) | 0 (0.0%) |
| Total | 11 (3.7%) | 0 (0.0%) |
Income Above Poverty by Sex and Age in Garden City
According to the poverty statistics in Garden City, males aged under 5 years and females aged under 5 years are the age groups that are most secure financially, with 100.0% of males and 100.0% of females in these age groups living above the poverty line.
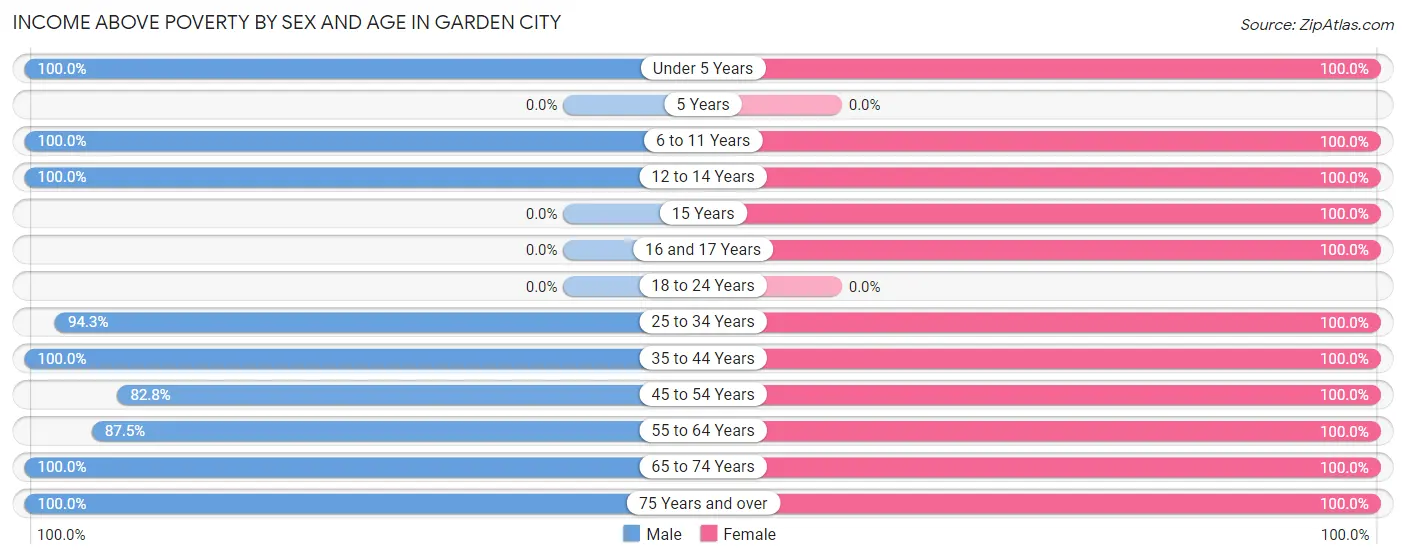
| Age Bracket | Male | Female |
| Under 5 Years | 24 (100.0%) | 16 (100.0%) |
| 5 Years | 0 (0.0%) | 0 (0.0%) |
| 6 to 11 Years | 46 (100.0%) | 34 (100.0%) |
| 12 to 14 Years | 6 (100.0%) | 37 (100.0%) |
| 15 Years | 0 (0.0%) | 12 (100.0%) |
| 16 and 17 Years | 0 (0.0%) | 12 (100.0%) |
| 18 to 24 Years | 0 (0.0%) | 0 (0.0%) |
| 25 to 34 Years | 50 (94.3%) | 7 (100.0%) |
| 35 to 44 Years | 20 (100.0%) | 45 (100.0%) |
| 45 to 54 Years | 24 (82.8%) | 7 (100.0%) |
| 55 to 64 Years | 21 (87.5%) | 3 (100.0%) |
| 65 to 74 Years | 69 (100.0%) | 33 (100.0%) |
| 75 Years and over | 29 (100.0%) | 24 (100.0%) |
| Total | 289 (96.3%) | 230 (100.0%) |
Income Below Poverty Among Married-Couple Families in Garden City
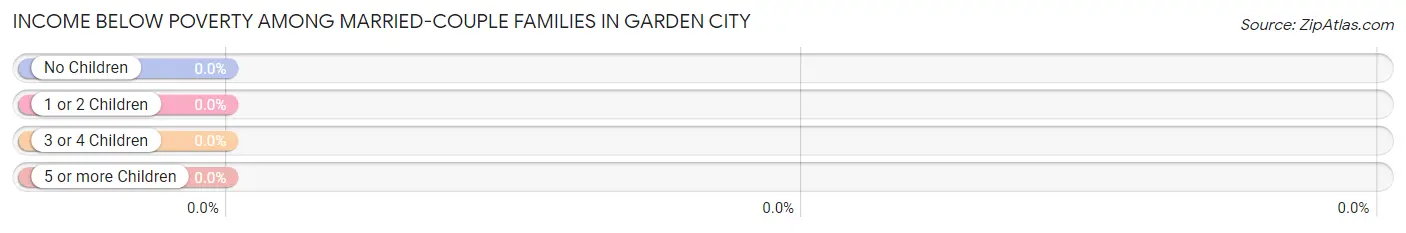
| Children | Above Poverty | Below Poverty |
| No Children | 60 (100.0%) | 0 (0.0%) |
| 1 or 2 Children | 22 (100.0%) | 0 (0.0%) |
| 3 or 4 Children | 31 (100.0%) | 0 (0.0%) |
| 5 or more Children | 0 (0.0%) | 0 (0.0%) |
| Total | 113 (100.0%) | 0 (0.0%) |
Income Below Poverty Among Single-Parent Households in Garden City
| Children | Single Father | Single Mother |
| No Children | 0 (0.0%) | 0 (0.0%) |
| 1 or 2 Children | 0 (0.0%) | 0 (0.0%) |
| 3 or 4 Children | 0 (0.0%) | 0 (0.0%) |
| 5 or more Children | 0 (0.0%) | 0 (0.0%) |
| Total | 0 (0.0%) | 0 (0.0%) |
Income Below Poverty Among Married-Couple vs Single-Parent Households in Garden City
| Children | Married-Couple Families | Single-Parent Households |
| No Children | 0 (0.0%) | 0 (0.0%) |
| 1 or 2 Children | 0 (0.0%) | 0 (0.0%) |
| 3 or 4 Children | 0 (0.0%) | 0 (0.0%) |
| 5 or more Children | 0 (0.0%) | 0 (0.0%) |
| Total | 0 (0.0%) | 0 (0.0%) |
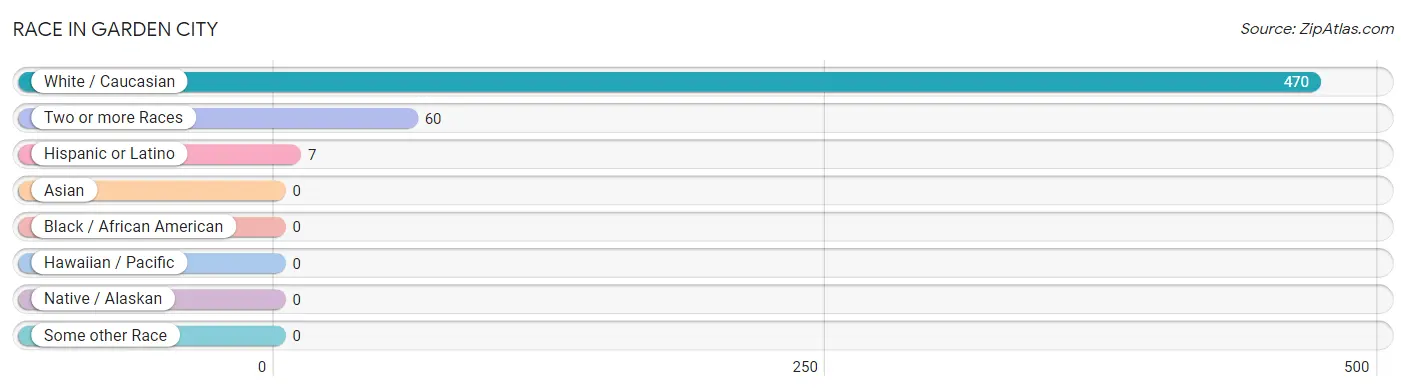
Race in Garden City
The most populous races in Garden City are White / Caucasian (470 | 88.7%), Two or more Races (60 | 11.3%), and Hispanic or Latino (7 | 1.3%).
| Race | # Population | % Population |
| Asian | 0 | 0.0% |
| Black / African American | 0 | 0.0% |
| Hawaiian / Pacific | 0 | 0.0% |
| Hispanic or Latino | 7 | 1.3% |
| Native / Alaskan | 0 | 0.0% |
| White / Caucasian | 470 | 88.7% |
| Two or more Races | 60 | 11.3% |
| Some other Race | 0 | 0.0% |
| Total | 530 | 100.0% |
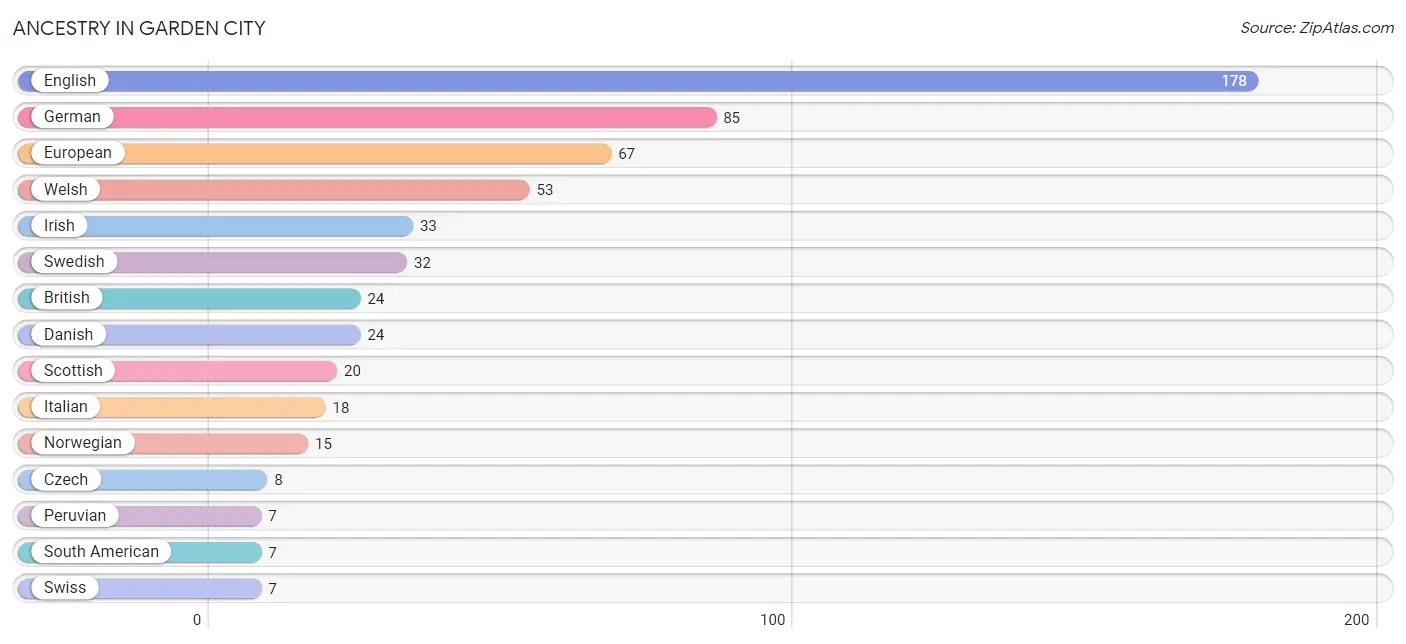
Ancestry in Garden City
The most populous ancestries reported in Garden City are English (178 | 33.6%), German (85 | 16.0%), European (67 | 12.6%), Welsh (53 | 10.0%), and Irish (33 | 6.2%), together accounting for 78.5% of all Garden City residents.
| Ancestry | # Population | % Population |
| British | 24 | 4.5% |
| Czech | 8 | 1.5% |
| Danish | 24 | 4.5% |
| English | 178 | 33.6% |
| European | 67 | 12.6% |
| German | 85 | 16.0% |
| Irish | 33 | 6.2% |
| Italian | 18 | 3.4% |
| Northern European | 4 | 0.7% |
| Norwegian | 15 | 2.8% |
| Peruvian | 7 | 1.3% |
| Scandinavian | 3 | 0.6% |
| Scottish | 20 | 3.8% |
| South American | 7 | 1.3% |
| Swedish | 32 | 6.0% |
| Swiss | 7 | 1.3% |
| Welsh | 53 | 10.0% | View All 17 Rows |
Immigrants in Garden City
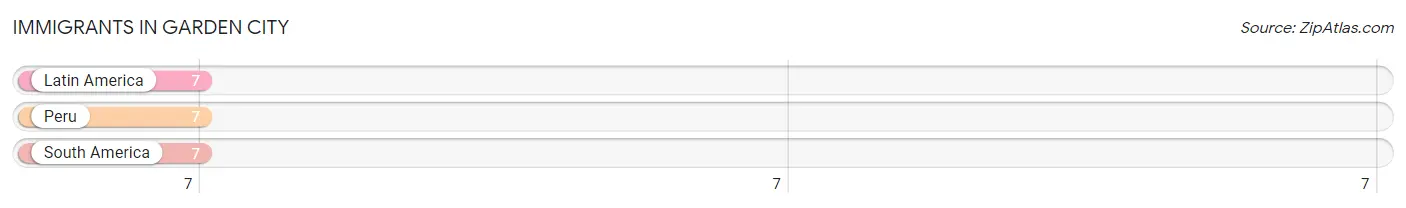
The most numerous immigrant groups reported in Garden City came from Latin America (7 | 1.3%), Peru (7 | 1.3%), and South America (7 | 1.3%), together accounting for 4.0% of all Garden City residents.
| Immigration Origin | # Population | % Population |
| Latin America | 7 | 1.3% |
| Peru | 7 | 1.3% |
| South America | 7 | 1.3% | View All 3 Rows |
Sex and Age in Garden City
Sex and Age in Garden City
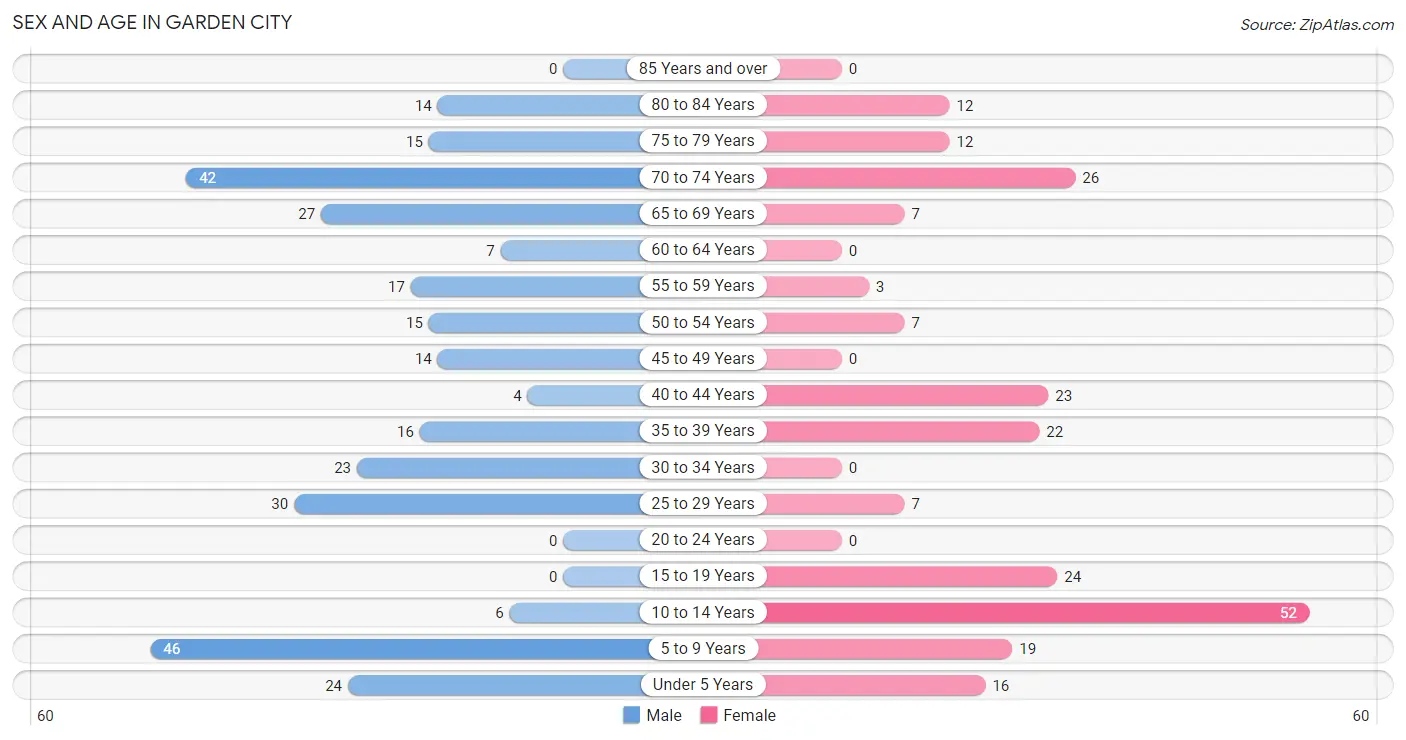
The most populous age groups in Garden City are 5 to 9 Years (46 | 15.3%) for men and 10 to 14 Years (52 | 22.6%) for women.
| Age Bracket | Male | Female |
| Under 5 Years | 24 (8.0%) | 16 (7.0%) |
| 5 to 9 Years | 46 (15.3%) | 19 (8.3%) |
| 10 to 14 Years | 6 (2.0%) | 52 (22.6%) |
| 15 to 19 Years | 0 (0.0%) | 24 (10.4%) |
| 20 to 24 Years | 0 (0.0%) | 0 (0.0%) |
| 25 to 29 Years | 30 (10.0%) | 7 (3.0%) |
| 30 to 34 Years | 23 (7.7%) | 0 (0.0%) |
| 35 to 39 Years | 16 (5.3%) | 22 (9.6%) |
| 40 to 44 Years | 4 (1.3%) | 23 (10.0%) |
| 45 to 49 Years | 14 (4.7%) | 0 (0.0%) |
| 50 to 54 Years | 15 (5.0%) | 7 (3.0%) |
| 55 to 59 Years | 17 (5.7%) | 3 (1.3%) |
| 60 to 64 Years | 7 (2.3%) | 0 (0.0%) |
| 65 to 69 Years | 27 (9.0%) | 7 (3.0%) |
| 70 to 74 Years | 42 (14.0%) | 26 (11.3%) |
| 75 to 79 Years | 15 (5.0%) | 12 (5.2%) |
| 80 to 84 Years | 14 (4.7%) | 12 (5.2%) |
| 85 Years and over | 0 (0.0%) | 0 (0.0%) |
| Total | 300 (100.0%) | 230 (100.0%) |
Families and Households in Garden City
Median Family Size in Garden City
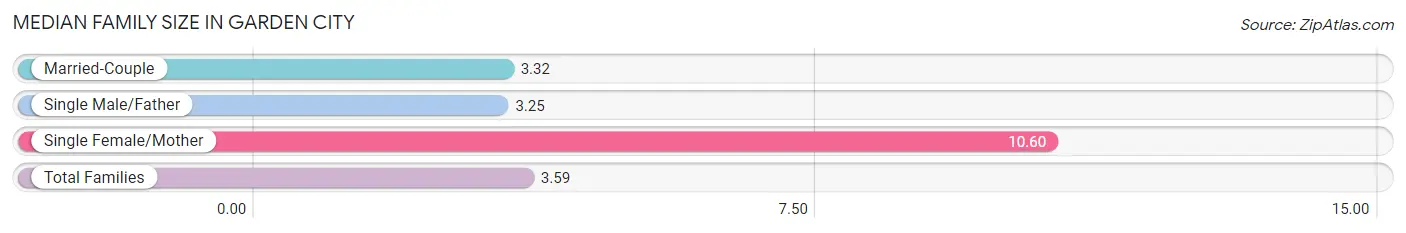
The median family size in Garden City is 3.59 persons per family, with single female/mother families (5 | 3.8%) accounting for the largest median family size of 10.6 persons per family. On the other hand, single male/father families (12 | 9.2%) represent the smallest median family size with 3.25 persons per family.
| Family Type | # Families | Family Size |
| Married-Couple | 113 (86.9%) | 3.32 |
| Single Male/Father | 12 (9.2%) | 3.25 |
| Single Female/Mother | 5 (3.8%) | 10.60 |
| Total Families | 130 (100.0%) | 3.59 |
Median Household Size in Garden City
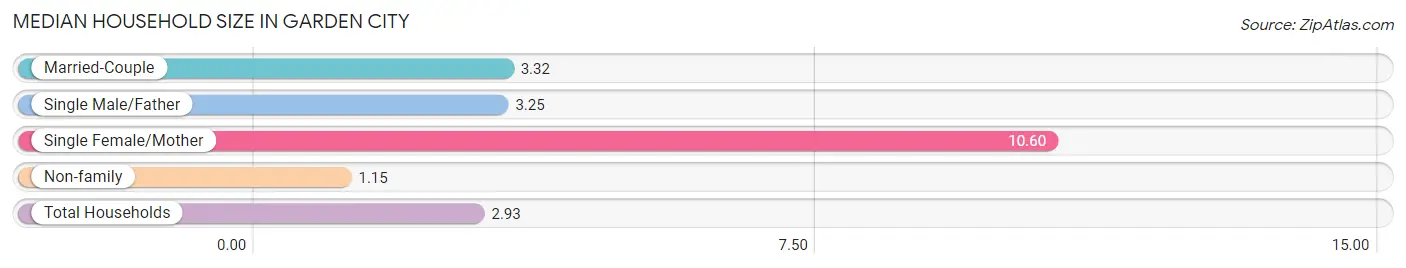
The median household size in Garden City is 2.93 persons per household, with single female/mother households (5 | 2.8%) accounting for the largest median household size of 10.6 persons per household. non-family households (48 | 27.0%) represent the smallest median household size with 1.15 persons per household.
| Household Type | # Households | Household Size |
| Married-Couple | 113 (63.5%) | 3.32 |
| Single Male/Father | 12 (6.7%) | 3.25 |
| Single Female/Mother | 5 (2.8%) | 10.60 |
| Non-family | 48 (27.0%) | 1.15 |
| Total Households | 178 (100.0%) | 2.93 |
Household Size by Marriage Status in Garden City
Out of a total of 178 households in Garden City, 130 (73.0%) are family households, while 48 (27.0%) are nonfamily households. The most numerous type of family households are 2-person households, comprising 55, and the most common type of nonfamily households are 1-person households, comprising 42.
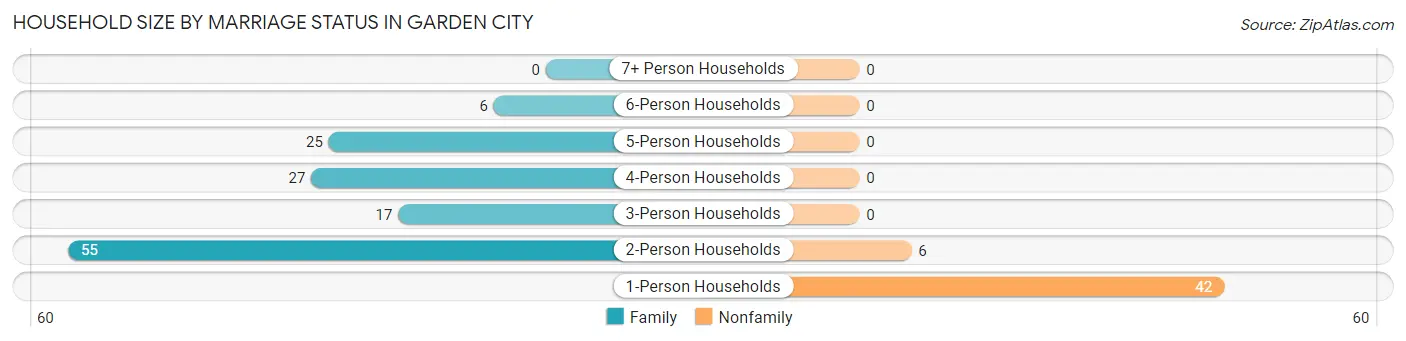
| Household Size | Family Households | Nonfamily Households |
| 1-Person Households | - | 42 (23.6%) |
| 2-Person Households | 55 (30.9%) | 6 (3.4%) |
| 3-Person Households | 17 (9.6%) | 0 (0.0%) |
| 4-Person Households | 27 (15.2%) | 0 (0.0%) |
| 5-Person Households | 25 (14.0%) | 0 (0.0%) |
| 6-Person Households | 6 (3.4%) | 0 (0.0%) |
| 7+ Person Households | 0 (0.0%) | 0 (0.0%) |
| Total | 130 (73.0%) | 48 (27.0%) |
Female Fertility in Garden City
Fertility by Age in Garden City
| Age Bracket | Women with Births | Births / 1,000 Women |
| 15 to 19 years | 0 (0.0%) | 0.0 |
| 20 to 34 years | 0 (0.0%) | 0.0 |
| 35 to 50 years | 0 (0.0%) | 0.0 |
| Total | 0 (0.0%) | 0.0 |
Fertility by Age by Marriage Status in Garden City
| Age Bracket | Married | Unmarried |
| 15 to 19 years | 0 (0.0%) | 0 (0.0%) |
| 20 to 34 years | 0 (0.0%) | 0 (0.0%) |
| 35 to 50 years | 0 (0.0%) | 0 (0.0%) |
| Total | 0 (0.0%) | 0 (0.0%) |
Fertility by Education in Garden City
| Educational Attainment | Women with Births | Births / 1,000 Women |
| Less than High School | 0 (0.0%) | 0.0 |
| High School Diploma | 0 (0.0%) | 0.0 |
| College or Associate's Degree | 0 (0.0%) | 0.0 |
| Bachelor's Degree | 0 (0.0%) | 0.0 |
| Graduate Degree | 0 (0.0%) | 0.0 |
| Total | 0 (0.0%) | 0.0 |
Fertility by Education by Marriage Status in Garden City
| Educational Attainment | Married | Unmarried |
| Less than High School | 0 (0.0%) | 0 (0.0%) |
| High School Diploma | 0 (0.0%) | 0 (0.0%) |
| College or Associate's Degree | 0 (0.0%) | 0 (0.0%) |
| Bachelor's Degree | 0 (0.0%) | 0 (0.0%) |
| Graduate Degree | 0 (0.0%) | 0 (0.0%) |
| Total | 0 (0.0%) | 0 (0.0%) |
Employment Characteristics in Garden City
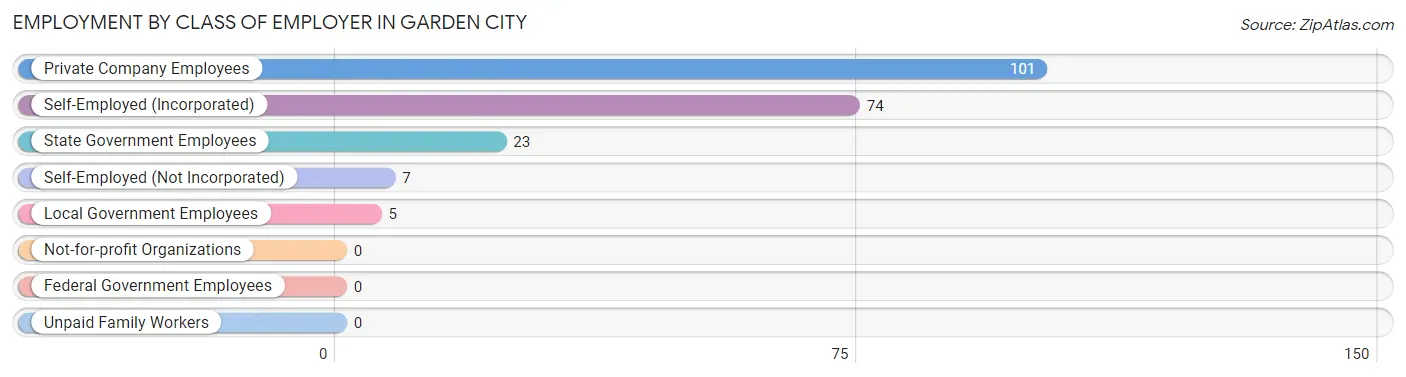
Employment by Class of Employer in Garden City
Among the 210 employed individuals in Garden City, private company employees (101 | 48.1%), self-employed (incorporated) (74 | 35.2%), and state government employees (23 | 11.0%) make up the most common classes of employment.
| Employer Class | # Employees | % Employees |
| Private Company Employees | 101 | 48.1% |
| Self-Employed (Incorporated) | 74 | 35.2% |
| Self-Employed (Not Incorporated) | 7 | 3.3% |
| Not-for-profit Organizations | 0 | 0.0% |
| Local Government Employees | 5 | 2.4% |
| State Government Employees | 23 | 11.0% |
| Federal Government Employees | 0 | 0.0% |
| Unpaid Family Workers | 0 | 0.0% |
| Total | 210 | 100.0% |
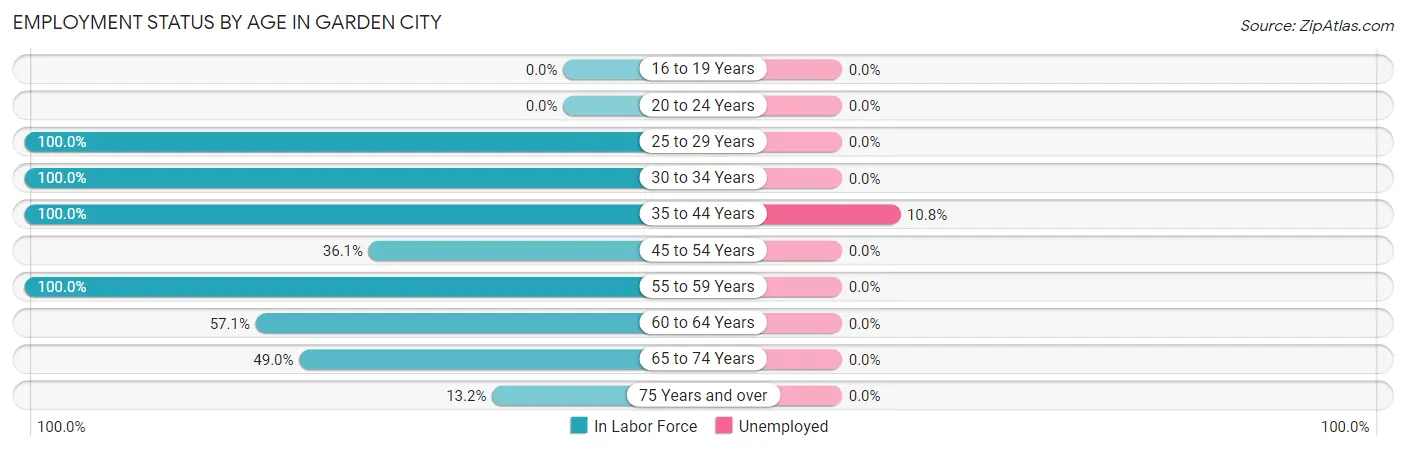
Employment Status by Age in Garden City
According to the labor force statistics for Garden City, out of the total population over 16 years of age (355), 61.7% or 219 individuals are in the labor force, with 3.2% or 7 of them unemployed. The age group with the highest labor force participation rate is 25 to 29 years, with 100.0% or 37 individuals in the labor force. Within the labor force, the 35 to 44 years age range has the highest percentage of unemployed individuals, with 10.8% or 7 of them being unemployed.
| Age Bracket | In Labor Force | Unemployed |
| 16 to 19 Years | 0 (0.0%) | 0 (0.0%) |
| 20 to 24 Years | 0 (0.0%) | 0 (0.0%) |
| 25 to 29 Years | 37 (100.0%) | 0 (0.0%) |
| 30 to 34 Years | 23 (100.0%) | 0 (0.0%) |
| 35 to 44 Years | 65 (100.0%) | 7 (10.8%) |
| 45 to 54 Years | 13 (36.1%) | 0 (0.0%) |
| 55 to 59 Years | 20 (100.0%) | 0 (0.0%) |
| 60 to 64 Years | 4 (57.1%) | 0 (0.0%) |
| 65 to 74 Years | 50 (49.0%) | 0 (0.0%) |
| 75 Years and over | 7 (13.2%) | 0 (0.0%) |
| Total | 219 (61.7%) | 7 (3.2%) |
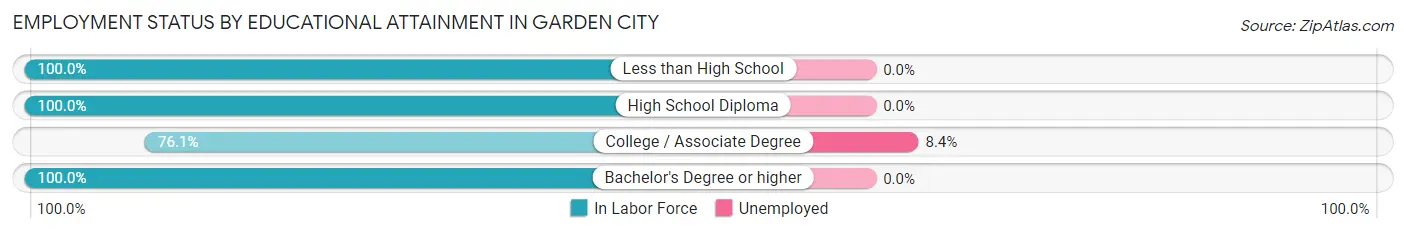
Employment Status by Educational Attainment in Garden City
According to labor force statistics for Garden City, 86.2% of individuals (162) out of the total population between 25 and 64 years of age (188) are in the labor force, with 4.3% or 7 of them being unemployed. The group with the highest labor force participation rate are those with the educational attainment of less than high school, with 100.0% or 10 individuals in the labor force. Within the labor force, individuals with college / associate degree education have the highest percentage of unemployment, with 8.4% or 7 of them being unemployed.
| Educational Attainment | In Labor Force | Unemployed |
| Less than High School | 10 (100.0%) | 0 (0.0%) |
| High School Diploma | 19 (100.0%) | 0 (0.0%) |
| College / Associate Degree | 83 (76.1%) | 9 (8.4%) |
| Bachelor's Degree or higher | 50 (100.0%) | 0 (0.0%) |
| Total | 162 (86.2%) | 8 (4.3%) |
Employment Occupations by Sex in Garden City
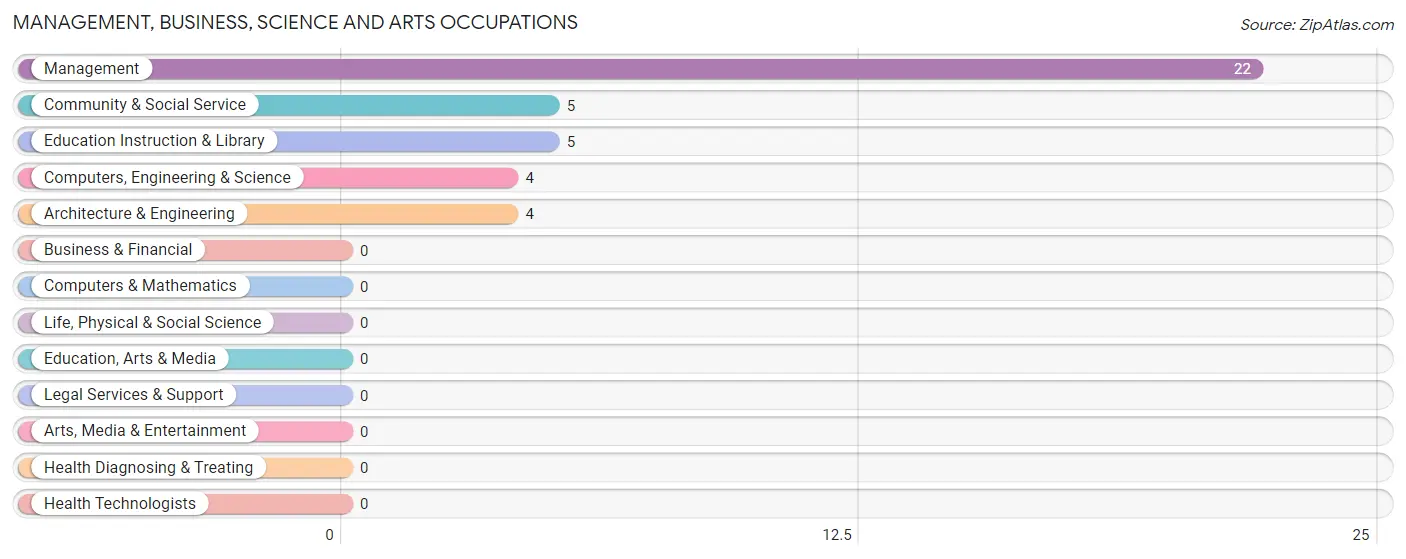
Management, Business, Science and Arts Occupations
The most common Management, Business, Science and Arts occupations in Garden City are Management (22 | 10.4%), Community & Social Service (5 | 2.4%), Education Instruction & Library (5 | 2.4%), Computers, Engineering & Science (4 | 1.9%), and Architecture & Engineering (4 | 1.9%).
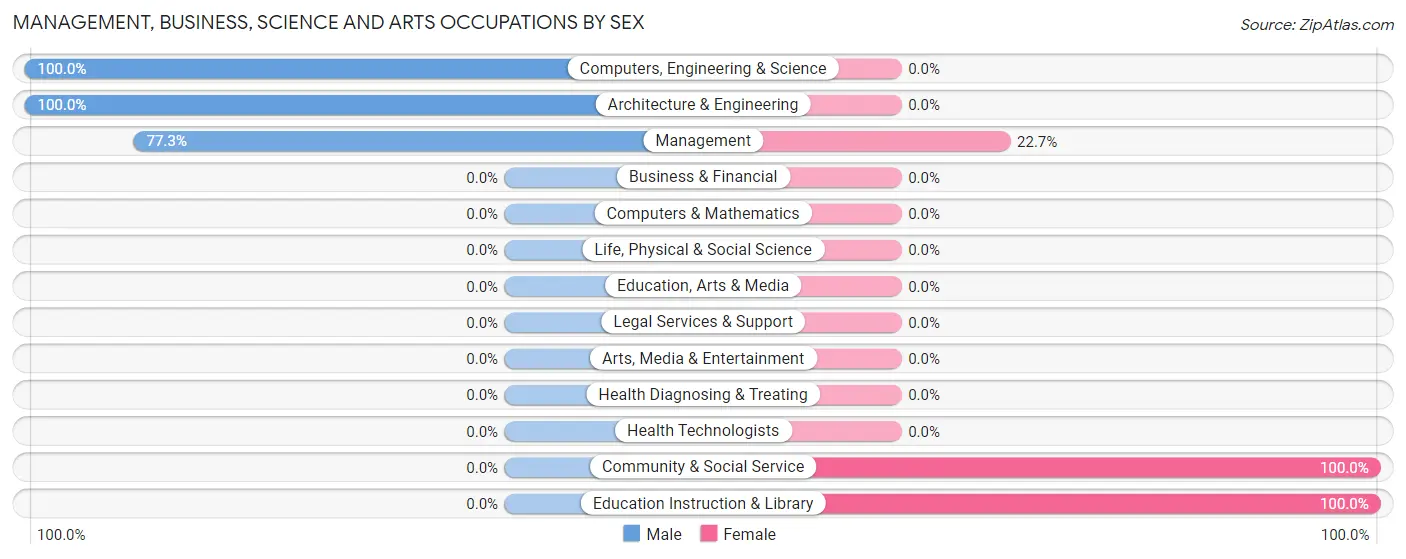
Management, Business, Science and Arts Occupations by Sex
Within the Management, Business, Science and Arts occupations in Garden City, the most male-oriented occupations are Computers, Engineering & Science (100.0%), Architecture & Engineering (100.0%), and Management (77.3%), while the most female-oriented occupations are Community & Social Service (100.0%), Education Instruction & Library (100.0%), and Management (22.7%).
| Occupation | Male | Female |
| Management | 17 (77.3%) | 5 (22.7%) |
| Business & Financial | 0 (0.0%) | 0 (0.0%) |
| Computers, Engineering & Science | 4 (100.0%) | 0 (0.0%) |
| Computers & Mathematics | 0 (0.0%) | 0 (0.0%) |
| Architecture & Engineering | 4 (100.0%) | 0 (0.0%) |
| Life, Physical & Social Science | 0 (0.0%) | 0 (0.0%) |
| Community & Social Service | 0 (0.0%) | 5 (100.0%) |
| Education, Arts & Media | 0 (0.0%) | 0 (0.0%) |
| Legal Services & Support | 0 (0.0%) | 0 (0.0%) |
| Education Instruction & Library | 0 (0.0%) | 5 (100.0%) |
| Arts, Media & Entertainment | 0 (0.0%) | 0 (0.0%) |
| Health Diagnosing & Treating | 0 (0.0%) | 0 (0.0%) |
| Health Technologists | 0 (0.0%) | 0 (0.0%) |
| Total (Category) | 21 (67.7%) | 10 (32.3%) |
| Total (Overall) | 140 (66.0%) | 72 (34.0%) |
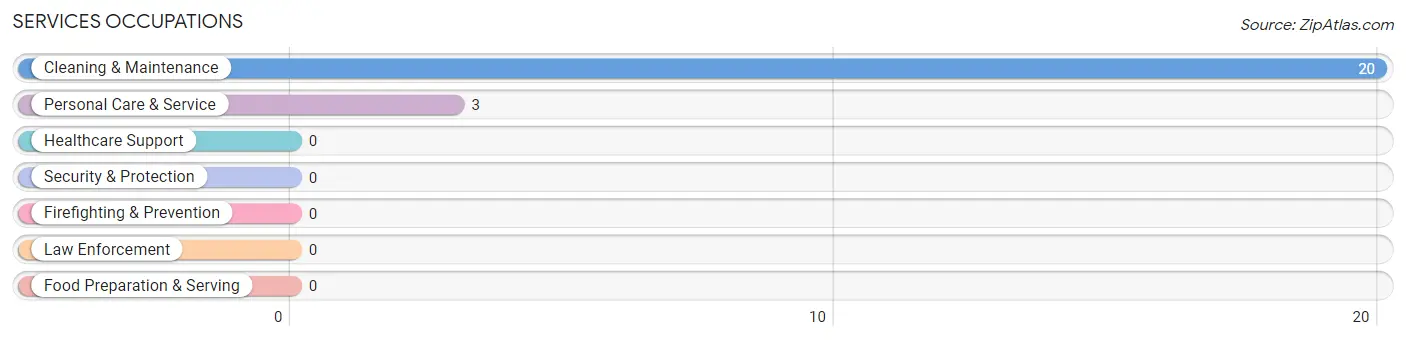
Services Occupations
The most common Services occupations in Garden City are Cleaning & Maintenance (20 | 9.4%), and Personal Care & Service (3 | 1.4%).
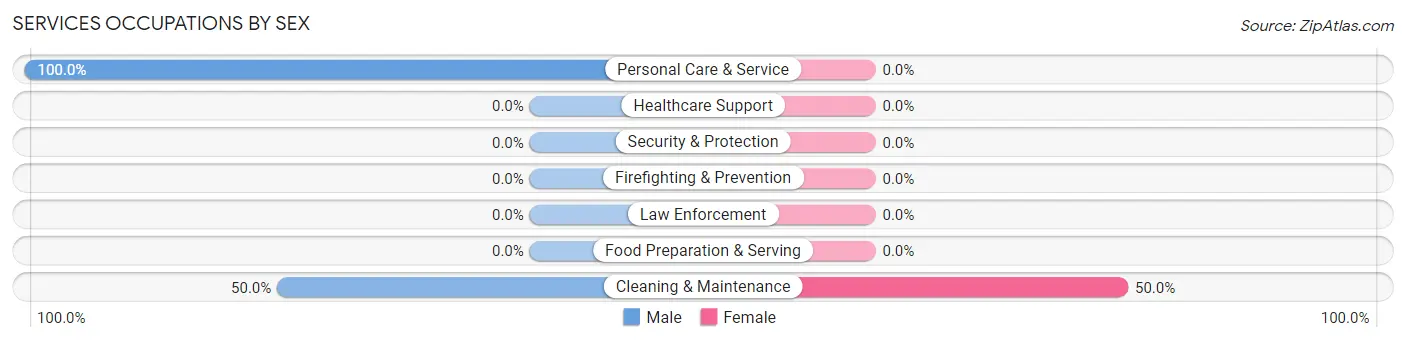
Services Occupations by Sex
| Occupation | Male | Female |
| Healthcare Support | 0 (0.0%) | 0 (0.0%) |
| Security & Protection | 0 (0.0%) | 0 (0.0%) |
| Firefighting & Prevention | 0 (0.0%) | 0 (0.0%) |
| Law Enforcement | 0 (0.0%) | 0 (0.0%) |
| Food Preparation & Serving | 0 (0.0%) | 0 (0.0%) |
| Cleaning & Maintenance | 10 (50.0%) | 10 (50.0%) |
| Personal Care & Service | 3 (100.0%) | 0 (0.0%) |
| Total (Category) | 13 (56.5%) | 10 (43.5%) |
| Total (Overall) | 140 (66.0%) | 72 (34.0%) |
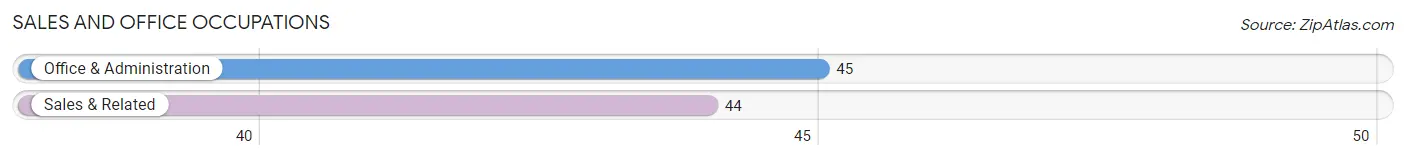
Sales and Office Occupations
The most common Sales and Office occupations in Garden City are Office & Administration (45 | 21.2%), and Sales & Related (44 | 20.7%).
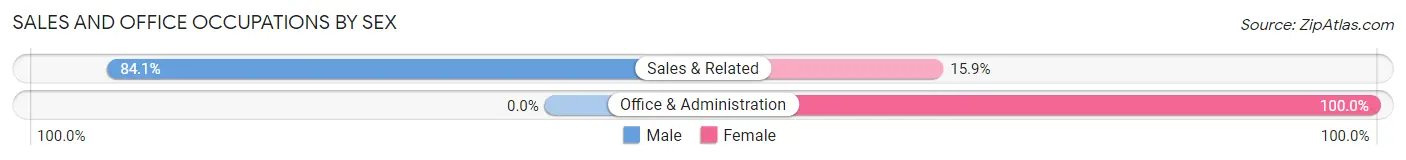
Sales and Office Occupations by Sex
| Occupation | Male | Female |
| Sales & Related | 37 (84.1%) | 7 (15.9%) |
| Office & Administration | 0 (0.0%) | 45 (100.0%) |
| Total (Category) | 37 (41.6%) | 52 (58.4%) |
| Total (Overall) | 140 (66.0%) | 72 (34.0%) |
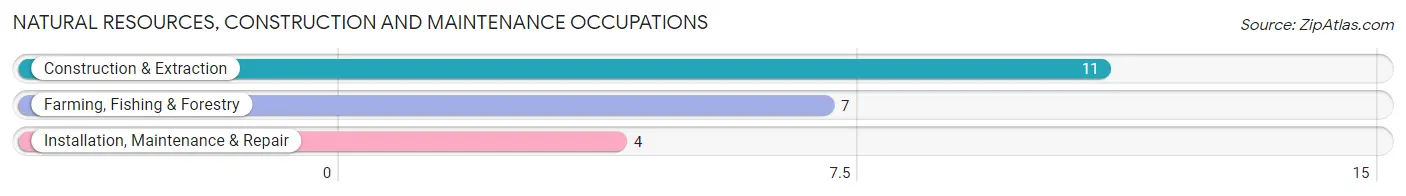
Natural Resources, Construction and Maintenance Occupations
The most common Natural Resources, Construction and Maintenance occupations in Garden City are Construction & Extraction (11 | 5.2%), Farming, Fishing & Forestry (7 | 3.3%), and Installation, Maintenance & Repair (4 | 1.9%).
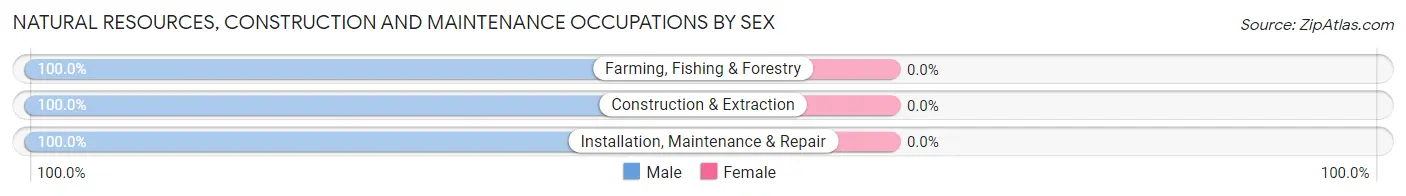
Natural Resources, Construction and Maintenance Occupations by Sex
| Occupation | Male | Female |
| Farming, Fishing & Forestry | 7 (100.0%) | 0 (0.0%) |
| Construction & Extraction | 11 (100.0%) | 0 (0.0%) |
| Installation, Maintenance & Repair | 4 (100.0%) | 0 (0.0%) |
| Total (Category) | 22 (100.0%) | 0 (0.0%) |
| Total (Overall) | 140 (66.0%) | 72 (34.0%) |
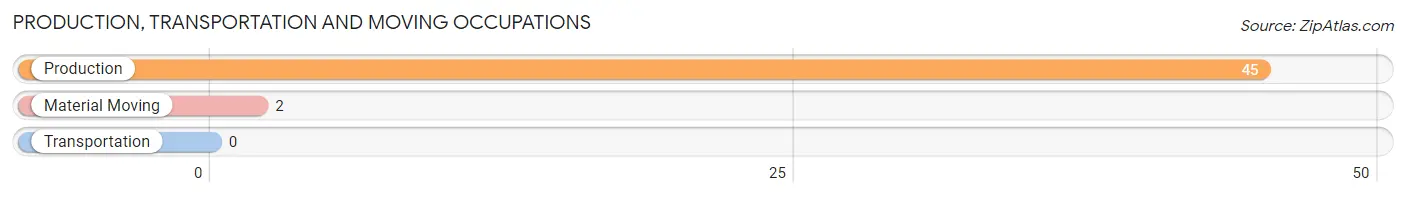
Production, Transportation and Moving Occupations
The most common Production, Transportation and Moving occupations in Garden City are Production (45 | 21.2%), and Material Moving (2 | 0.9%).
Production, Transportation and Moving Occupations by Sex
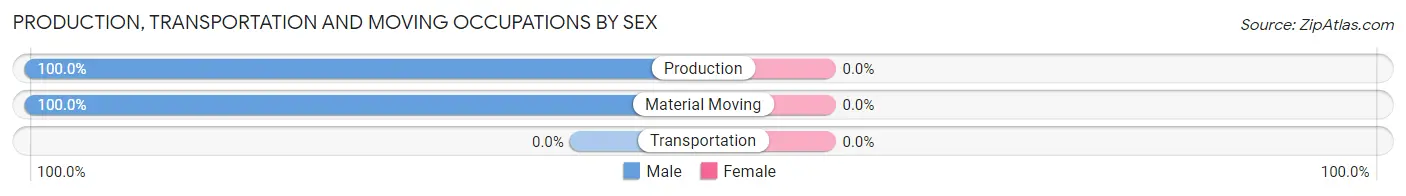
| Occupation | Male | Female |
| Production | 45 (100.0%) | 0 (0.0%) |
| Transportation | 0 (0.0%) | 0 (0.0%) |
| Material Moving | 2 (100.0%) | 0 (0.0%) |
| Total (Category) | 47 (100.0%) | 0 (0.0%) |
| Total (Overall) | 140 (66.0%) | 72 (34.0%) |
Employment Industries by Sex in Garden City
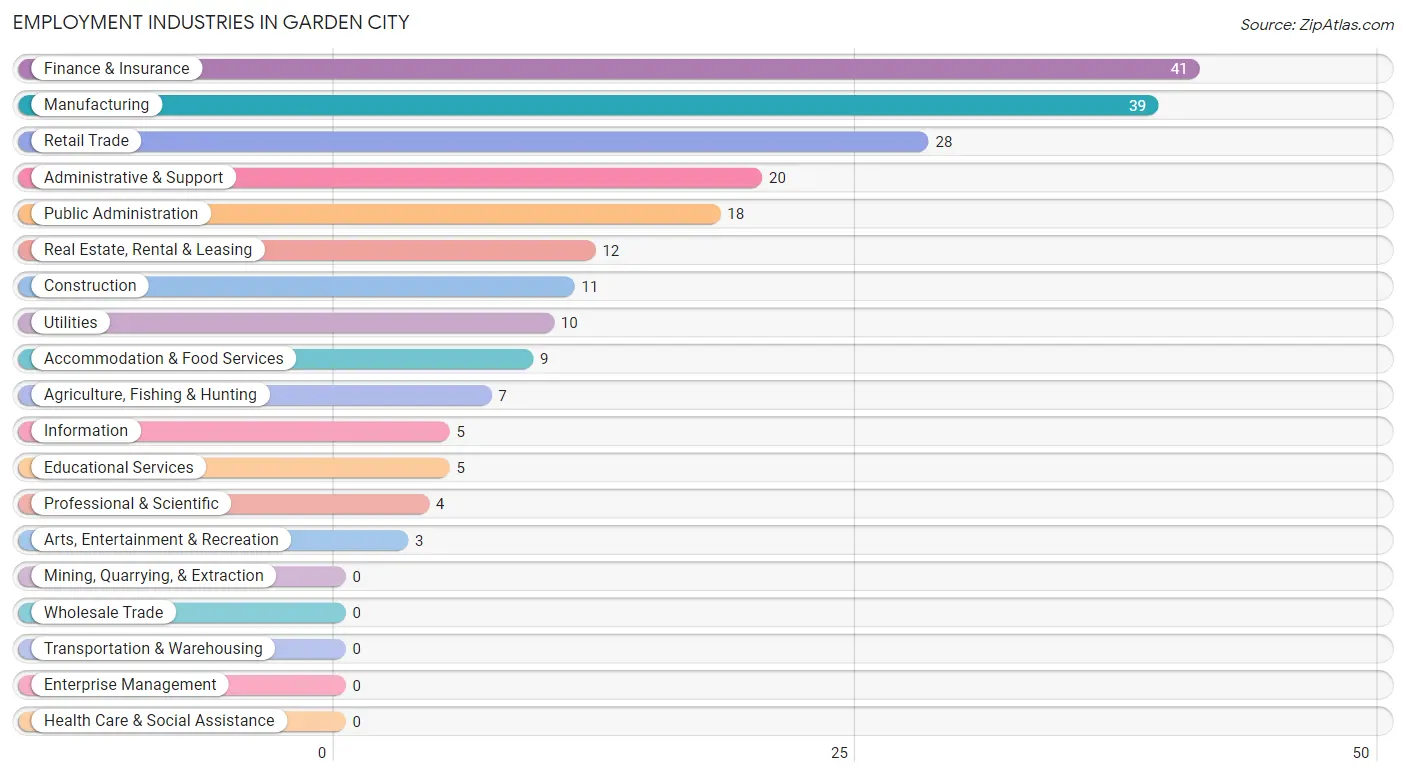
Employment Industries in Garden City
The major employment industries in Garden City include Finance & Insurance (41 | 19.3%), Manufacturing (39 | 18.4%), Retail Trade (28 | 13.2%), Administrative & Support (20 | 9.4%), and Public Administration (18 | 8.5%).
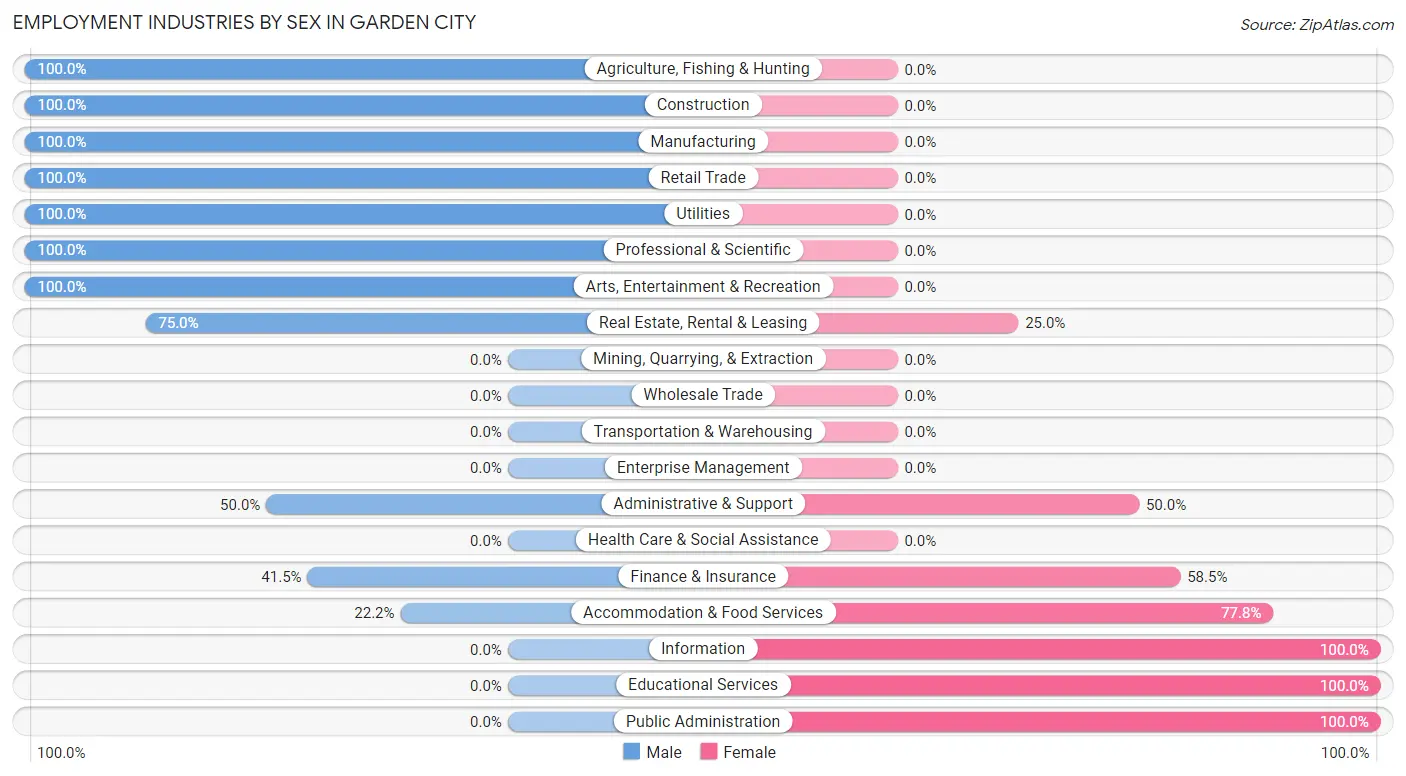
Employment Industries by Sex in Garden City
The Garden City industries that see more men than women are Agriculture, Fishing & Hunting (100.0%), Construction (100.0%), and Manufacturing (100.0%), whereas the industries that tend to have a higher number of women are Information (100.0%), Educational Services (100.0%), and Public Administration (100.0%).
| Industry | Male | Female |
| Agriculture, Fishing & Hunting | 7 (100.0%) | 0 (0.0%) |
| Mining, Quarrying, & Extraction | 0 (0.0%) | 0 (0.0%) |
| Construction | 11 (100.0%) | 0 (0.0%) |
| Manufacturing | 39 (100.0%) | 0 (0.0%) |
| Wholesale Trade | 0 (0.0%) | 0 (0.0%) |
| Retail Trade | 28 (100.0%) | 0 (0.0%) |
| Transportation & Warehousing | 0 (0.0%) | 0 (0.0%) |
| Utilities | 10 (100.0%) | 0 (0.0%) |
| Information | 0 (0.0%) | 5 (100.0%) |
| Finance & Insurance | 17 (41.5%) | 24 (58.5%) |
| Real Estate, Rental & Leasing | 9 (75.0%) | 3 (25.0%) |
| Professional & Scientific | 4 (100.0%) | 0 (0.0%) |
| Enterprise Management | 0 (0.0%) | 0 (0.0%) |
| Administrative & Support | 10 (50.0%) | 10 (50.0%) |
| Educational Services | 0 (0.0%) | 5 (100.0%) |
| Health Care & Social Assistance | 0 (0.0%) | 0 (0.0%) |
| Arts, Entertainment & Recreation | 3 (100.0%) | 0 (0.0%) |
| Accommodation & Food Services | 2 (22.2%) | 7 (77.8%) |
| Public Administration | 0 (0.0%) | 18 (100.0%) |
| Total | 140 (66.0%) | 72 (34.0%) |
Education in Garden City
School Enrollment in Garden City
The most common levels of schooling among the 158 students in Garden City are elementary school (65 | 41.1%), middle school (58 | 36.7%), and high school (24 | 15.2%).
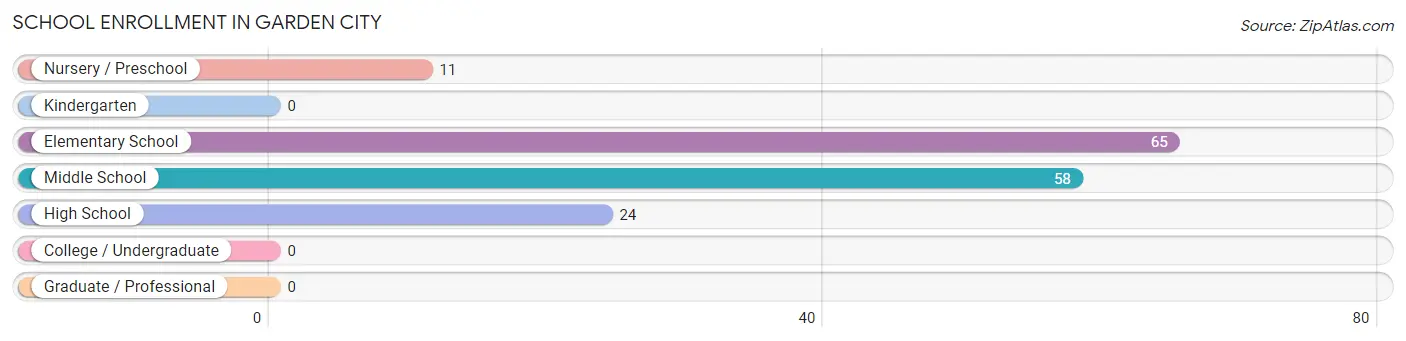
| School Level | # Students | % Students |
| Nursery / Preschool | 11 | 7.0% |
| Kindergarten | 0 | 0.0% |
| Elementary School | 65 | 41.1% |
| Middle School | 58 | 36.7% |
| High School | 24 | 15.2% |
| College / Undergraduate | 0 | 0.0% |
| Graduate / Professional | 0 | 0.0% |
| Total | 158 | 100.0% |
School Enrollment by Age by Funding Source in Garden City
Out of a total of 158 students who are enrolled in schools in Garden City, 11 (7.0%) attend a private institution, while the remaining 147 (93.0%) are enrolled in public schools. The age group of 3 to 4 year olds has the highest likelihood of being enrolled in private schools, with 11 (100.0% in the age bracket) enrolled. Conversely, the age group of 5 to 9 year old has the lowest likelihood of being enrolled in a private school, with 65 (100.0% in the age bracket) attending a public institution.
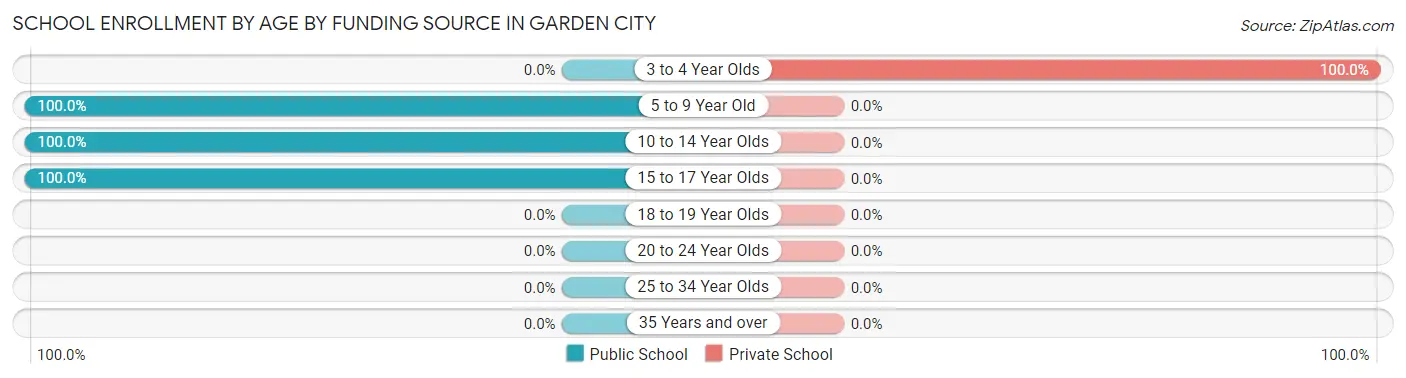
| Age Bracket | Public School | Private School |
| 3 to 4 Year Olds | 0 (0.0%) | 11 (100.0%) |
| 5 to 9 Year Old | 65 (100.0%) | 0 (0.0%) |
| 10 to 14 Year Olds | 58 (100.0%) | 0 (0.0%) |
| 15 to 17 Year Olds | 24 (100.0%) | 0 (0.0%) |
| 18 to 19 Year Olds | 0 (0.0%) | 0 (0.0%) |
| 20 to 24 Year Olds | 0 (0.0%) | 0 (0.0%) |
| 25 to 34 Year Olds | 0 (0.0%) | 0 (0.0%) |
| 35 Years and over | 0 (0.0%) | 0 (0.0%) |
| Total | 147 (93.0%) | 11 (7.0%) |
Educational Attainment by Field of Study in Garden City
Science & technology (36 | 29.7%), business (35 | 28.9%), physical & health sciences (18 | 14.9%), engineering (15 | 12.4%), and education (11 | 9.1%) are the most common fields of study among 121 individuals in Garden City who have obtained a bachelor's degree or higher.
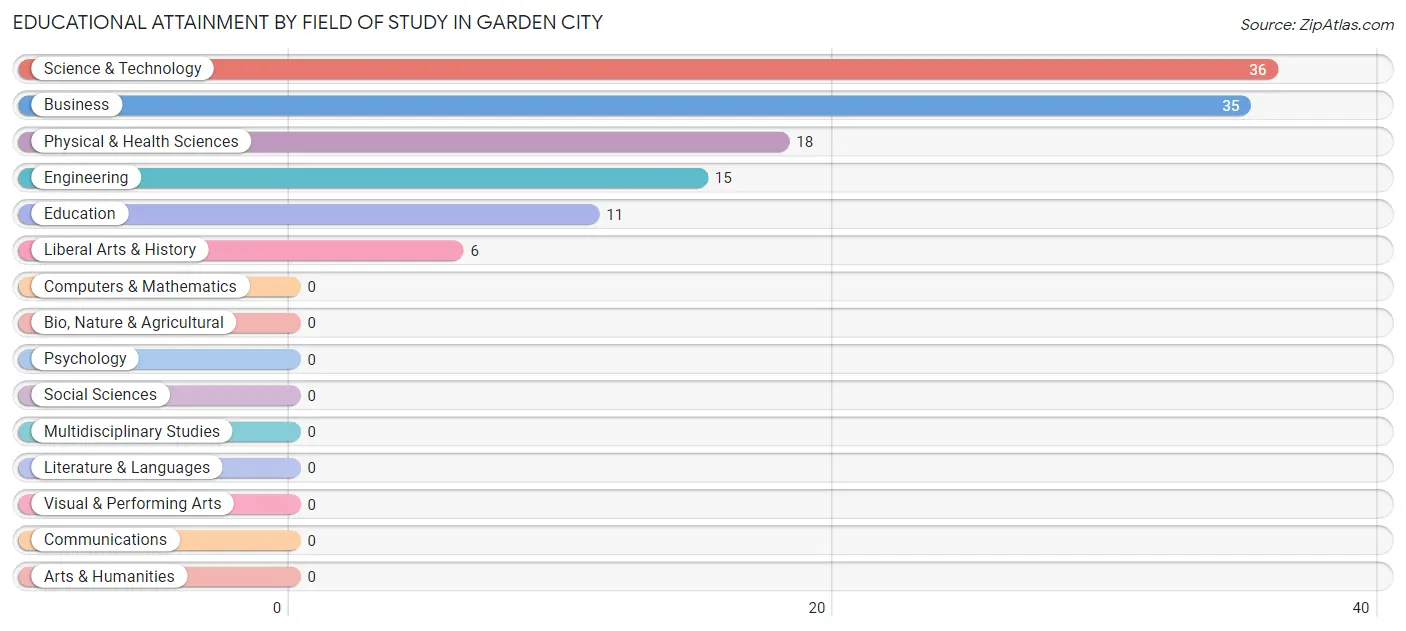
| Field of Study | # Graduates | % Graduates |
| Computers & Mathematics | 0 | 0.0% |
| Bio, Nature & Agricultural | 0 | 0.0% |
| Physical & Health Sciences | 18 | 14.9% |
| Psychology | 0 | 0.0% |
| Social Sciences | 0 | 0.0% |
| Engineering | 15 | 12.4% |
| Multidisciplinary Studies | 0 | 0.0% |
| Science & Technology | 36 | 29.7% |
| Business | 35 | 28.9% |
| Education | 11 | 9.1% |
| Literature & Languages | 0 | 0.0% |
| Liberal Arts & History | 6 | 5.0% |
| Visual & Performing Arts | 0 | 0.0% |
| Communications | 0 | 0.0% |
| Arts & Humanities | 0 | 0.0% |
| Total | 121 | 100.0% |
Transportation & Commute in Garden City
Vehicle Availability by Sex in Garden City
The most prevalent vehicle ownership categories in Garden City are males with 2 vehicles (76, accounting for 56.3%) and females with 2 vehicles (17, making up 105.6%).
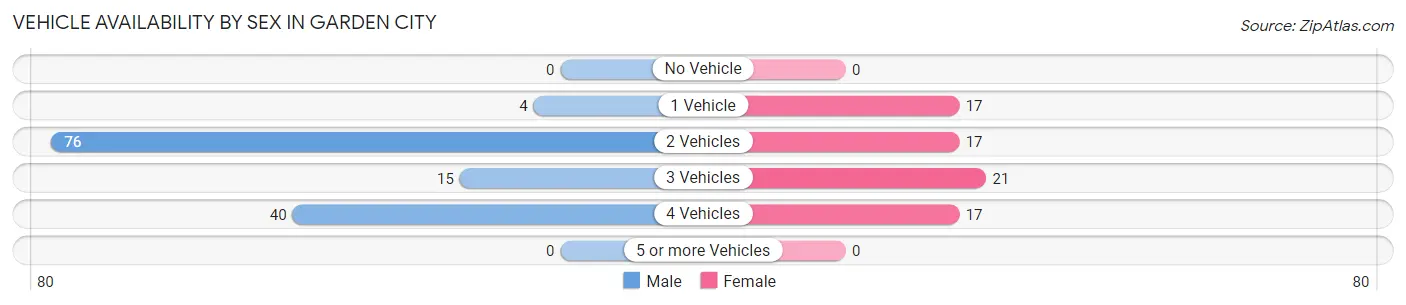
| Vehicles Available | Male | Female |
| No Vehicle | 0 (0.0%) | 0 (0.0%) |
| 1 Vehicle | 4 (3.0%) | 17 (23.6%) |
| 2 Vehicles | 76 (56.3%) | 17 (23.6%) |
| 3 Vehicles | 15 (11.1%) | 21 (29.2%) |
| 4 Vehicles | 40 (29.6%) | 17 (23.6%) |
| 5 or more Vehicles | 0 (0.0%) | 0 (0.0%) |
| Total | 135 (100.0%) | 72 (100.0%) |
Commute Time in Garden City
The most frequently occuring commute durations in Garden City are 5 to 9 minutes (77 commuters, 51.7%), less than 5 minutes (23 commuters, 15.4%), and 15 to 19 minutes (15 commuters, 10.1%).
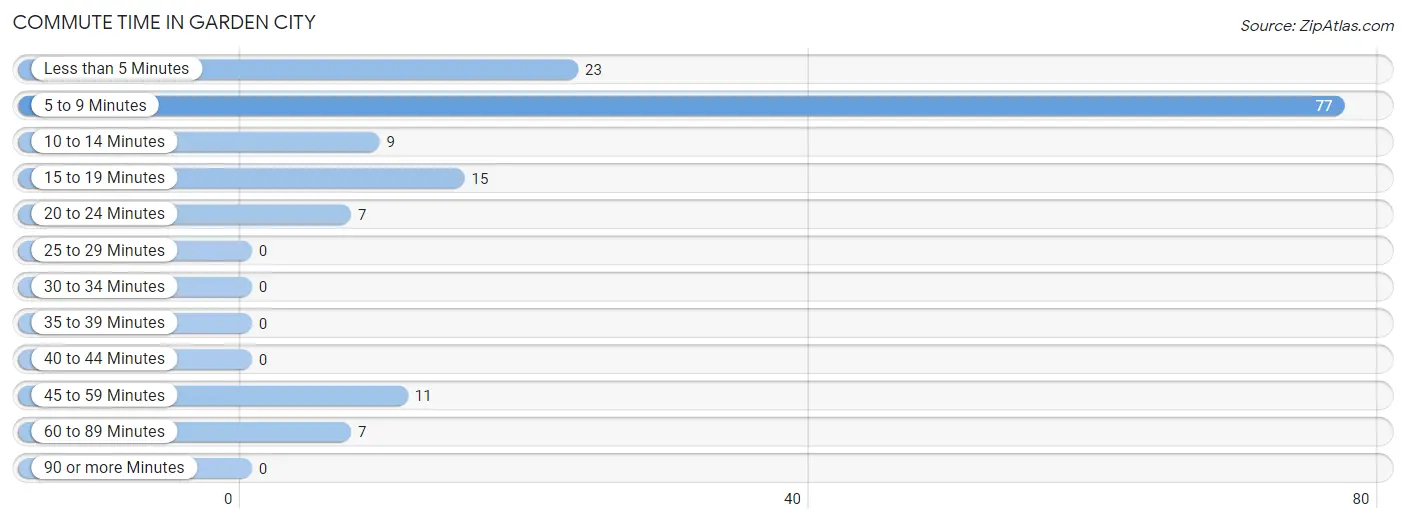
| Commute Time | # Commuters | % Commuters |
| Less than 5 Minutes | 23 | 15.4% |
| 5 to 9 Minutes | 77 | 51.7% |
| 10 to 14 Minutes | 9 | 6.0% |
| 15 to 19 Minutes | 15 | 10.1% |
| 20 to 24 Minutes | 7 | 4.7% |
| 25 to 29 Minutes | 0 | 0.0% |
| 30 to 34 Minutes | 0 | 0.0% |
| 35 to 39 Minutes | 0 | 0.0% |
| 40 to 44 Minutes | 0 | 0.0% |
| 45 to 59 Minutes | 11 | 7.4% |
| 60 to 89 Minutes | 7 | 4.7% |
| 90 or more Minutes | 0 | 0.0% |
Commute Time by Sex in Garden City
The most common commute times in Garden City are 5 to 9 minutes (67 commuters, 59.8%) for males and 15 to 19 minutes (15 commuters, 40.5%) for females.
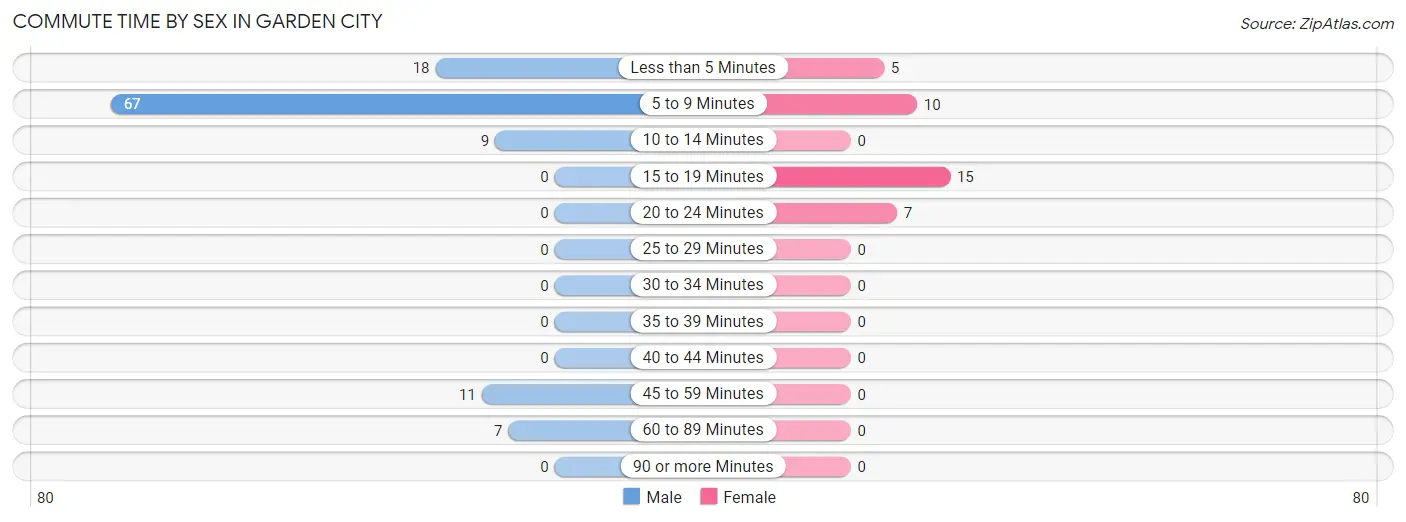
| Commute Time | Male | Female |
| Less than 5 Minutes | 18 (16.1%) | 5 (13.5%) |
| 5 to 9 Minutes | 67 (59.8%) | 10 (27.0%) |
| 10 to 14 Minutes | 9 (8.0%) | 0 (0.0%) |
| 15 to 19 Minutes | 0 (0.0%) | 15 (40.5%) |
| 20 to 24 Minutes | 0 (0.0%) | 7 (18.9%) |
| 25 to 29 Minutes | 0 (0.0%) | 0 (0.0%) |
| 30 to 34 Minutes | 0 (0.0%) | 0 (0.0%) |
| 35 to 39 Minutes | 0 (0.0%) | 0 (0.0%) |
| 40 to 44 Minutes | 0 (0.0%) | 0 (0.0%) |
| 45 to 59 Minutes | 11 (9.8%) | 0 (0.0%) |
| 60 to 89 Minutes | 7 (6.2%) | 0 (0.0%) |
| 90 or more Minutes | 0 (0.0%) | 0 (0.0%) |
Time of Departure to Work by Sex in Garden City
The most frequent times of departure to work in Garden City are 5:00 AM to 5:29 AM (27, 24.1%) for males and 10:00 AM to 10:59 AM (15, 40.5%) for females.
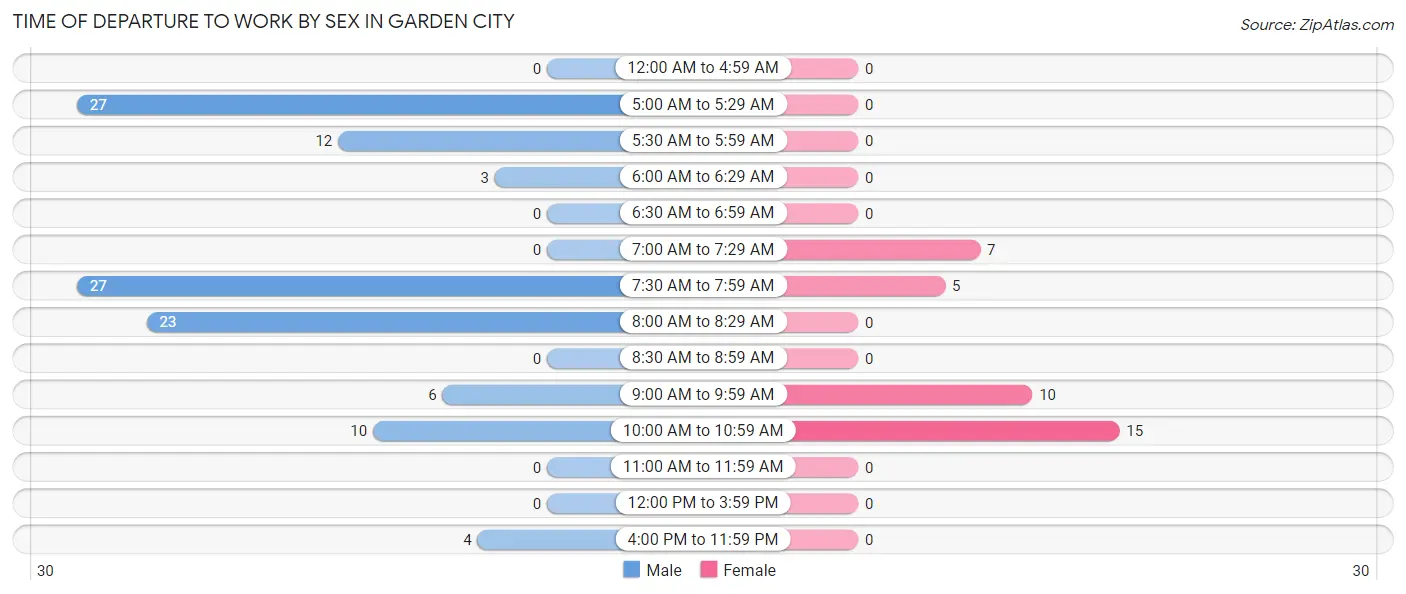
| Time of Departure | Male | Female |
| 12:00 AM to 4:59 AM | 0 (0.0%) | 0 (0.0%) |
| 5:00 AM to 5:29 AM | 27 (24.1%) | 0 (0.0%) |
| 5:30 AM to 5:59 AM | 12 (10.7%) | 0 (0.0%) |
| 6:00 AM to 6:29 AM | 3 (2.7%) | 0 (0.0%) |
| 6:30 AM to 6:59 AM | 0 (0.0%) | 0 (0.0%) |
| 7:00 AM to 7:29 AM | 0 (0.0%) | 7 (18.9%) |
| 7:30 AM to 7:59 AM | 27 (24.1%) | 5 (13.5%) |
| 8:00 AM to 8:29 AM | 23 (20.5%) | 0 (0.0%) |
| 8:30 AM to 8:59 AM | 0 (0.0%) | 0 (0.0%) |
| 9:00 AM to 9:59 AM | 6 (5.4%) | 10 (27.0%) |
| 10:00 AM to 10:59 AM | 10 (8.9%) | 15 (40.5%) |
| 11:00 AM to 11:59 AM | 0 (0.0%) | 0 (0.0%) |
| 12:00 PM to 3:59 PM | 0 (0.0%) | 0 (0.0%) |
| 4:00 PM to 11:59 PM | 4 (3.6%) | 0 (0.0%) |
| Total | 112 (100.0%) | 37 (100.0%) |
Housing Occupancy in Garden City
Occupancy by Ownership in Garden City
Of the total 178 dwellings in Garden City, owner-occupied units account for 136 (76.4%), while renter-occupied units make up 42 (23.6%).
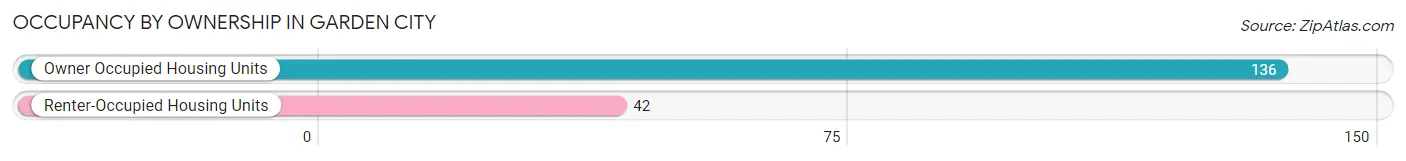
| Occupancy | # Housing Units | % Housing Units |
| Owner Occupied Housing Units | 136 | 76.4% |
| Renter-Occupied Housing Units | 42 | 23.6% |
| Total Occupied Housing Units | 178 | 100.0% |
Occupancy by Household Size in Garden City
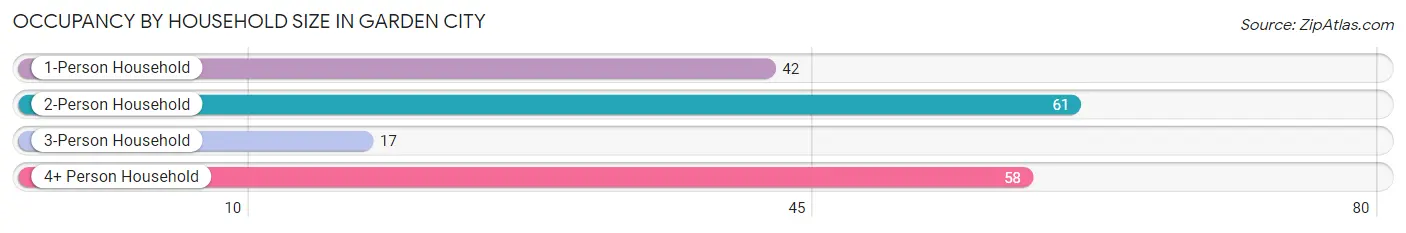
| Household Size | # Housing Units | % Housing Units |
| 1-Person Household | 42 | 23.6% |
| 2-Person Household | 61 | 34.3% |
| 3-Person Household | 17 | 9.6% |
| 4+ Person Household | 58 | 32.6% |
| Total Housing Units | 178 | 100.0% |
Occupancy by Ownership by Household Size in Garden City
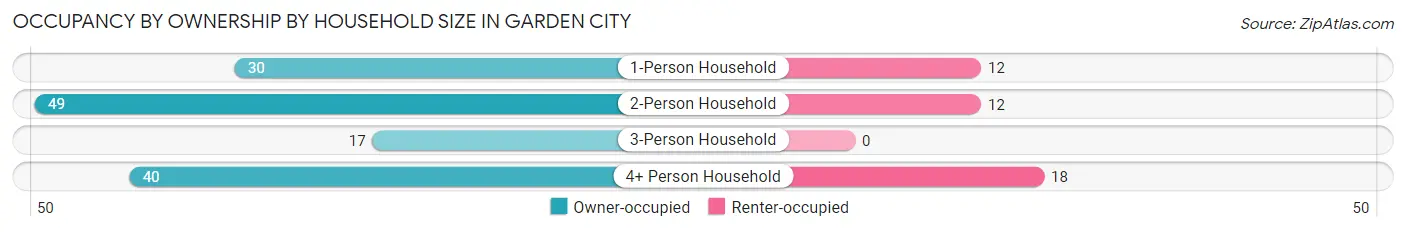
| Household Size | Owner-occupied | Renter-occupied |
| 1-Person Household | 30 (71.4%) | 12 (28.6%) |
| 2-Person Household | 49 (80.3%) | 12 (19.7%) |
| 3-Person Household | 17 (100.0%) | 0 (0.0%) |
| 4+ Person Household | 40 (69.0%) | 18 (31.0%) |
| Total Housing Units | 136 (76.4%) | 42 (23.6%) |
Occupancy by Educational Attainment in Garden City
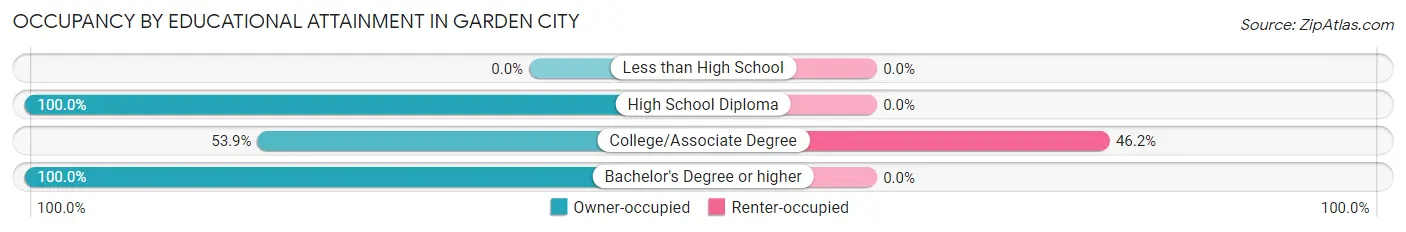
| Household Size | Owner-occupied | Renter-occupied |
| Less than High School | 0 (0.0%) | 0 (0.0%) |
| High School Diploma | 16 (100.0%) | 0 (0.0%) |
| College/Associate Degree | 49 (53.8%) | 42 (46.2%) |
| Bachelor's Degree or higher | 71 (100.0%) | 0 (0.0%) |
Occupancy by Age of Householder in Garden City
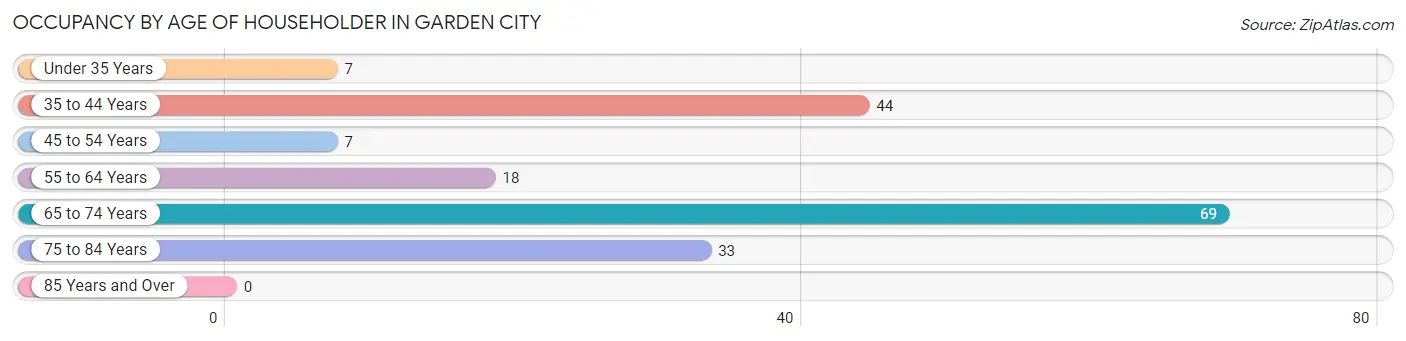
| Age Bracket | # Households | % Households |
| Under 35 Years | 7 | 3.9% |
| 35 to 44 Years | 44 | 24.7% |
| 45 to 54 Years | 7 | 3.9% |
| 55 to 64 Years | 18 | 10.1% |
| 65 to 74 Years | 69 | 38.8% |
| 75 to 84 Years | 33 | 18.5% |
| 85 Years and Over | 0 | 0.0% |
| Total | 178 | 100.0% |
Housing Finances in Garden City
Median Income by Occupancy in Garden City
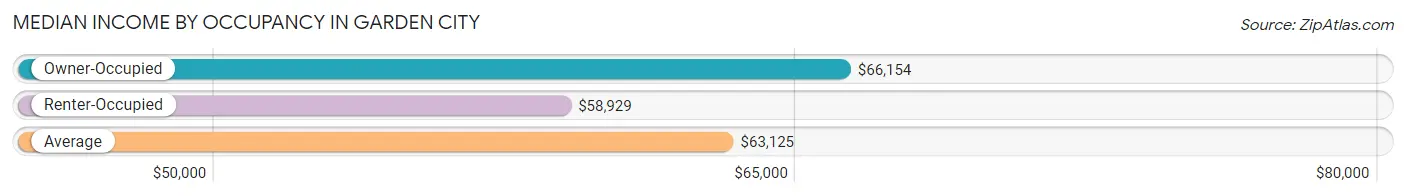
| Occupancy Type | # Households | Median Income |
| Owner-Occupied | 136 (76.4%) | $66,154 |
| Renter-Occupied | 42 (23.6%) | $58,929 |
| Average | 178 (100.0%) | $63,125 |
Occupancy by Householder Income Bracket in Garden City
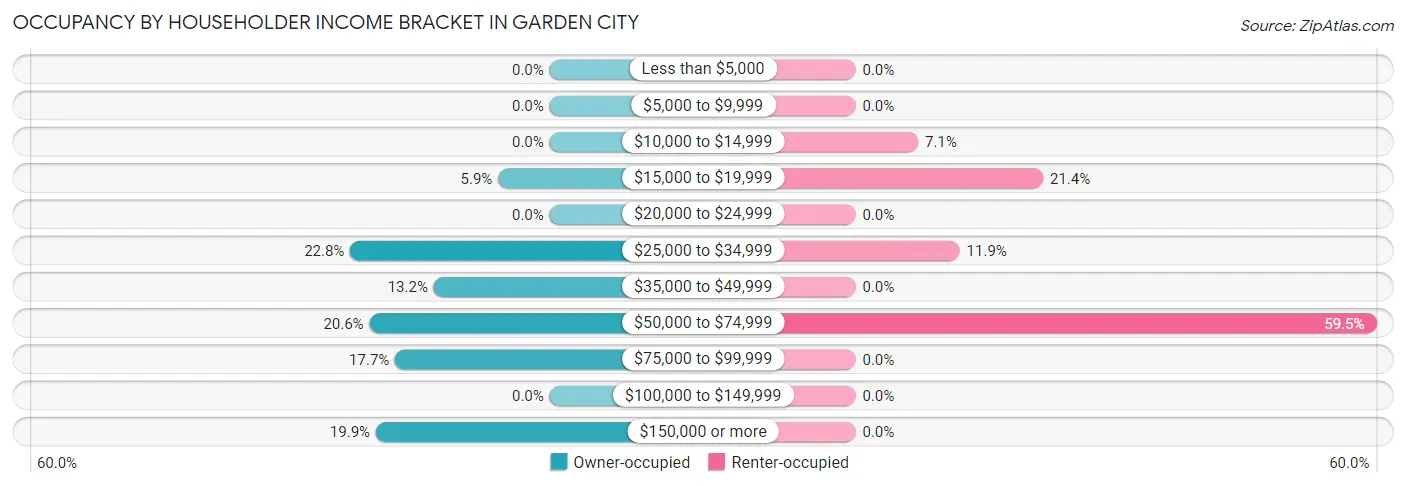
| Income Bracket | Owner-occupied | Renter-occupied |
| Less than $5,000 | 0 (0.0%) | 0 (0.0%) |
| $5,000 to $9,999 | 0 (0.0%) | 0 (0.0%) |
| $10,000 to $14,999 | 0 (0.0%) | 3 (7.1%) |
| $15,000 to $19,999 | 8 (5.9%) | 9 (21.4%) |
| $20,000 to $24,999 | 0 (0.0%) | 0 (0.0%) |
| $25,000 to $34,999 | 31 (22.8%) | 5 (11.9%) |
| $35,000 to $49,999 | 18 (13.2%) | 0 (0.0%) |
| $50,000 to $74,999 | 28 (20.6%) | 25 (59.5%) |
| $75,000 to $99,999 | 24 (17.6%) | 0 (0.0%) |
| $100,000 to $149,999 | 0 (0.0%) | 0 (0.0%) |
| $150,000 or more | 27 (19.9%) | 0 (0.0%) |
| Total | 136 (100.0%) | 42 (100.0%) |
Monthly Housing Cost Tiers in Garden City
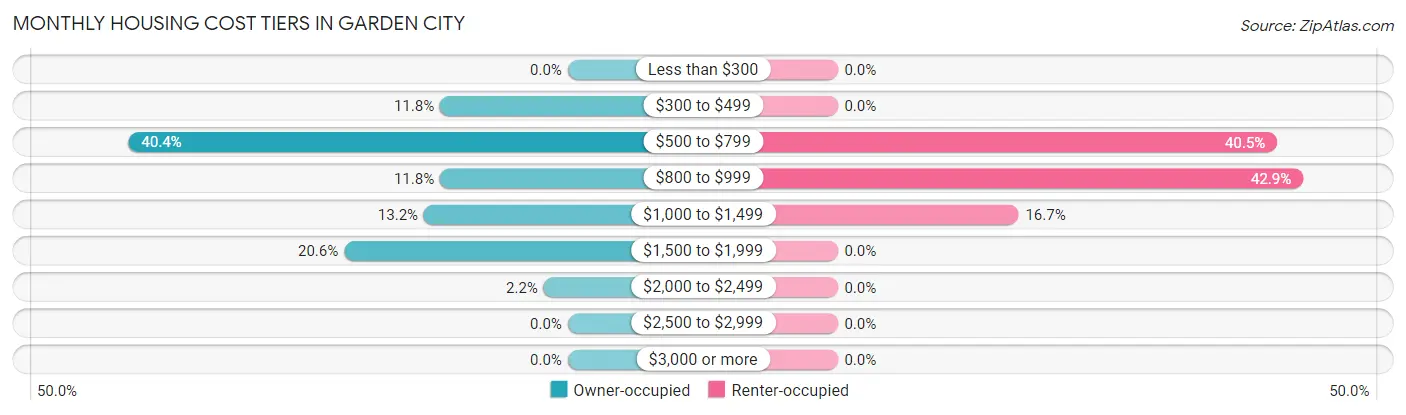
| Monthly Cost | Owner-occupied | Renter-occupied |
| Less than $300 | 0 (0.0%) | 0 (0.0%) |
| $300 to $499 | 16 (11.8%) | 0 (0.0%) |
| $500 to $799 | 55 (40.4%) | 17 (40.5%) |
| $800 to $999 | 16 (11.8%) | 18 (42.9%) |
| $1,000 to $1,499 | 18 (13.2%) | 7 (16.7%) |
| $1,500 to $1,999 | 28 (20.6%) | 0 (0.0%) |
| $2,000 to $2,499 | 3 (2.2%) | 0 (0.0%) |
| $2,500 to $2,999 | 0 (0.0%) | 0 (0.0%) |
| $3,000 or more | 0 (0.0%) | 0 (0.0%) |
| Total | 136 (100.0%) | 42 (100.0%) |
Physical Housing Characteristics in Garden City
Housing Structures in Garden City
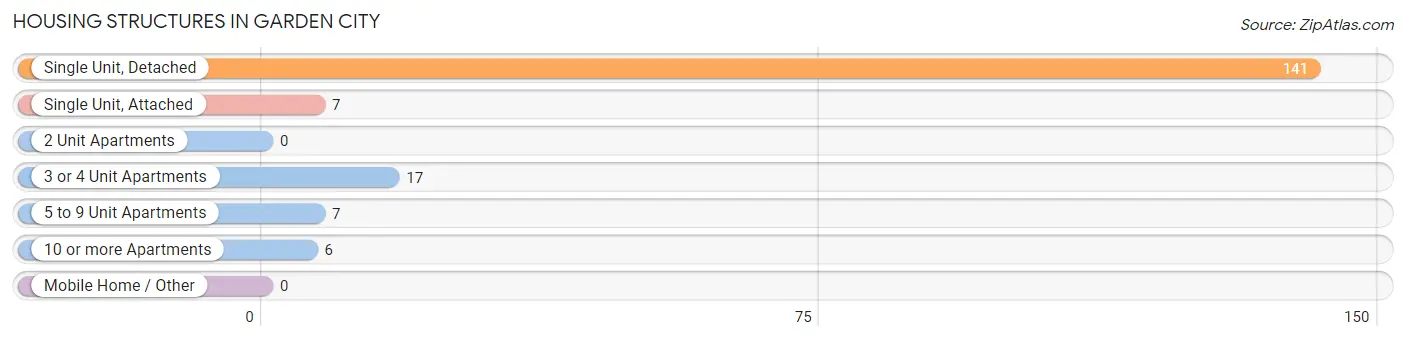
| Structure Type | # Housing Units | % Housing Units |
| Single Unit, Detached | 141 | 79.2% |
| Single Unit, Attached | 7 | 3.9% |
| 2 Unit Apartments | 0 | 0.0% |
| 3 or 4 Unit Apartments | 17 | 9.6% |
| 5 to 9 Unit Apartments | 7 | 3.9% |
| 10 or more Apartments | 6 | 3.4% |
| Mobile Home / Other | 0 | 0.0% |
| Total | 178 | 100.0% |
Housing Structures by Occupancy in Garden City
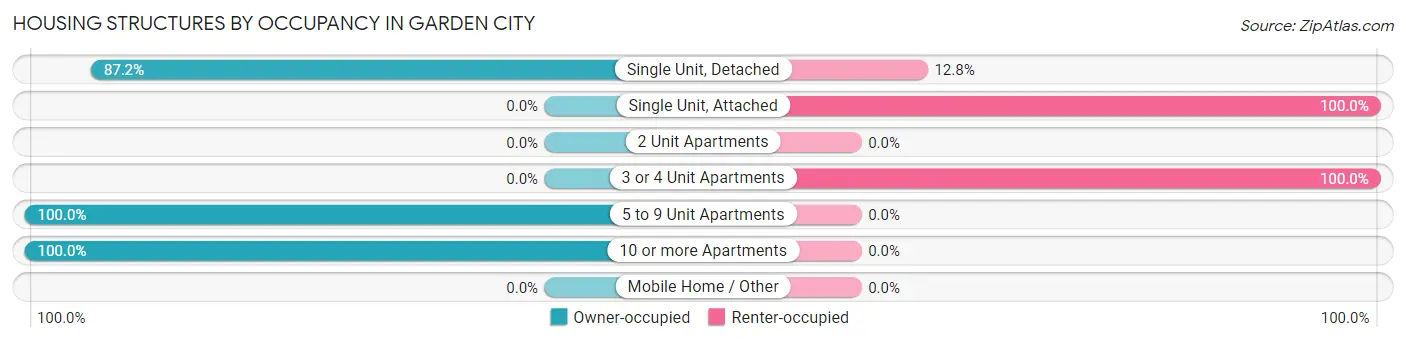
| Structure Type | Owner-occupied | Renter-occupied |
| Single Unit, Detached | 123 (87.2%) | 18 (12.8%) |
| Single Unit, Attached | 0 (0.0%) | 7 (100.0%) |
| 2 Unit Apartments | 0 (0.0%) | 0 (0.0%) |
| 3 or 4 Unit Apartments | 0 (0.0%) | 17 (100.0%) |
| 5 to 9 Unit Apartments | 7 (100.0%) | 0 (0.0%) |
| 10 or more Apartments | 6 (100.0%) | 0 (0.0%) |
| Mobile Home / Other | 0 (0.0%) | 0 (0.0%) |
| Total | 136 (76.4%) | 42 (23.6%) |
Housing Structures by Number of Rooms in Garden City
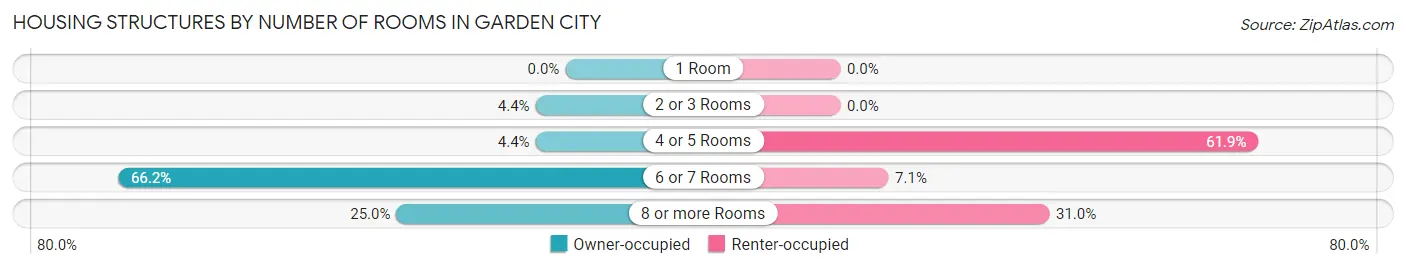
| Number of Rooms | Owner-occupied | Renter-occupied |
| 1 Room | 0 (0.0%) | 0 (0.0%) |
| 2 or 3 Rooms | 6 (4.4%) | 0 (0.0%) |
| 4 or 5 Rooms | 6 (4.4%) | 26 (61.9%) |
| 6 or 7 Rooms | 90 (66.2%) | 3 (7.1%) |
| 8 or more Rooms | 34 (25.0%) | 13 (30.9%) |
| Total | 136 (100.0%) | 42 (100.0%) |
Housing Structure by Heating Type in Garden City
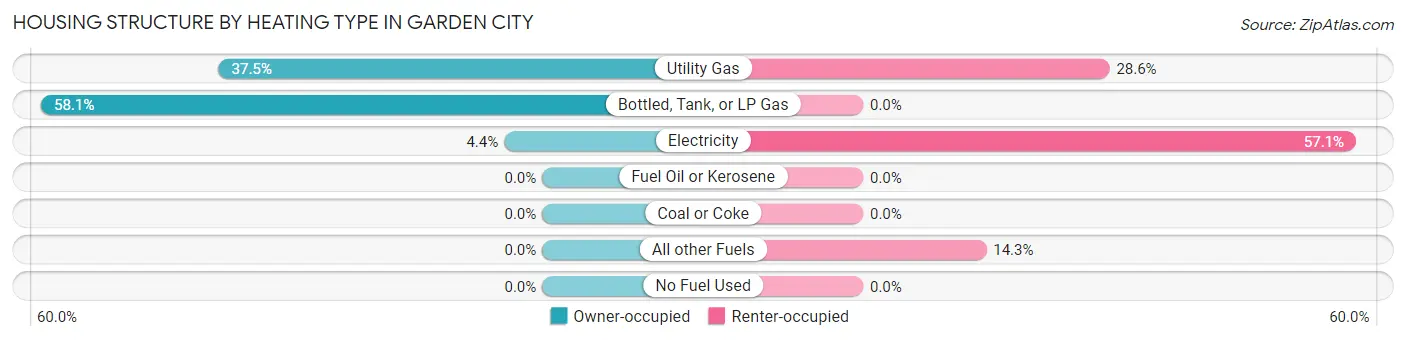
| Heating Type | Owner-occupied | Renter-occupied |
| Utility Gas | 51 (37.5%) | 12 (28.6%) |
| Bottled, Tank, or LP Gas | 79 (58.1%) | 0 (0.0%) |
| Electricity | 6 (4.4%) | 24 (57.1%) |
| Fuel Oil or Kerosene | 0 (0.0%) | 0 (0.0%) |
| Coal or Coke | 0 (0.0%) | 0 (0.0%) |
| All other Fuels | 0 (0.0%) | 6 (14.3%) |
| No Fuel Used | 0 (0.0%) | 0 (0.0%) |
| Total | 136 (100.0%) | 42 (100.0%) |
Household Vehicle Usage in Garden City
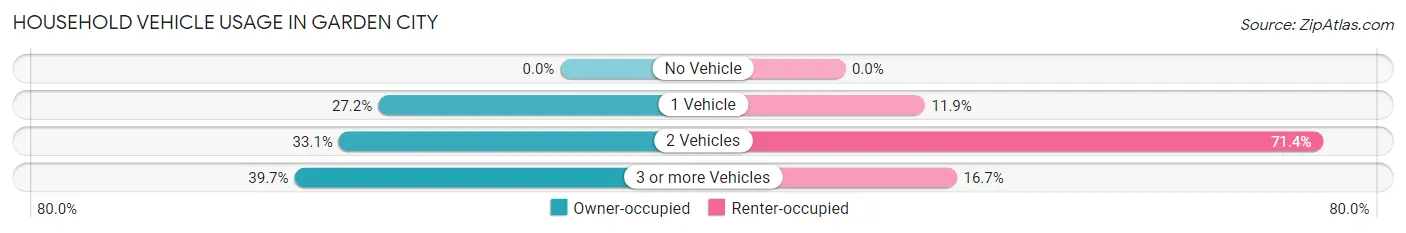
| Vehicles per Household | Owner-occupied | Renter-occupied |
| No Vehicle | 0 (0.0%) | 0 (0.0%) |
| 1 Vehicle | 37 (27.2%) | 5 (11.9%) |
| 2 Vehicles | 45 (33.1%) | 30 (71.4%) |
| 3 or more Vehicles | 54 (39.7%) | 7 (16.7%) |
| Total | 136 (100.0%) | 42 (100.0%) |
Real Estate & Mortgages in Garden City
Real Estate and Mortgage Overview in Garden City
| Characteristic | Without Mortgage | With Mortgage |
| Housing Units | 53 | 83 |
| Median Property Value | $640,600 | $355,000 |
| Median Household Income | - | - |
| Monthly Housing Costs | $615 | $0 |
| Real Estate Taxes | $3,486 | $0 |
Property Value by Mortgage Status in Garden City
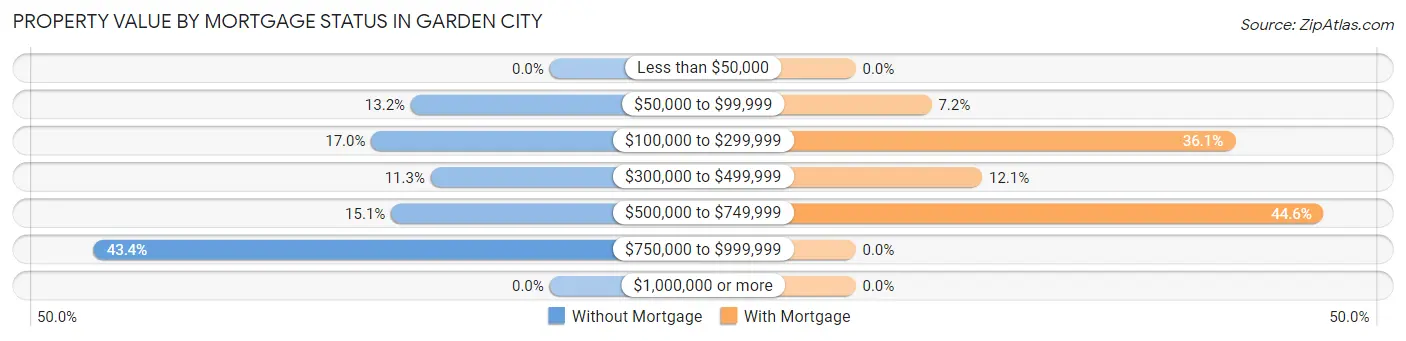
| Property Value | Without Mortgage | With Mortgage |
| Less than $50,000 | 0 (0.0%) | 0 (0.0%) |
| $50,000 to $99,999 | 7 (13.2%) | 6 (7.2%) |
| $100,000 to $299,999 | 9 (17.0%) | 30 (36.1%) |
| $300,000 to $499,999 | 6 (11.3%) | 10 (12.0%) |
| $500,000 to $749,999 | 8 (15.1%) | 37 (44.6%) |
| $750,000 to $999,999 | 23 (43.4%) | 0 (0.0%) |
| $1,000,000 or more | 0 (0.0%) | 0 (0.0%) |
| Total | 53 (100.0%) | 83 (100.0%) |
Household Income by Mortgage Status in Garden City
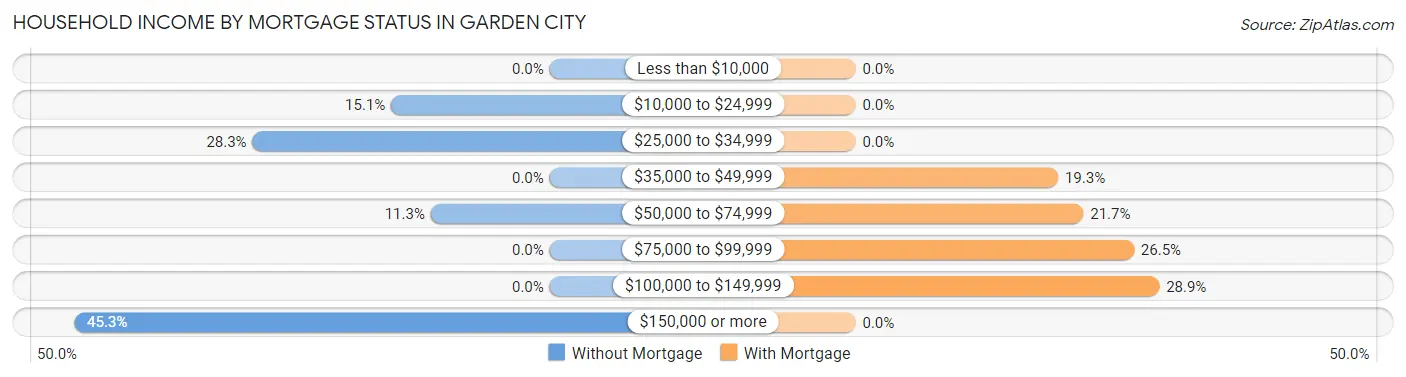
| Household Income | Without Mortgage | With Mortgage |
| Less than $10,000 | 0 (0.0%) | 0 (0.0%) |
| $10,000 to $24,999 | 8 (15.1%) | 0 (0.0%) |
| $25,000 to $34,999 | 15 (28.3%) | 0 (0.0%) |
| $35,000 to $49,999 | 0 (0.0%) | 16 (19.3%) |
| $50,000 to $74,999 | 6 (11.3%) | 18 (21.7%) |
| $75,000 to $99,999 | 0 (0.0%) | 22 (26.5%) |
| $100,000 to $149,999 | 0 (0.0%) | 24 (28.9%) |
| $150,000 or more | 24 (45.3%) | 0 (0.0%) |
| Total | 53 (100.0%) | 83 (100.0%) |
Property Value to Household Income Ratio in Garden City
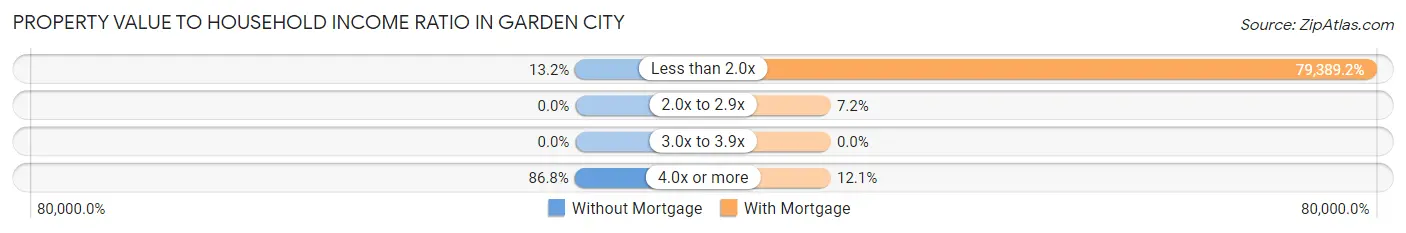
| Value-to-Income Ratio | Without Mortgage | With Mortgage |
| Less than 2.0x | 7 (13.2%) | 65,893 (79,389.2%) |
| 2.0x to 2.9x | 0 (0.0%) | 6 (7.2%) |
| 3.0x to 3.9x | 0 (0.0%) | 0 (0.0%) |
| 4.0x or more | 46 (86.8%) | 10 (12.0%) |
| Total | 53 (100.0%) | 83 (100.0%) |
Real Estate Taxes by Mortgage Status in Garden City
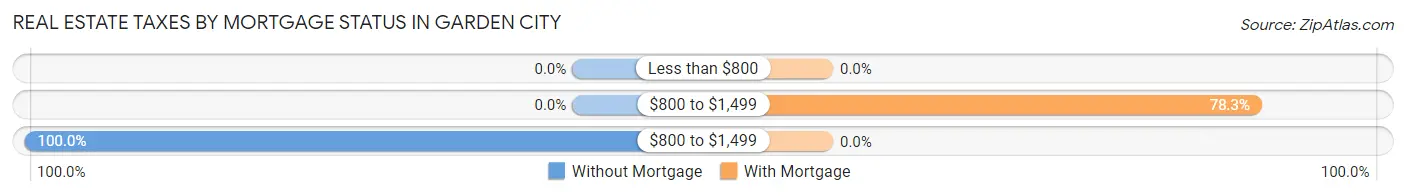
| Property Taxes | Without Mortgage | With Mortgage |
| Less than $800 | 0 (0.0%) | 0 (0.0%) |
| $800 to $1,499 | 0 (0.0%) | 65 (78.3%) |
| $800 to $1,499 | 53 (100.0%) | 0 (0.0%) |
| Total | 53 (100.0%) | 83 (100.0%) |
Health & Disability in Garden City
Health Insurance Coverage by Age in Garden City
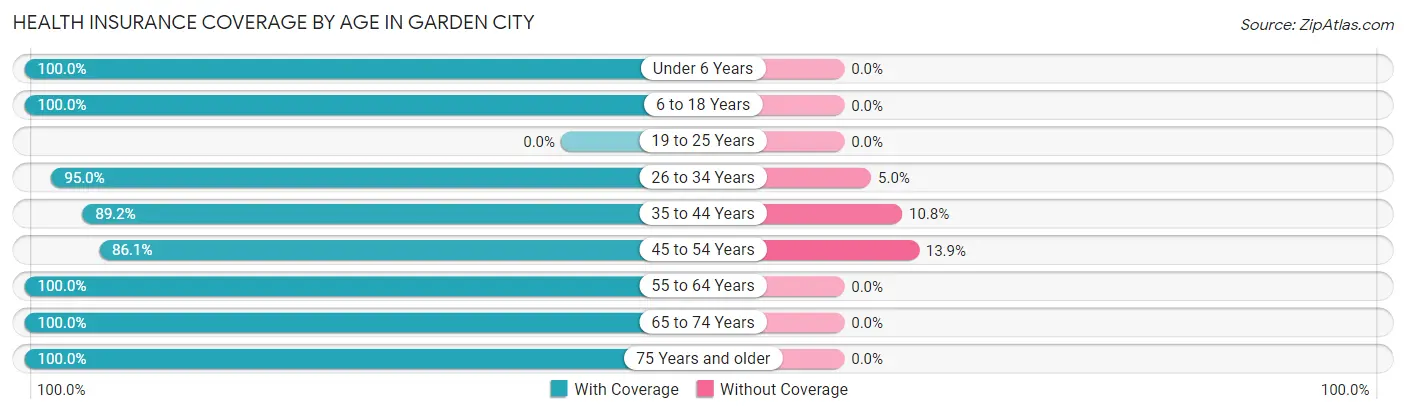
| Age Bracket | With Coverage | Without Coverage |
| Under 6 Years | 40 (100.0%) | 0 (0.0%) |
| 6 to 18 Years | 147 (100.0%) | 0 (0.0%) |
| 19 to 25 Years | 0 (0.0%) | 0 (0.0%) |
| 26 to 34 Years | 57 (95.0%) | 3 (5.0%) |
| 35 to 44 Years | 58 (89.2%) | 7 (10.8%) |
| 45 to 54 Years | 31 (86.1%) | 5 (13.9%) |
| 55 to 64 Years | 27 (100.0%) | 0 (0.0%) |
| 65 to 74 Years | 102 (100.0%) | 0 (0.0%) |
| 75 Years and older | 53 (100.0%) | 0 (0.0%) |
| Total | 515 (97.2%) | 15 (2.8%) |
Health Insurance Coverage by Citizenship Status in Garden City
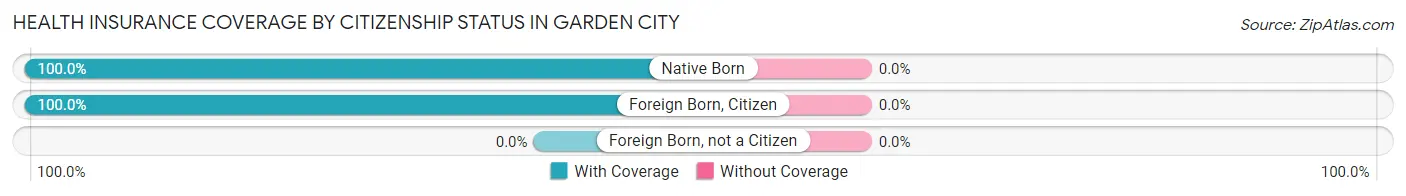
| Citizenship Status | With Coverage | Without Coverage |
| Native Born | 40 (100.0%) | 0 (0.0%) |
| Foreign Born, Citizen | 147 (100.0%) | 0 (0.0%) |
| Foreign Born, not a Citizen | 0 (0.0%) | 0 (0.0%) |
Health Insurance Coverage by Household Income in Garden City
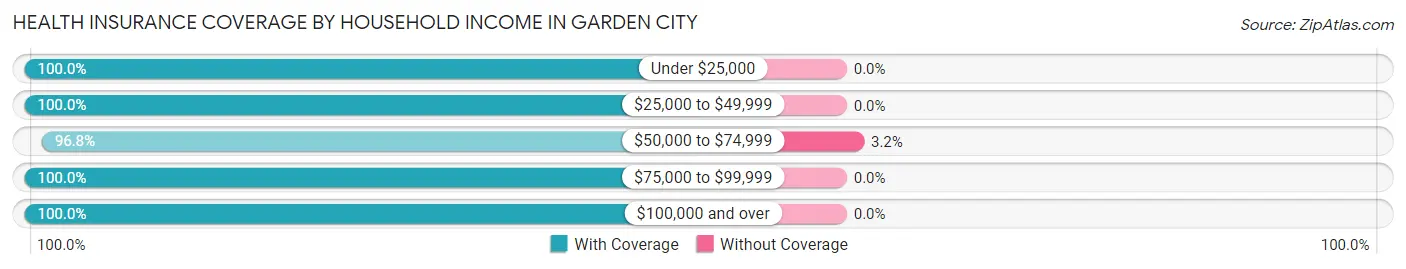
| Household Income | With Coverage | Without Coverage |
| Under $25,000 | 20 (100.0%) | 0 (0.0%) |
| $25,000 to $49,999 | 170 (100.0%) | 0 (0.0%) |
| $50,000 to $74,999 | 210 (96.8%) | 7 (3.2%) |
| $75,000 to $99,999 | 38 (100.0%) | 0 (0.0%) |
| $100,000 and over | 77 (100.0%) | 0 (0.0%) |
Public vs Private Health Insurance Coverage by Age in Garden City
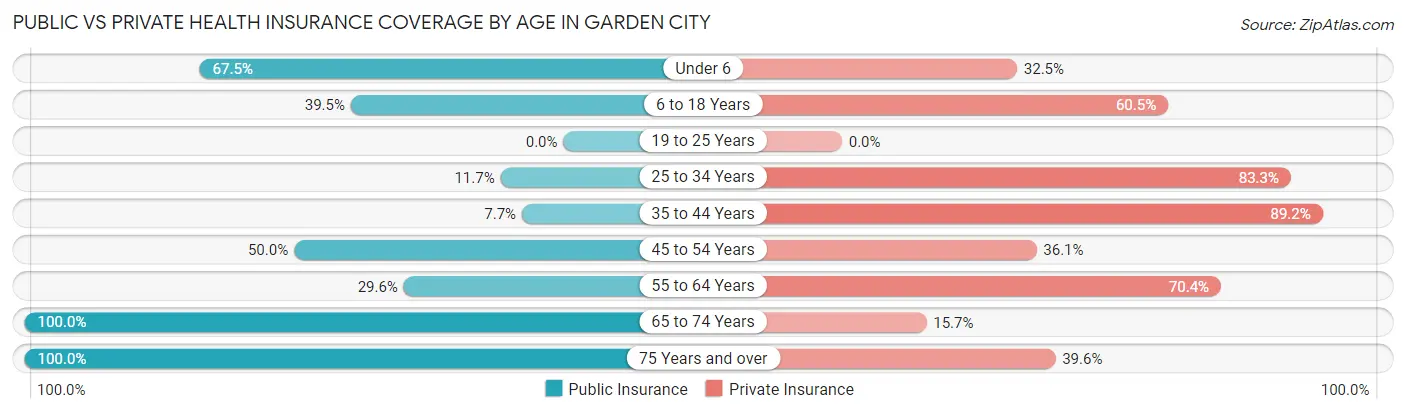
| Age Bracket | Public Insurance | Private Insurance |
| Under 6 | 27 (67.5%) | 13 (32.5%) |
| 6 to 18 Years | 58 (39.5%) | 89 (60.5%) |
| 19 to 25 Years | 0 (0.0%) | 0 (0.0%) |
| 25 to 34 Years | 7 (11.7%) | 50 (83.3%) |
| 35 to 44 Years | 5 (7.7%) | 58 (89.2%) |
| 45 to 54 Years | 18 (50.0%) | 13 (36.1%) |
| 55 to 64 Years | 8 (29.6%) | 19 (70.4%) |
| 65 to 74 Years | 102 (100.0%) | 16 (15.7%) |
| 75 Years and over | 53 (100.0%) | 21 (39.6%) |
| Total | 278 (52.4%) | 279 (52.6%) |
Disability Status by Sex by Age in Garden City
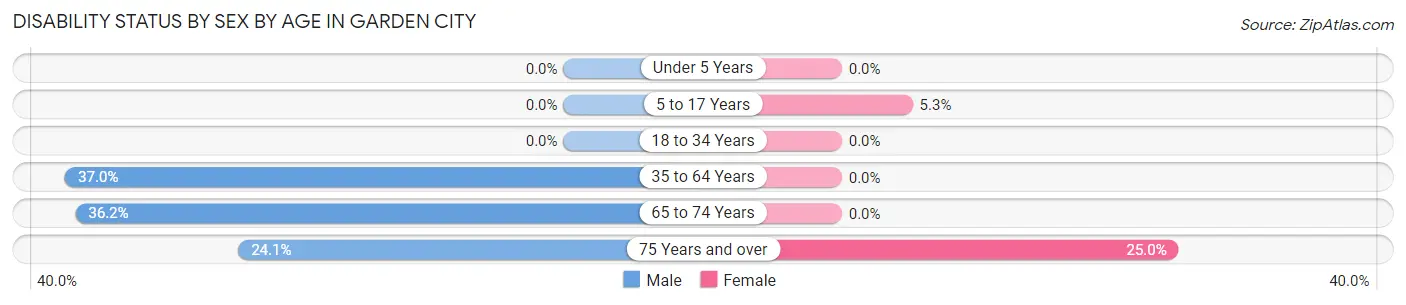
| Age Bracket | Male | Female |
| Under 5 Years | 0 (0.0%) | 0 (0.0%) |
| 5 to 17 Years | 0 (0.0%) | 5 (5.3%) |
| 18 to 34 Years | 0 (0.0%) | 0 (0.0%) |
| 35 to 64 Years | 27 (37.0%) | 0 (0.0%) |
| 65 to 74 Years | 25 (36.2%) | 0 (0.0%) |
| 75 Years and over | 7 (24.1%) | 6 (25.0%) |
Disability Class by Sex by Age in Garden City
Disability Class: Hearing Difficulty
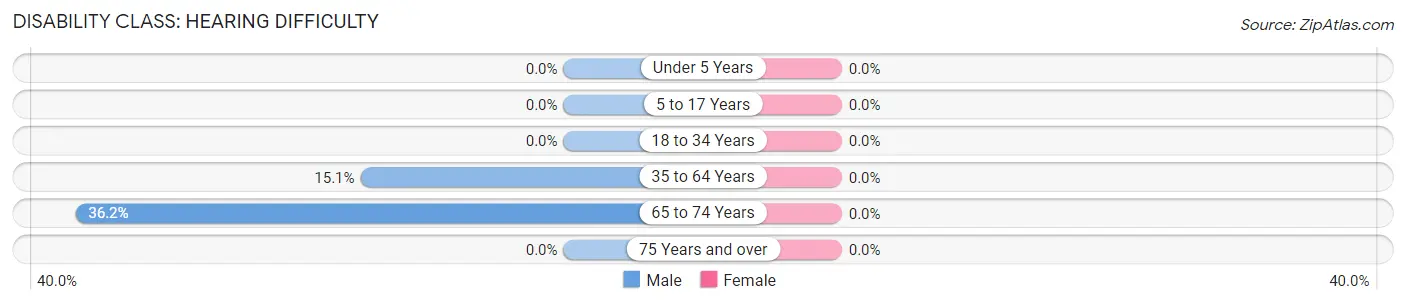
| Age Bracket | Male | Female |
| Under 5 Years | 0 (0.0%) | 0 (0.0%) |
| 5 to 17 Years | 0 (0.0%) | 0 (0.0%) |
| 18 to 34 Years | 0 (0.0%) | 0 (0.0%) |
| 35 to 64 Years | 11 (15.1%) | 0 (0.0%) |
| 65 to 74 Years | 25 (36.2%) | 0 (0.0%) |
| 75 Years and over | 0 (0.0%) | 0 (0.0%) |
Disability Class: Vision Difficulty
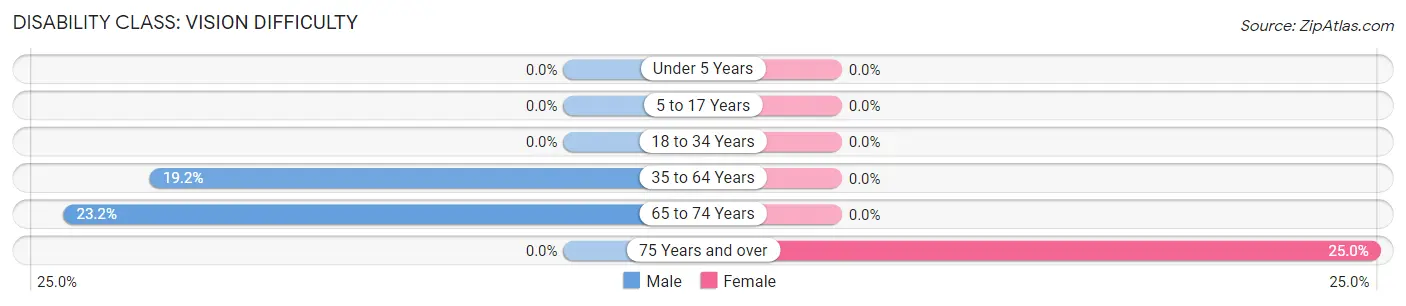
| Age Bracket | Male | Female |
| Under 5 Years | 0 (0.0%) | 0 (0.0%) |
| 5 to 17 Years | 0 (0.0%) | 0 (0.0%) |
| 18 to 34 Years | 0 (0.0%) | 0 (0.0%) |
| 35 to 64 Years | 14 (19.2%) | 0 (0.0%) |
| 65 to 74 Years | 16 (23.2%) | 0 (0.0%) |
| 75 Years and over | 0 (0.0%) | 6 (25.0%) |
Disability Class: Cognitive Difficulty
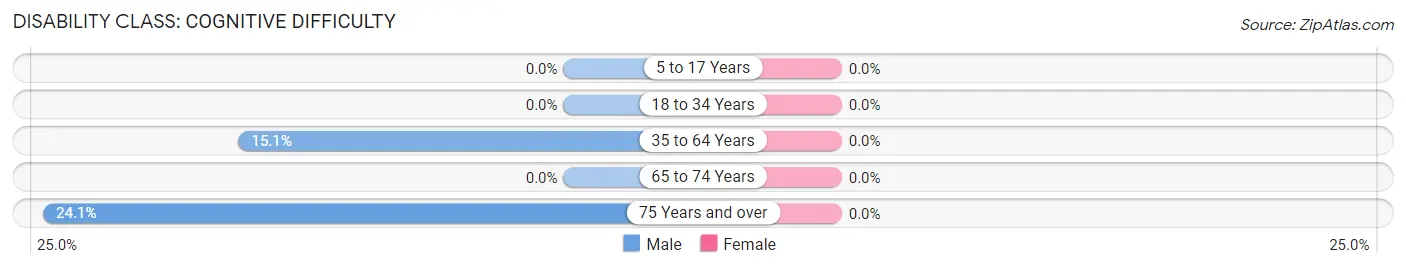
| Age Bracket | Male | Female |
| 5 to 17 Years | 0 (0.0%) | 0 (0.0%) |
| 18 to 34 Years | 0 (0.0%) | 0 (0.0%) |
| 35 to 64 Years | 11 (15.1%) | 0 (0.0%) |
| 65 to 74 Years | 0 (0.0%) | 0 (0.0%) |
| 75 Years and over | 7 (24.1%) | 0 (0.0%) |
Disability Class: Ambulatory Difficulty
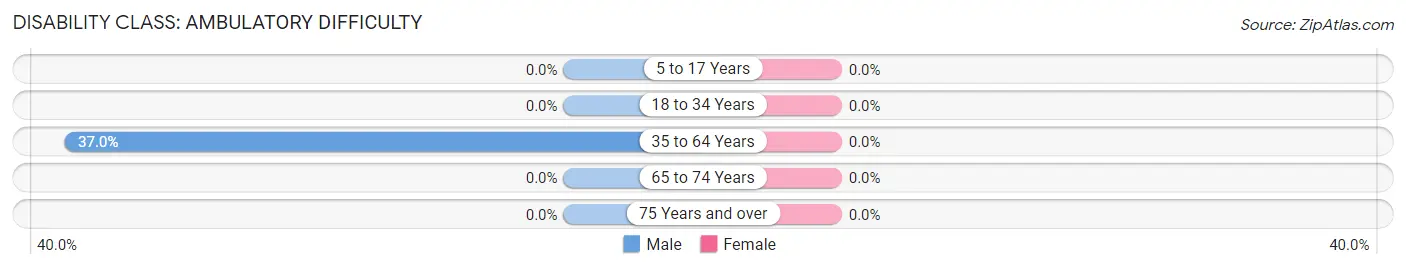
| Age Bracket | Male | Female |
| 5 to 17 Years | 0 (0.0%) | 0 (0.0%) |
| 18 to 34 Years | 0 (0.0%) | 0 (0.0%) |
| 35 to 64 Years | 27 (37.0%) | 0 (0.0%) |
| 65 to 74 Years | 0 (0.0%) | 0 (0.0%) |
| 75 Years and over | 0 (0.0%) | 0 (0.0%) |
Disability Class: Self-Care Difficulty
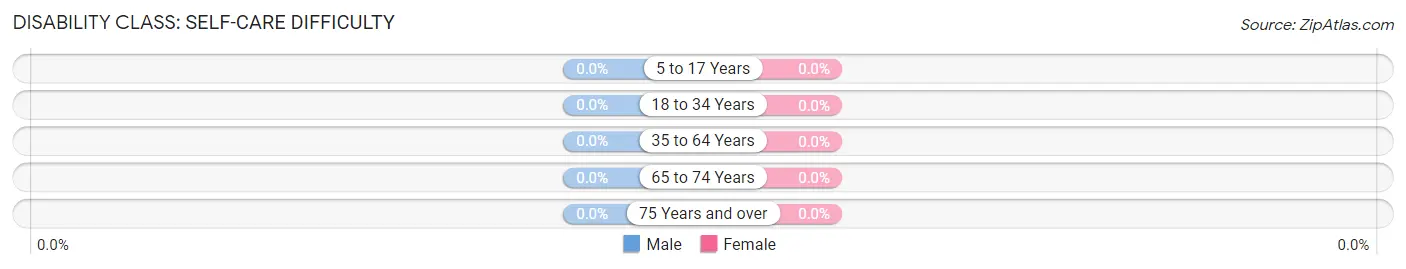
| Age Bracket | Male | Female |
| 5 to 17 Years | 0 (0.0%) | 0 (0.0%) |
| 18 to 34 Years | 0 (0.0%) | 0 (0.0%) |
| 35 to 64 Years | 0 (0.0%) | 0 (0.0%) |
| 65 to 74 Years | 0 (0.0%) | 0 (0.0%) |
| 75 Years and over | 0 (0.0%) | 0 (0.0%) |
Technology Access in Garden City
Computing Device Access in Garden City
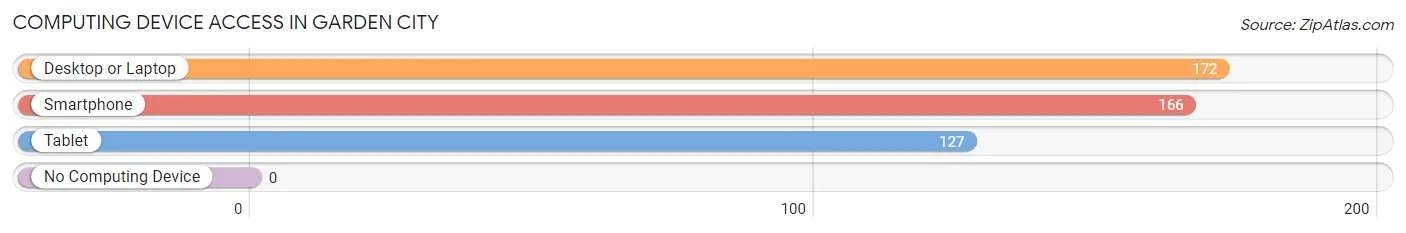
| Device Type | # Households | % Households |
| Desktop or Laptop | 172 | 96.6% |
| Smartphone | 166 | 93.3% |
| Tablet | 127 | 71.4% |
| No Computing Device | 0 | 0.0% |
| Total | 178 | 100.0% |
Internet Access in Garden City
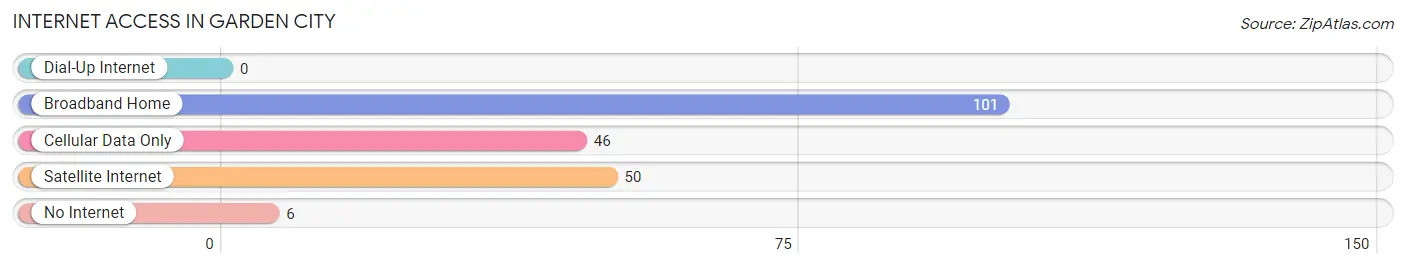
| Internet Type | # Households | % Households |
| Dial-Up Internet | 0 | 0.0% |
| Broadband Home | 101 | 56.7% |
| Cellular Data Only | 46 | 25.8% |
| Satellite Internet | 50 | 28.1% |
| No Internet | 6 | 3.4% |
| Total | 178 | 100.0% |
Garden City Summary
Garden City, Utah is a small city located in Rich County, Utah, United States. It is situated on the eastern shore of Bear Lake, a large natural lake that straddles the Utah-Idaho border. The city is located about 20 miles (32 km) north of Logan, Utah, and about 30 miles (48 km) south of Montpelier, Idaho. As of the 2010 census, the population of Garden City was 562.
History
Garden City was first settled in 1864 by a group of Mormon pioneers led by William S. Seeley. The pioneers named the settlement after the Garden of Eden, as they believed the area to be a paradise. The settlers built a fort and planted crops, and the settlement quickly grew. In 1872, the settlement was incorporated as a city.
In the late 19th century, Garden City became a popular tourist destination due to its proximity to Bear Lake. The city was home to several resorts, including the Garden City Hotel, which was built in 1891. The hotel was a popular destination for visitors from Utah and Idaho, and it was the site of many social events.
In the early 20th century, the city's economy shifted from tourism to agriculture. The city's population grew steadily throughout the 20th century, reaching a peak of 845 in 2000.
Geography
Garden City is located in Rich County, Utah, at an elevation of 5,890 feet (1,795 m). The city is situated on the eastern shore of Bear Lake, a large natural lake that straddles the Utah-Idaho border. The city is located about 20 miles (32 km) north of Logan, Utah, and about 30 miles (48 km) south of Montpelier, Idaho.
The city has a total area of 1.2 square miles (3.2 km2), all of which is land. The city is surrounded by mountains, including the Bear River Range to the east and the Wellsville Mountains to the west.
Economy
Garden City's economy is largely based on tourism and agriculture. The city is home to several resorts, including the Garden City Hotel, which was built in 1891. The city is also home to several farms, which produce hay, potatoes, and other crops.
The city is also home to several businesses, including restaurants, retail stores, and a marina. The city is also home to a small airport, which serves the local area.
Demographics
As of the 2010 census, the population of Garden City was 562. The racial makeup of the city was 97.2% White, 0.2% African American, 0.2% Native American, 0.2% Asian, 0.2% Pacific Islander, 0.7% from other races, and 1.1% from two or more races. Hispanic or Latino of any race were 2.3% of the population.
The median income for a household in the city was $37,500, and the median income for a family was $41,250. The per capita income for the city was $17,845. About 8.3% of families and 10.2% of the population were below the poverty line, including 11.3% of those under age 18 and 8.3% of those age 65 or over.
Common Questions
What is Per Capita Income in Garden City?
Per Capita income in Garden City is $24,855.
What is the Median Family Income in Garden City?
Median Family Income in Garden City is $66,731.
What is the Median Household income in Garden City?
Median Household Income in Garden City is $63,125.
What is Income or Wage Gap in Garden City?
Income or Wage Gap in Garden City is 23.3%.
Women in Garden City earn 76.7 cents for every dollar earned by a man.
What is Inequality or Gini Index in Garden City?
Inequality or Gini Index in Garden City is 0.39.
What is the Total Population of Garden City?
Total Population of Garden City is 530.
What is the Total Male Population of Garden City?
Total Male Population of Garden City is 300.
What is the Total Female Population of Garden City?
Total Female Population of Garden City is 230.
What is the Ratio of Males per 100 Females in Garden City?
There are 130.43 Males per 100 Females in Garden City.
What is the Ratio of Females per 100 Males in Garden City?
There are 76.67 Females per 100 Males in Garden City.
What is the Median Population Age in Garden City?
Median Population Age in Garden City is 36.5 Years.
What is the Average Family Size in Garden City
Average Family Size in Garden City is 3.6 People.
What is the Average Household Size in Garden City
Average Household Size in Garden City is 2.9 People.
How Large is the Labor Force in Garden City?
There are 219 People in the Labor Forcein in Garden City.
What is the Percentage of People in the Labor Force in Garden City?
61.7% of People are in the Labor Force in Garden City.
What is the Unemployment Rate in Garden City?
Unemployment Rate in Garden City is 3.2%.