Zip Codes with the Highest Percentage of Population Employed in Legal Services & Support in Brownsville, TX
RELATED REPORTS & OPTIONS
Legal Services & Support
Brownsville
Compare Zip Codes
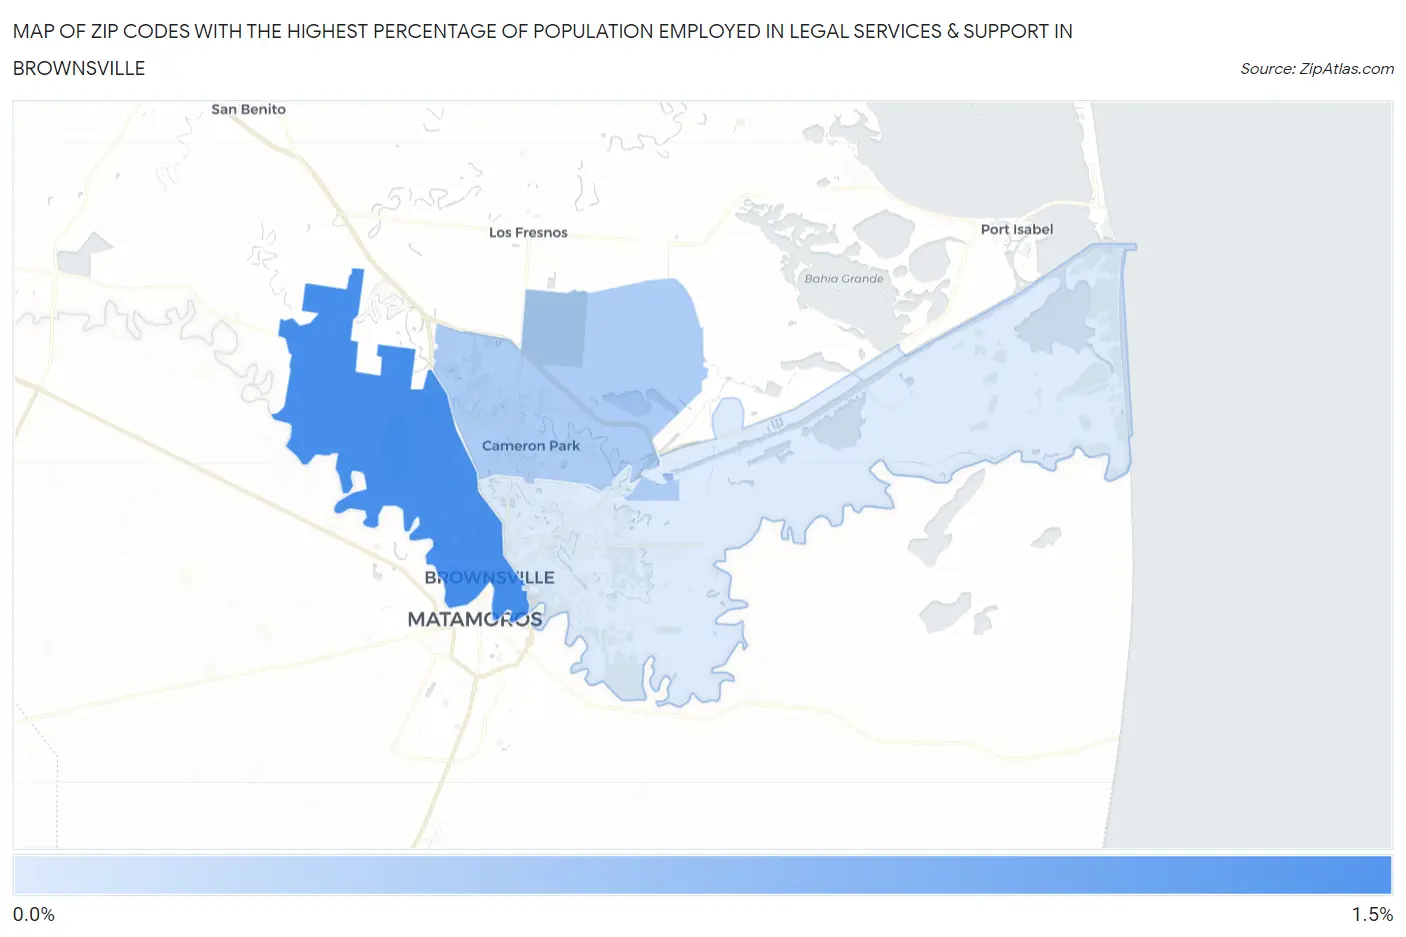
Map of Zip Codes with the Highest Percentage of Population Employed in Legal Services & Support in Brownsville
0.39%
1.0%
Zip Codes with the Highest Percentage of Population Employed in Legal Services & Support in Brownsville, TX
| Zip Code | % Employed | vs State | vs National | |
| 1. | 78520 | 1.0% | 1.0%(-0.003)#438 | 1.2%(-0.178)#7,788 |
| 2. | 78526 | 0.58% | 1.0%(-0.427)#695 | 1.2%(-0.602)#11,669 |
| 3. | 78521 | 0.39% | 1.0%(-0.622)#852 | 1.2%(-0.798)#13,994 |
1
Common Questions
What are the Top Zip Codes with the Highest Percentage of Population Employed in Legal Services & Support in Brownsville, TX?
Top Zip Codes with the Highest Percentage of Population Employed in Legal Services & Support in Brownsville, TX are:
What zip code has the Highest Percentage of Population Employed in Legal Services & Support in Brownsville, TX?
78520 has the Highest Percentage of Population Employed in Legal Services & Support in Brownsville, TX with 1.0%.
What is the Percentage of Population Employed in Legal Services & Support in Brownsville, TX?
Percentage of Population Employed in Legal Services & Support in Brownsville is 0.71%.
What is the Percentage of Population Employed in Legal Services & Support in Texas?
Percentage of Population Employed in Legal Services & Support in Texas is 1.0%.
What is the Percentage of Population Employed in Legal Services & Support in the United States?
Percentage of Population Employed in Legal Services & Support in the United States is 1.2%.