Zip Codes with the Highest Percentage of Population Employed in Legal Services & Support in Tomball, TX
RELATED REPORTS & OPTIONS
Legal Services & Support
Tomball
Compare Zip Codes
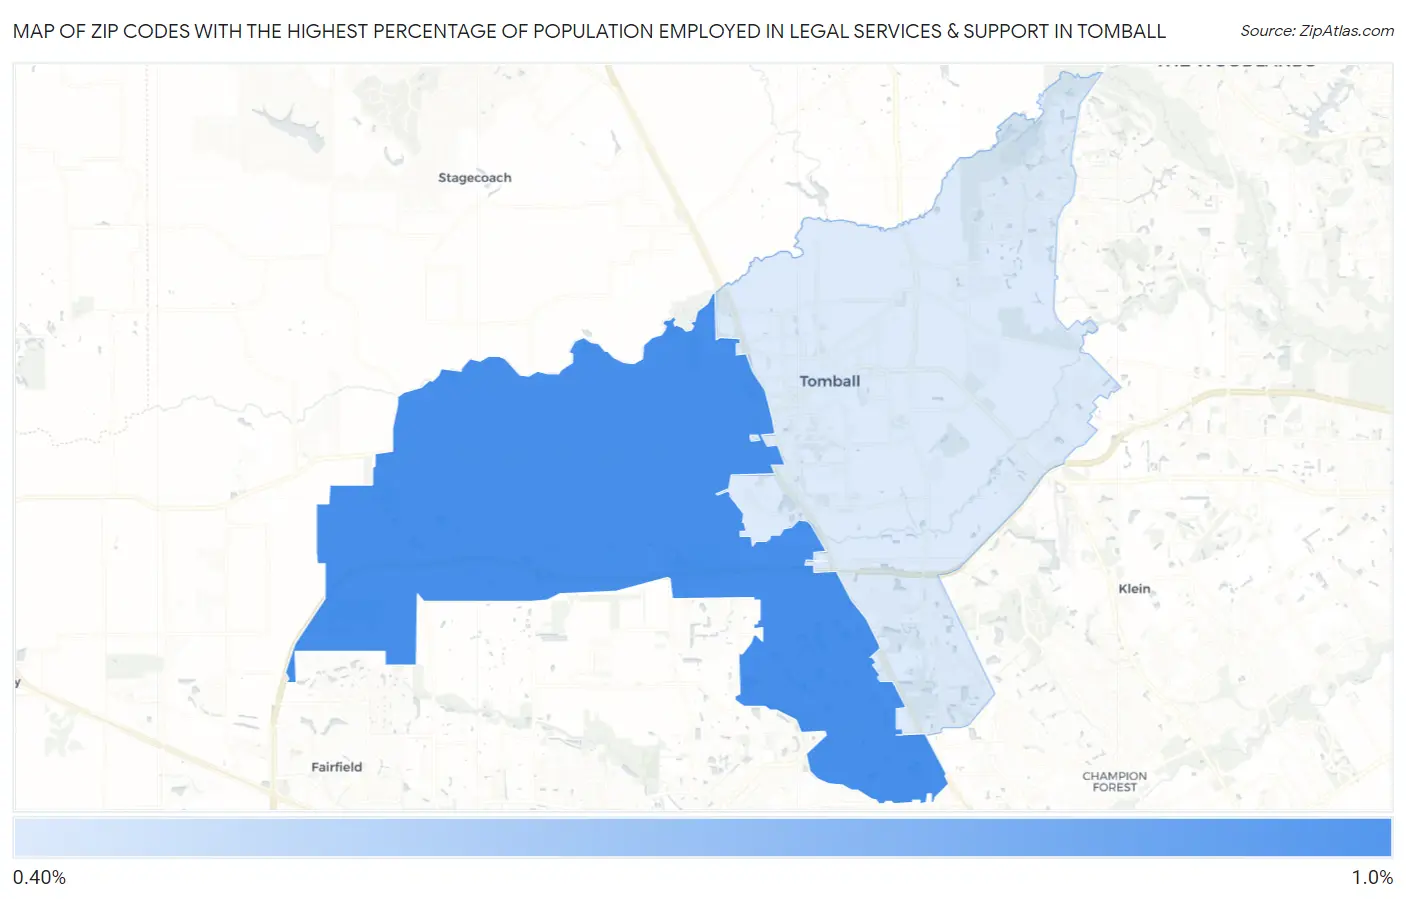
Map of Zip Codes with the Highest Percentage of Population Employed in Legal Services & Support in Tomball
0.45%
0.82%
Zip Codes with the Highest Percentage of Population Employed in Legal Services & Support in Tomball, TX
| Zip Code | % Employed | vs State | vs National | |
| 1. | 77377 | 0.82% | 1.0%(-0.188)#515 | 1.2%(-0.364)#9,279 |
| 2. | 77375 | 0.45% | 1.0%(-0.554)#801 | 1.2%(-0.730)#13,218 |
1
Common Questions
What are the Top Zip Codes with the Highest Percentage of Population Employed in Legal Services & Support in Tomball, TX?
Top Zip Codes with the Highest Percentage of Population Employed in Legal Services & Support in Tomball, TX are:
What zip code has the Highest Percentage of Population Employed in Legal Services & Support in Tomball, TX?
77377 has the Highest Percentage of Population Employed in Legal Services & Support in Tomball, TX with 0.82%.
What is the Percentage of Population Employed in Legal Services & Support in Tomball, TX?
Percentage of Population Employed in Legal Services & Support in Tomball is 0.50%.
What is the Percentage of Population Employed in Legal Services & Support in Texas?
Percentage of Population Employed in Legal Services & Support in Texas is 1.0%.
What is the Percentage of Population Employed in Legal Services & Support in the United States?
Percentage of Population Employed in Legal Services & Support in the United States is 1.2%.