Zip Codes with the Highest Percentage of Population Employed in Legal Services & Support in Denton, TX
RELATED REPORTS & OPTIONS
Legal Services & Support
Denton
Compare Zip Codes
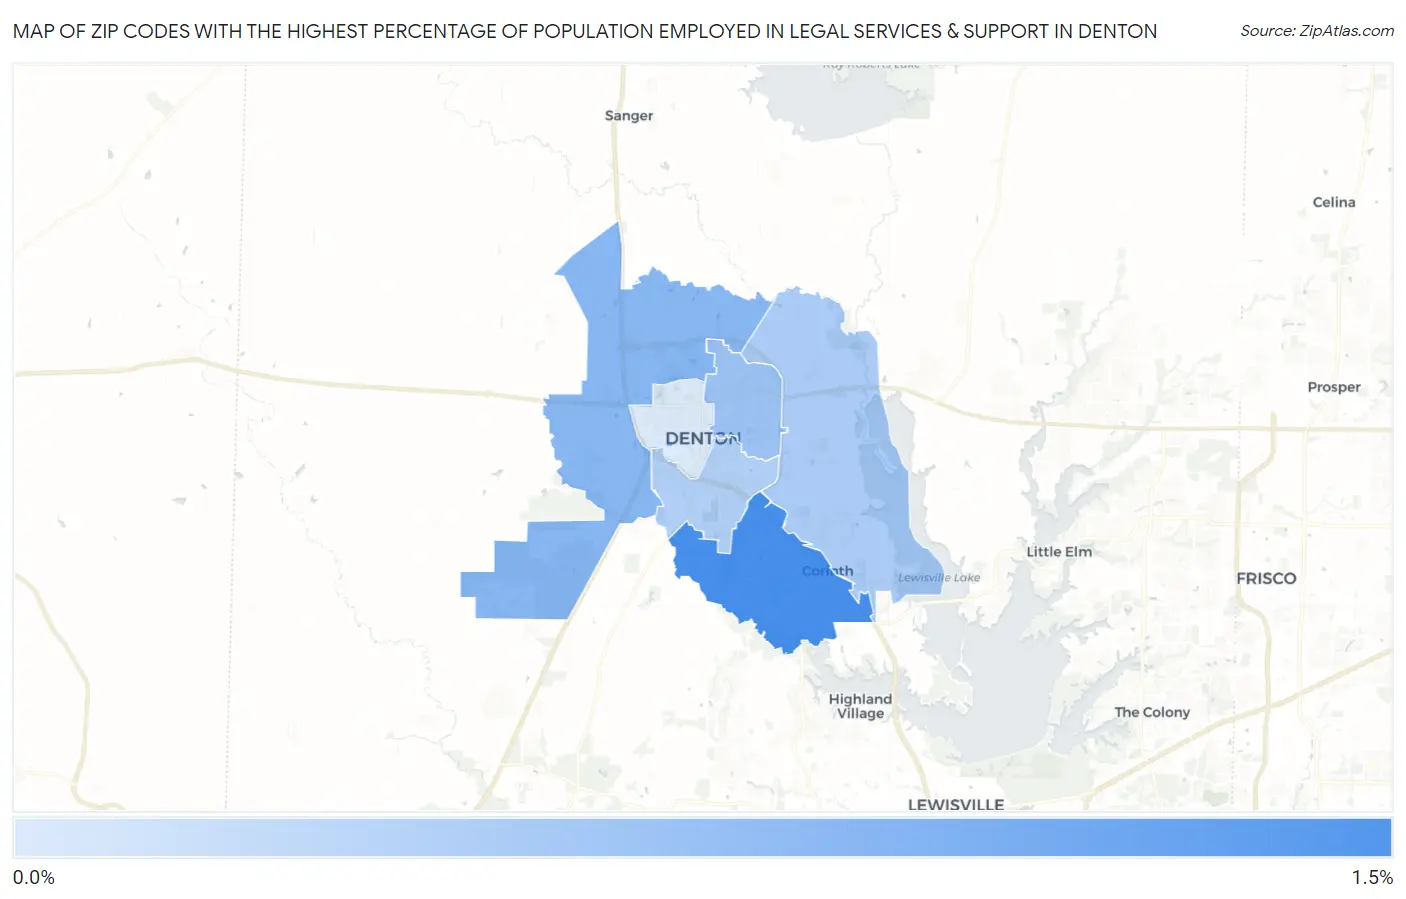
Map of Zip Codes with the Highest Percentage of Population Employed in Legal Services & Support in Denton
0.11%
1.0%
Zip Codes with the Highest Percentage of Population Employed in Legal Services & Support in Denton, TX
| Zip Code | % Employed | vs State | vs National | |
| 1. | 76210 | 1.0% | 1.0%(+0.027)#422 | 1.2%(-0.149)#7,582 |
| 2. | 76207 | 0.64% | 1.0%(-0.366)#646 | 1.2%(-0.542)#11,010 |
| 3. | 76209 | 0.50% | 1.0%(-0.504)#740 | 1.2%(-0.680)#12,580 |
| 4. | 76208 | 0.42% | 1.0%(-0.587)#826 | 1.2%(-0.763)#13,589 |
| 5. | 76205 | 0.38% | 1.0%(-0.624)#855 | 1.2%(-0.800)#14,019 |
| 6. | 76201 | 0.11% | 1.0%(-0.895)#1,065 | 1.2%(-1.07)#17,017 |
1
Common Questions
What are the Top 5 Zip Codes with the Highest Percentage of Population Employed in Legal Services & Support in Denton, TX?
Top 5 Zip Codes with the Highest Percentage of Population Employed in Legal Services & Support in Denton, TX are:
What zip code has the Highest Percentage of Population Employed in Legal Services & Support in Denton, TX?
76210 has the Highest Percentage of Population Employed in Legal Services & Support in Denton, TX with 1.0%.
What is the Percentage of Population Employed in Legal Services & Support in Denton, TX?
Percentage of Population Employed in Legal Services & Support in Denton is 0.44%.
What is the Percentage of Population Employed in Legal Services & Support in Texas?
Percentage of Population Employed in Legal Services & Support in Texas is 1.0%.
What is the Percentage of Population Employed in Legal Services & Support in the United States?
Percentage of Population Employed in Legal Services & Support in the United States is 1.2%.