Zip Codes with the Highest Percentage of Population Employed in Legal Services & Support in Bedford, TX
RELATED REPORTS & OPTIONS
Legal Services & Support
Bedford
Compare Zip Codes
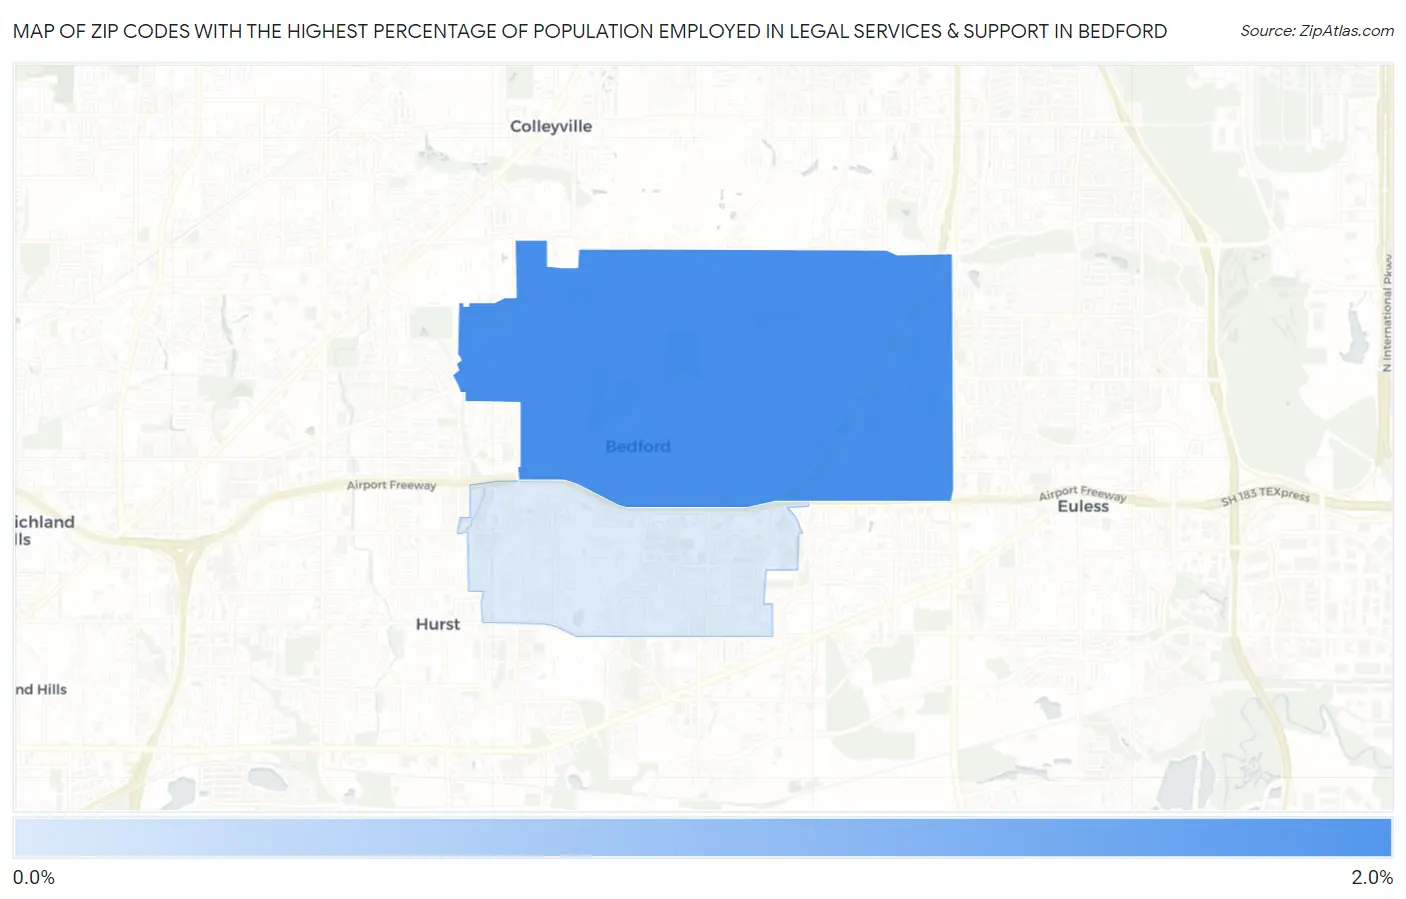
Map of Zip Codes with the Highest Percentage of Population Employed in Legal Services & Support in Bedford
0.74%
1.6%
Zip Codes with the Highest Percentage of Population Employed in Legal Services & Support in Bedford, TX
| Zip Code | % Employed | vs State | vs National | |
| 1. | 76021 | 1.6% | 1.0%(+0.604)#244 | 1.2%(+0.428)#4,633 |
| 2. | 76022 | 0.74% | 1.0%(-0.271)#569 | 1.2%(-0.446)#10,034 |
1
Common Questions
What are the Top Zip Codes with the Highest Percentage of Population Employed in Legal Services & Support in Bedford, TX?
Top Zip Codes with the Highest Percentage of Population Employed in Legal Services & Support in Bedford, TX are:
What zip code has the Highest Percentage of Population Employed in Legal Services & Support in Bedford, TX?
76021 has the Highest Percentage of Population Employed in Legal Services & Support in Bedford, TX with 1.6%.
What is the Percentage of Population Employed in Legal Services & Support in Bedford, TX?
Percentage of Population Employed in Legal Services & Support in Bedford is 1.4%.
What is the Percentage of Population Employed in Legal Services & Support in Texas?
Percentage of Population Employed in Legal Services & Support in Texas is 1.0%.
What is the Percentage of Population Employed in Legal Services & Support in the United States?
Percentage of Population Employed in Legal Services & Support in the United States is 1.2%.