Zip Codes with the Highest Percentage of Population Employed in Legal Services & Support in Pearland, TX
RELATED REPORTS & OPTIONS
Legal Services & Support
Pearland
Compare Zip Codes
Map of Zip Codes with the Highest Percentage of Population Employed in Legal Services & Support in Pearland
0.69%
1.2%
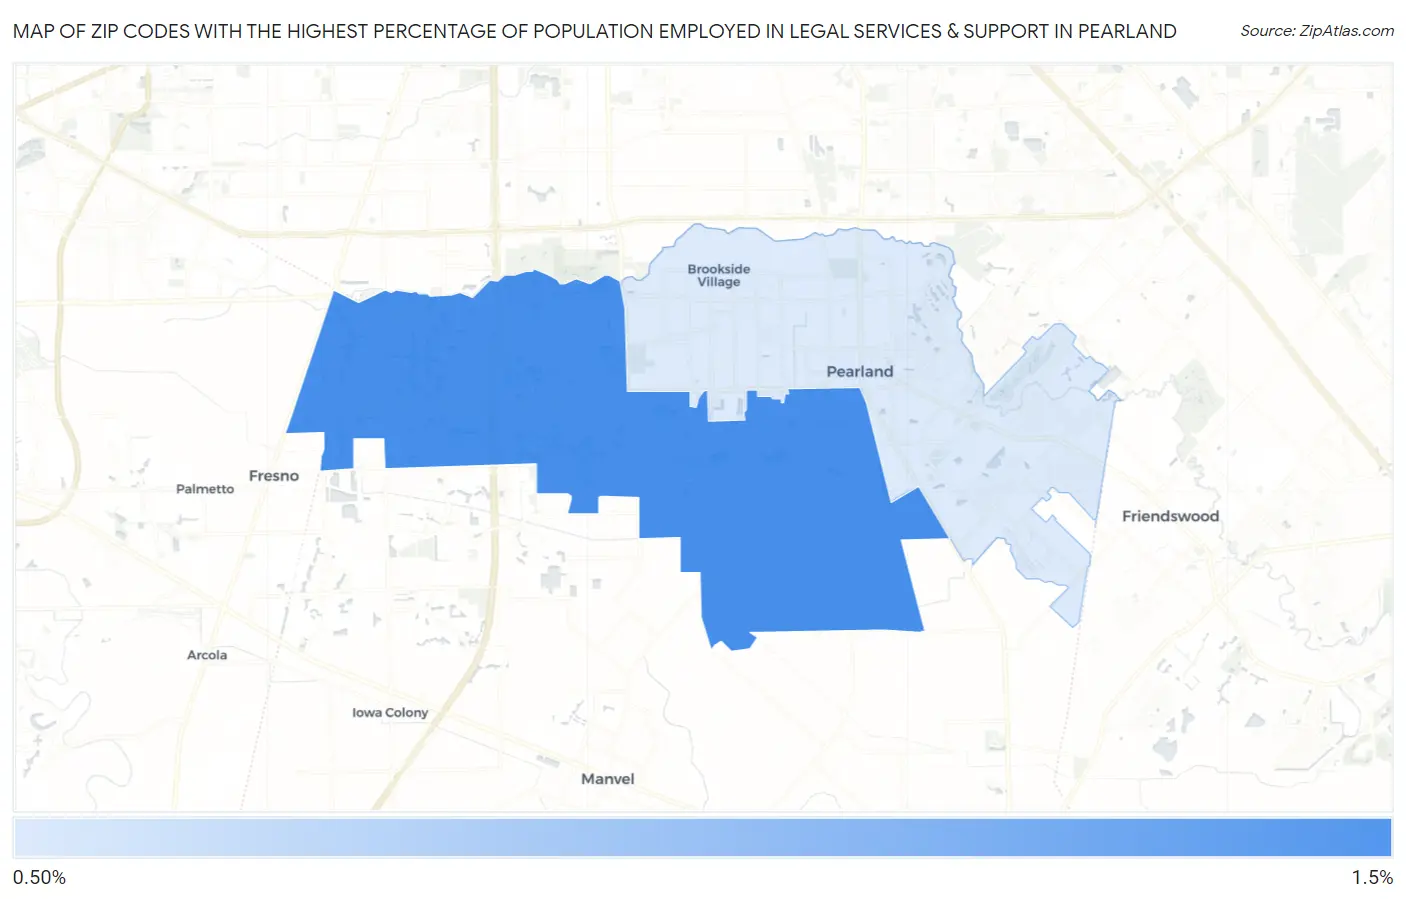
Zip Codes with the Highest Percentage of Population Employed in Legal Services & Support in Pearland, TX
| Zip Code | % Employed | vs State | vs National | |
| 1. | 77584 | 1.2% | 1.0%(+0.230)#339 | 1.2%(+0.054)#6,278 |
| 2. | 77581 | 0.69% | 1.0%(-0.315)#606 | 1.2%(-0.491)#10,478 |
1
Common Questions
What are the Top Zip Codes with the Highest Percentage of Population Employed in Legal Services & Support in Pearland, TX?
Top Zip Codes with the Highest Percentage of Population Employed in Legal Services & Support in Pearland, TX are:
What zip code has the Highest Percentage of Population Employed in Legal Services & Support in Pearland, TX?
77584 has the Highest Percentage of Population Employed in Legal Services & Support in Pearland, TX with 1.2%.
What is the Percentage of Population Employed in Legal Services & Support in Pearland, TX?
Percentage of Population Employed in Legal Services & Support in Pearland is 0.91%.
What is the Percentage of Population Employed in Legal Services & Support in Texas?
Percentage of Population Employed in Legal Services & Support in Texas is 1.0%.
What is the Percentage of Population Employed in Legal Services & Support in the United States?
Percentage of Population Employed in Legal Services & Support in the United States is 1.2%.