Zip Codes with the Highest Percentage of Population Employed in Security & Protection in Corpus Christi, TX
RELATED REPORTS & OPTIONS
Security & Protection
Corpus Christi
Compare Zip Codes
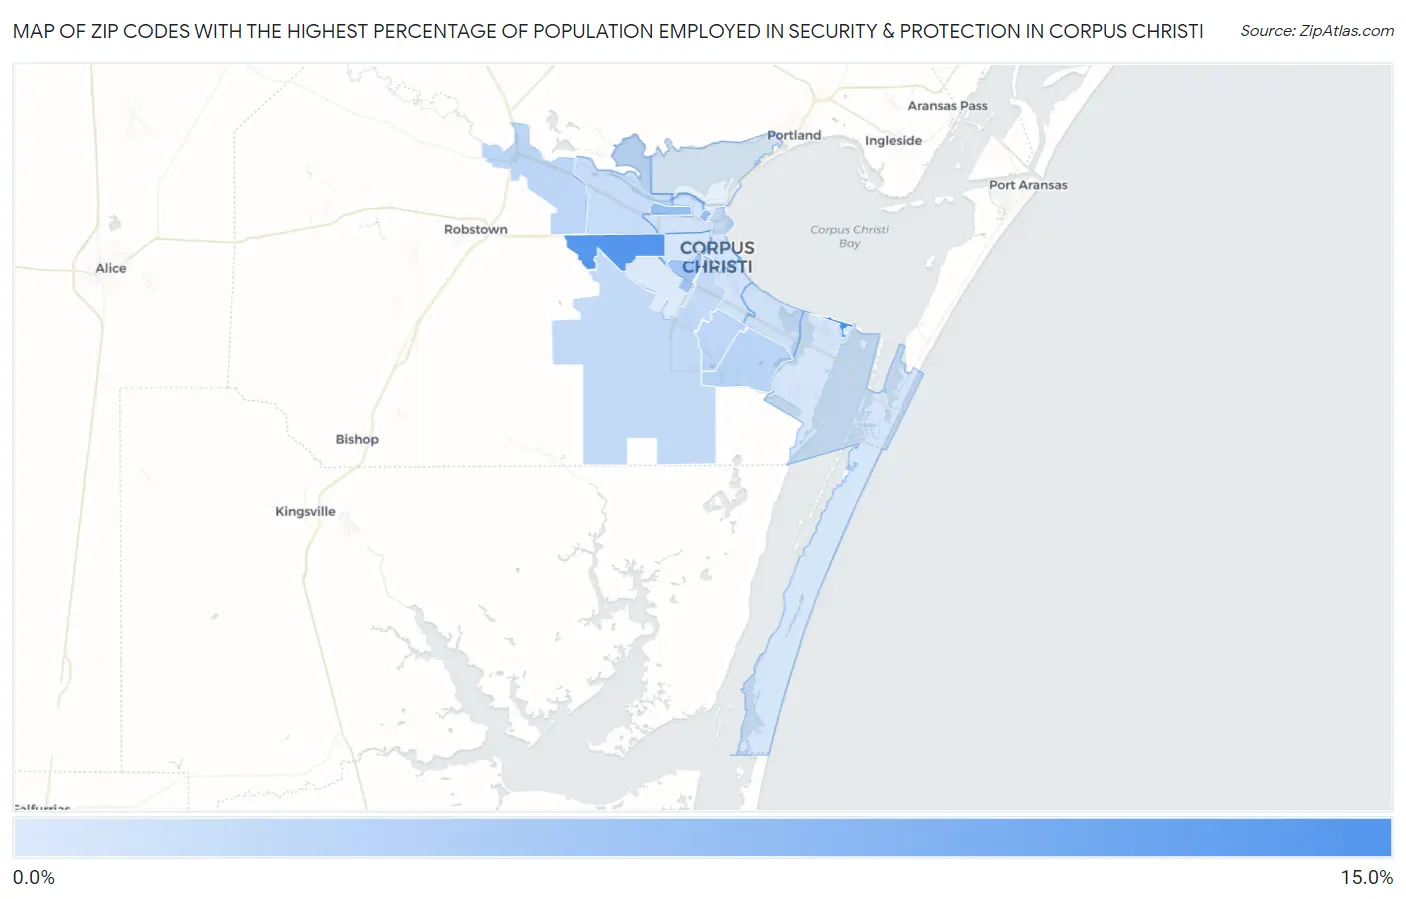
Map of Zip Codes with the Highest Percentage of Population Employed in Security & Protection in Corpus Christi
1.1%
13.4%
Zip Codes with the Highest Percentage of Population Employed in Security & Protection in Corpus Christi, TX
| Zip Code | % Employed | vs State | vs National | |
| 1. | 78419 | 13.4% | 2.2%(+11.2)#35 | 2.1%(+11.3)#449 |
| 2. | 78406 | 12.2% | 2.2%(+10.0)#42 | 2.1%(+10.1)#531 |
| 3. | 78407 | 6.9% | 2.2%(+4.65)#137 | 2.1%(+4.73)#1,593 |
| 4. | 78416 | 5.9% | 2.2%(+3.63)#173 | 2.1%(+3.71)#2,175 |
| 5. | 78414 | 3.8% | 2.2%(+1.53)#369 | 2.1%(+1.61)#5,018 |
| 6. | 78410 | 3.6% | 2.2%(+1.39)#397 | 2.1%(+1.46)#5,374 |
| 7. | 78413 | 3.5% | 2.2%(+1.24)#422 | 2.1%(+1.32)#5,773 |
| 8. | 78401 | 3.3% | 2.2%(+1.12)#445 | 2.1%(+1.20)#6,102 |
| 9. | 78415 | 3.0% | 2.2%(+0.812)#510 | 2.1%(+0.887)#7,084 |
| 10. | 78409 | 2.7% | 2.2%(+0.523)#593 | 2.1%(+0.598)#8,323 |
| 11. | 78412 | 2.2% | 2.2%(-0.014)#778 | 2.1%(+0.062)#11,196 |
| 12. | 78408 | 2.0% | 2.2%(-0.245)#873 | 2.1%(-0.169)#12,696 |
| 13. | 78411 | 1.9% | 2.2%(-0.293)#890 | 2.1%(-0.218)#13,015 |
| 14. | 78404 | 1.8% | 2.2%(-0.442)#958 | 2.1%(-0.367)#14,090 |
| 15. | 78418 | 1.6% | 2.2%(-0.575)#1,015 | 2.1%(-0.499)#15,038 |
| 16. | 78405 | 1.6% | 2.2%(-0.577)#1,016 | 2.1%(-0.502)#15,066 |
| 17. | 78417 | 1.1% | 2.2%(-1.10)#1,233 | 2.1%(-1.03)#19,128 |
1
Common Questions
What are the Top 10 Zip Codes with the Highest Percentage of Population Employed in Security & Protection in Corpus Christi, TX?
Top 10 Zip Codes with the Highest Percentage of Population Employed in Security & Protection in Corpus Christi, TX are:
What zip code has the Highest Percentage of Population Employed in Security & Protection in Corpus Christi, TX?
78419 has the Highest Percentage of Population Employed in Security & Protection in Corpus Christi, TX with 13.4%.
What is the Percentage of Population Employed in Security & Protection in Corpus Christi, TX?
Percentage of Population Employed in Security & Protection in Corpus Christi is 2.9%.
What is the Percentage of Population Employed in Security & Protection in Texas?
Percentage of Population Employed in Security & Protection in Texas is 2.2%.
What is the Percentage of Population Employed in Security & Protection in the United States?
Percentage of Population Employed in Security & Protection in the United States is 2.1%.