Zip Codes with the Highest Percentage of Population Employed in Security & Protection in Mission, TX
RELATED REPORTS & OPTIONS
Security & Protection
Mission
Compare Zip Codes
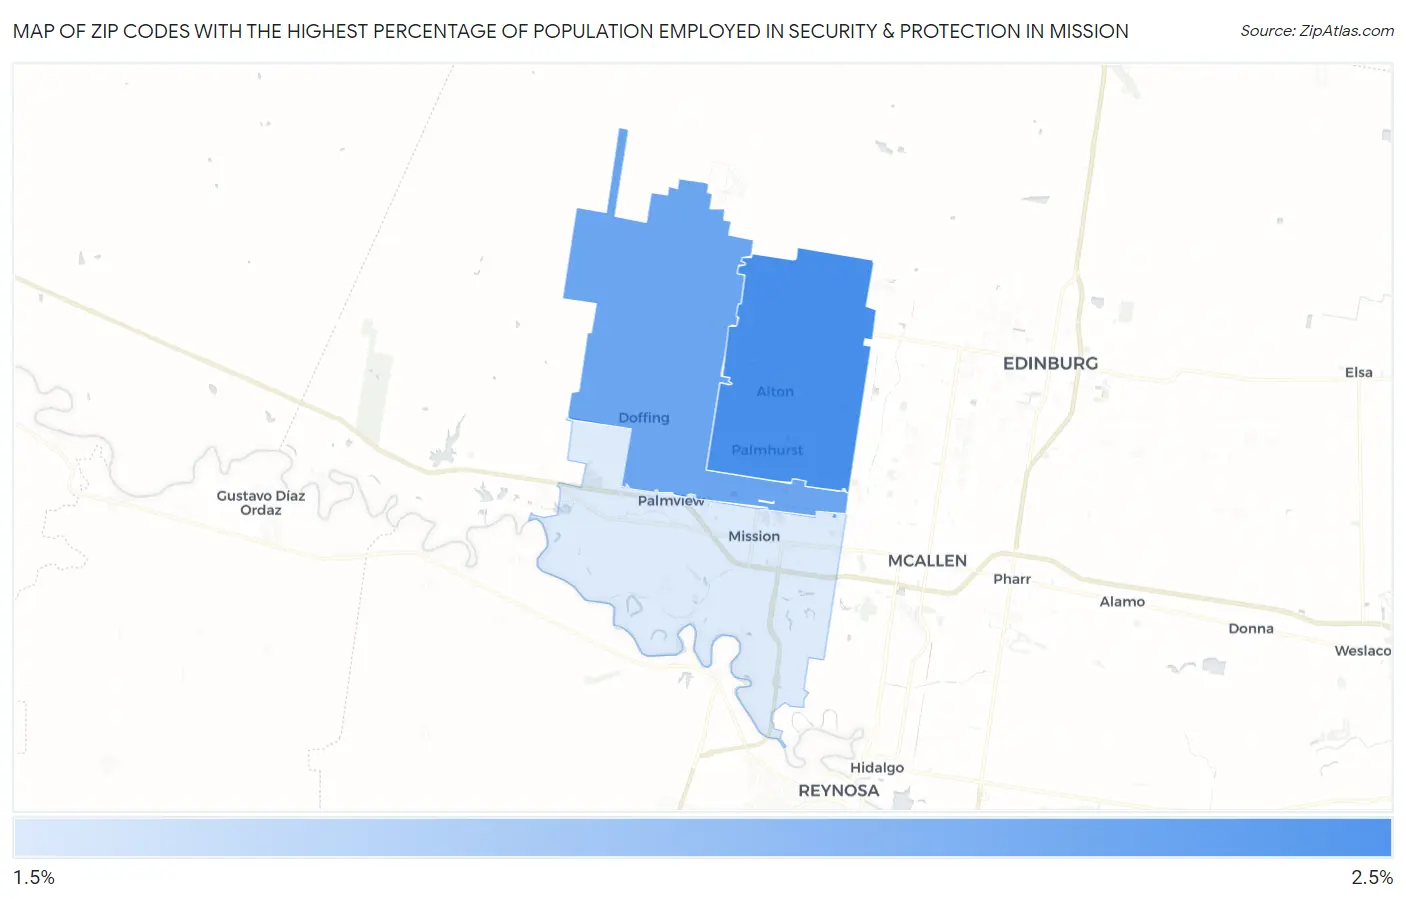
Map of Zip Codes with the Highest Percentage of Population Employed in Security & Protection in Mission
1.6%
2.3%
Zip Codes with the Highest Percentage of Population Employed in Security & Protection in Mission, TX
| Zip Code | % Employed | vs State | vs National | |
| 1. | 78573 | 2.3% | 2.2%(+0.046)#757 | 2.1%(+0.122)#10,836 |
| 2. | 78574 | 2.1% | 2.2%(-0.125)#815 | 2.1%(-0.050)#11,915 |
| 3. | 78572 | 1.6% | 2.2%(-0.653)#1,058 | 2.1%(-0.577)#15,630 |
1
Common Questions
What are the Top Zip Codes with the Highest Percentage of Population Employed in Security & Protection in Mission, TX?
Top Zip Codes with the Highest Percentage of Population Employed in Security & Protection in Mission, TX are:
What zip code has the Highest Percentage of Population Employed in Security & Protection in Mission, TX?
78573 has the Highest Percentage of Population Employed in Security & Protection in Mission, TX with 2.3%.
What is the Percentage of Population Employed in Security & Protection in Mission, TX?
Percentage of Population Employed in Security & Protection in Mission is 2.0%.
What is the Percentage of Population Employed in Security & Protection in Texas?
Percentage of Population Employed in Security & Protection in Texas is 2.2%.
What is the Percentage of Population Employed in Security & Protection in the United States?
Percentage of Population Employed in Security & Protection in the United States is 2.1%.