Zip Codes with the Highest Percentage of Population Employed in Security & Protection in Texas City, TX
RELATED REPORTS & OPTIONS
Security & Protection
Texas City
Compare Zip Codes
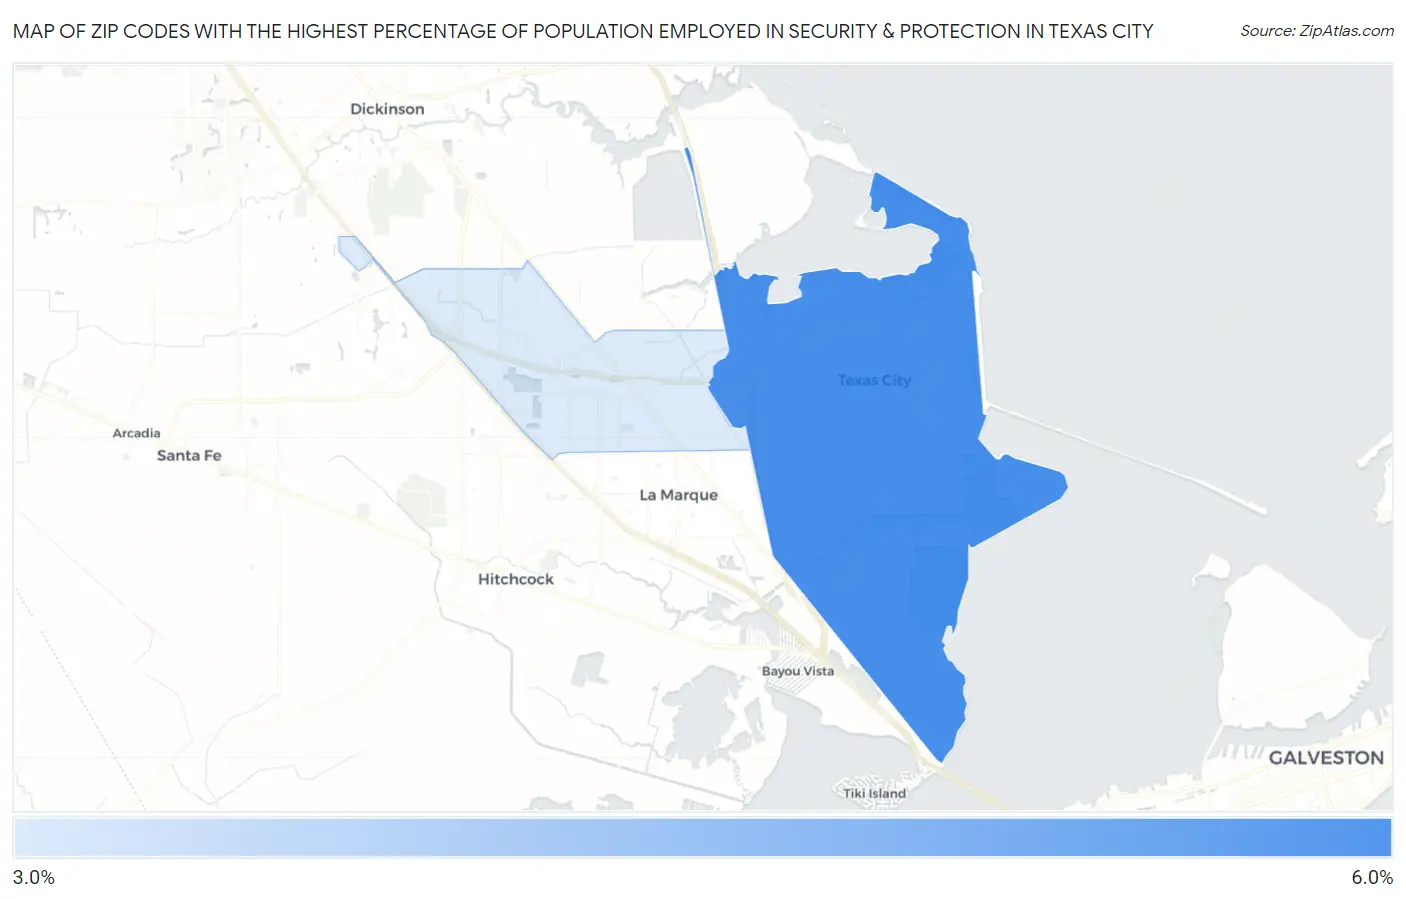
Map of Zip Codes with the Highest Percentage of Population Employed in Security & Protection in Texas City
3.8%
5.4%
Zip Codes with the Highest Percentage of Population Employed in Security & Protection in Texas City, TX
| Zip Code | % Employed | vs State | vs National | |
| 1. | 77590 | 5.4% | 2.2%(+3.19)#192 | 2.1%(+3.27)#2,526 |
| 2. | 77591 | 3.8% | 2.2%(+1.58)#357 | 2.1%(+1.66)#4,895 |
1
Common Questions
What are the Top Zip Codes with the Highest Percentage of Population Employed in Security & Protection in Texas City, TX?
Top Zip Codes with the Highest Percentage of Population Employed in Security & Protection in Texas City, TX are:
What zip code has the Highest Percentage of Population Employed in Security & Protection in Texas City, TX?
77590 has the Highest Percentage of Population Employed in Security & Protection in Texas City, TX with 5.4%.
What is the Percentage of Population Employed in Security & Protection in Texas City, TX?
Percentage of Population Employed in Security & Protection in Texas City is 4.5%.
What is the Percentage of Population Employed in Security & Protection in Texas?
Percentage of Population Employed in Security & Protection in Texas is 2.2%.
What is the Percentage of Population Employed in Security & Protection in the United States?
Percentage of Population Employed in Security & Protection in the United States is 2.1%.