Zip Codes with the Highest Percentage of Population Employed in Security & Protection in Odessa, TX
RELATED REPORTS & OPTIONS
Security & Protection
Odessa
Compare Zip Codes
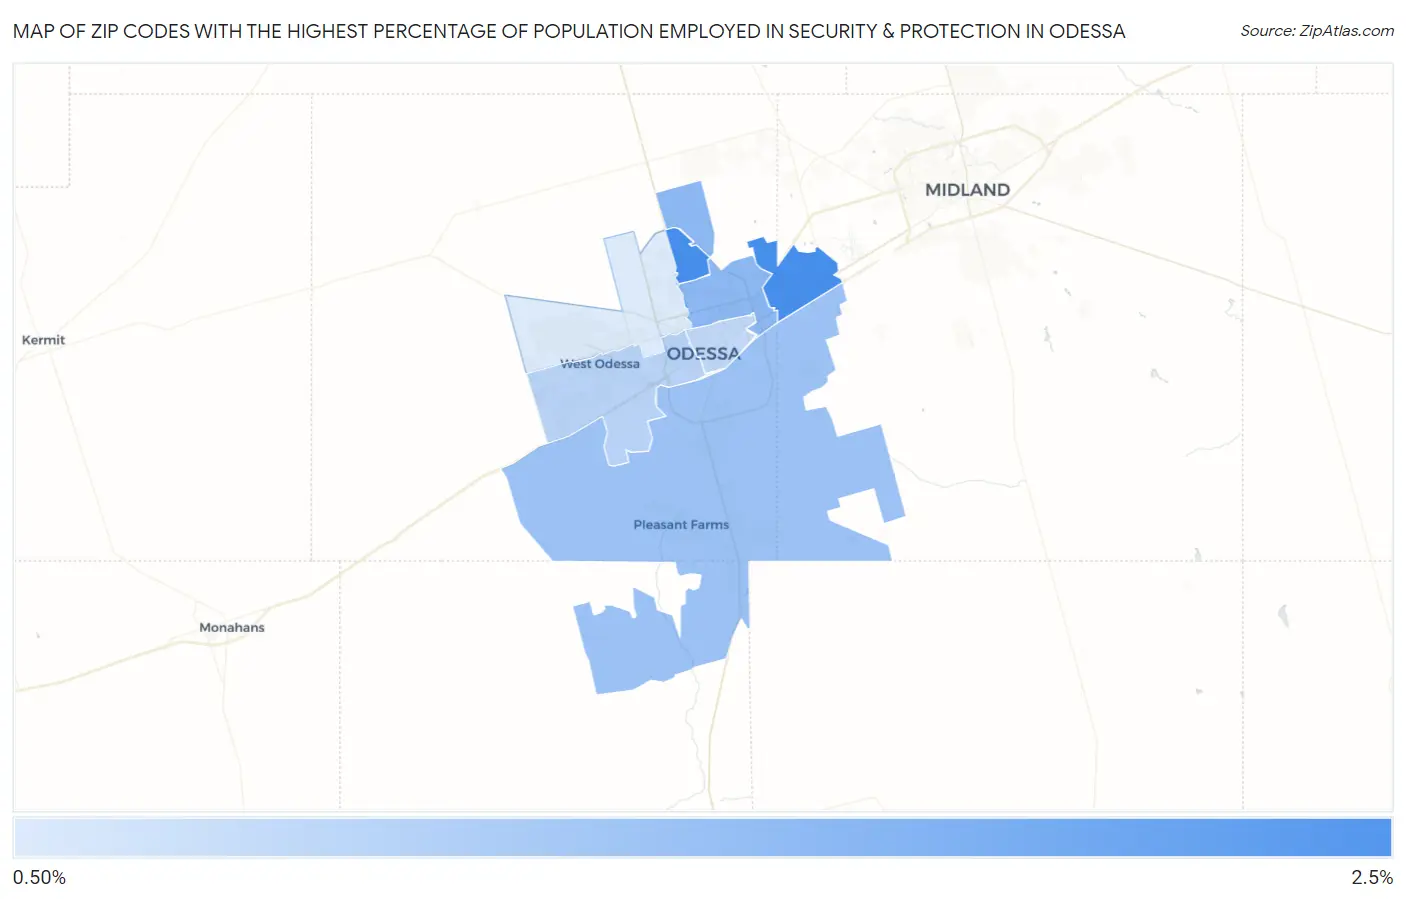
Map of Zip Codes with the Highest Percentage of Population Employed in Security & Protection in Odessa
0.71%
2.3%
Zip Codes with the Highest Percentage of Population Employed in Security & Protection in Odessa, TX
| Zip Code | % Employed | vs State | vs National | |
| 1. | 79765 | 2.3% | 2.2%(+0.089)#740 | 2.1%(+0.164)#10,565 |
| 2. | 79762 | 1.6% | 2.2%(-0.648)#1,055 | 2.1%(-0.573)#15,598 |
| 3. | 79766 | 1.4% | 2.2%(-0.833)#1,129 | 2.1%(-0.758)#17,021 |
| 4. | 79763 | 1.1% | 2.2%(-1.11)#1,236 | 2.1%(-1.04)#19,188 |
| 5. | 79761 | 1.0% | 2.2%(-1.22)#1,299 | 2.1%(-1.14)#19,997 |
| 6. | 79764 | 0.71% | 2.2%(-1.52)#1,407 | 2.1%(-1.44)#22,018 |
1
Common Questions
What are the Top 5 Zip Codes with the Highest Percentage of Population Employed in Security & Protection in Odessa, TX?
Top 5 Zip Codes with the Highest Percentage of Population Employed in Security & Protection in Odessa, TX are:
What zip code has the Highest Percentage of Population Employed in Security & Protection in Odessa, TX?
79765 has the Highest Percentage of Population Employed in Security & Protection in Odessa, TX with 2.3%.
What is the Percentage of Population Employed in Security & Protection in Odessa, TX?
Percentage of Population Employed in Security & Protection in Odessa is 1.3%.
What is the Percentage of Population Employed in Security & Protection in Texas?
Percentage of Population Employed in Security & Protection in Texas is 2.2%.
What is the Percentage of Population Employed in Security & Protection in the United States?
Percentage of Population Employed in Security & Protection in the United States is 2.1%.