Zip Codes with the Highest Percentage of Population Employed in Security & Protection in Tyler, TX
RELATED REPORTS & OPTIONS
Security & Protection
Tyler
Compare Zip Codes
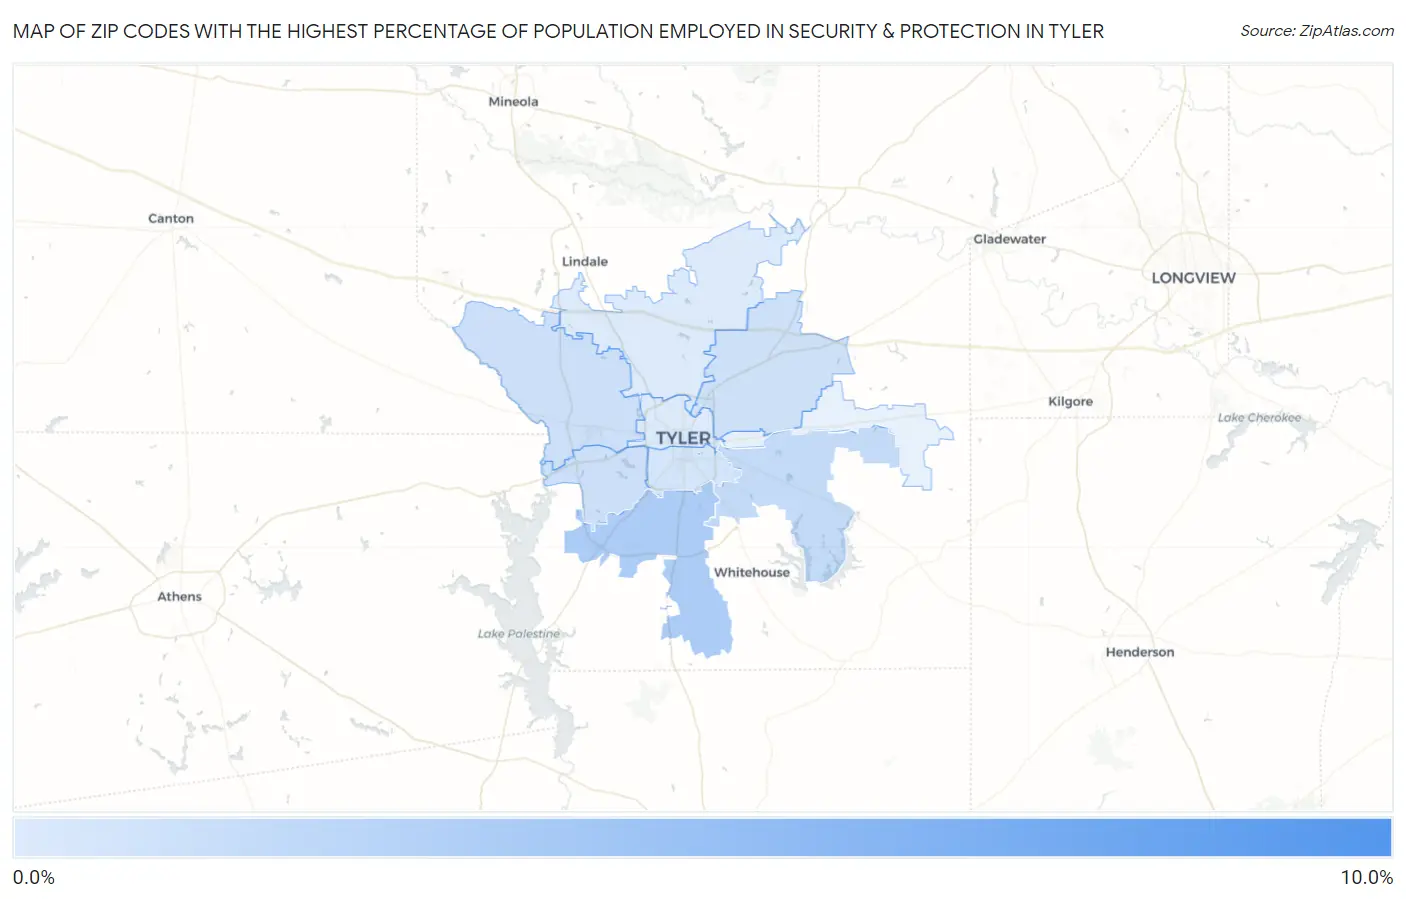
Map of Zip Codes with the Highest Percentage of Population Employed in Security & Protection in Tyler
0.66%
9.3%
Zip Codes with the Highest Percentage of Population Employed in Security & Protection in Tyler, TX
| Zip Code | % Employed | vs State | vs National | |
| 1. | 75711 | 9.3% | 2.2%(+7.04)#75 | 2.1%(+7.11)#870 |
| 2. | 75703 | 3.4% | 2.2%(+1.17)#441 | 2.1%(+1.24)#5,963 |
| 3. | 75707 | 2.1% | 2.2%(-0.106)#807 | 2.1%(-0.030)#11,776 |
| 4. | 75709 | 1.6% | 2.2%(-0.664)#1,063 | 2.1%(-0.588)#15,718 |
| 5. | 75704 | 1.5% | 2.2%(-0.714)#1,082 | 2.1%(-0.638)#16,113 |
| 6. | 75708 | 1.4% | 2.2%(-0.847)#1,140 | 2.1%(-0.771)#17,123 |
| 7. | 75701 | 1.2% | 2.2%(-1.01)#1,200 | 2.1%(-0.936)#18,411 |
| 8. | 75702 | 0.70% | 2.2%(-1.53)#1,417 | 2.1%(-1.45)#22,106 |
| 9. | 75706 | 0.66% | 2.2%(-1.56)#1,423 | 2.1%(-1.48)#22,311 |
1
Common Questions
What are the Top 5 Zip Codes with the Highest Percentage of Population Employed in Security & Protection in Tyler, TX?
Top 5 Zip Codes with the Highest Percentage of Population Employed in Security & Protection in Tyler, TX are:
What zip code has the Highest Percentage of Population Employed in Security & Protection in Tyler, TX?
75711 has the Highest Percentage of Population Employed in Security & Protection in Tyler, TX with 9.3%.
What is the Percentage of Population Employed in Security & Protection in Tyler, TX?
Percentage of Population Employed in Security & Protection in Tyler is 2.2%.
What is the Percentage of Population Employed in Security & Protection in Texas?
Percentage of Population Employed in Security & Protection in Texas is 2.2%.
What is the Percentage of Population Employed in Security & Protection in the United States?
Percentage of Population Employed in Security & Protection in the United States is 2.1%.