Zip Codes with the Highest Percentage of Population Employed in Security & Protection in New Braunfels, TX
RELATED REPORTS & OPTIONS
Security & Protection
New Braunfels
Compare Zip Codes
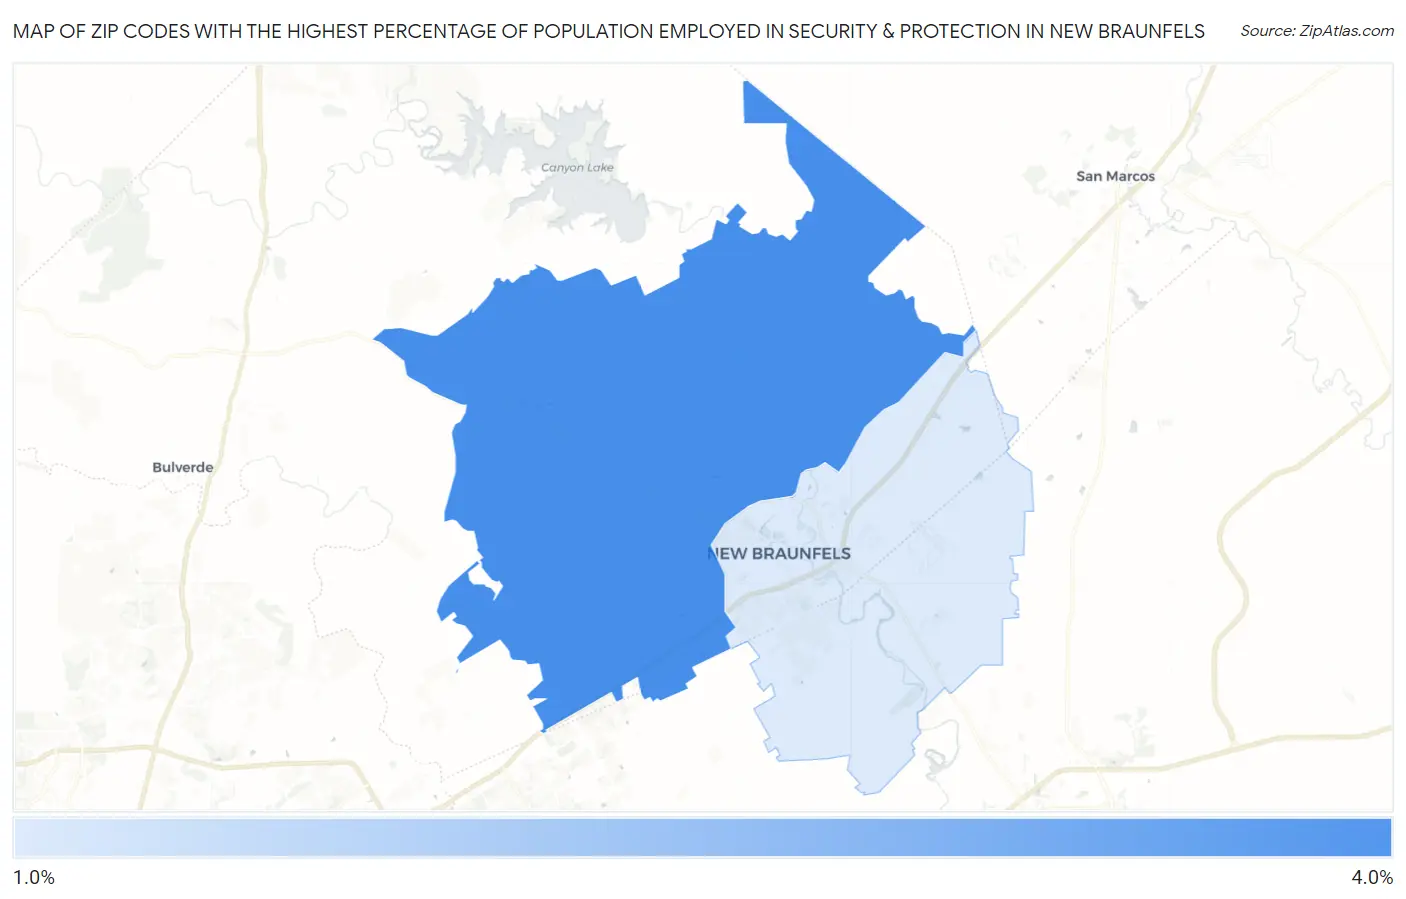
Map of Zip Codes with the Highest Percentage of Population Employed in Security & Protection in New Braunfels
1.9%
3.2%
Zip Codes with the Highest Percentage of Population Employed in Security & Protection in New Braunfels, TX
| Zip Code | % Employed | vs State | vs National | |
| 1. | 78132 | 3.2% | 2.2%(+0.947)#477 | 2.1%(+1.02)#6,626 |
| 2. | 78130 | 1.9% | 2.2%(-0.351)#922 | 2.1%(-0.276)#13,424 |
1
Common Questions
What are the Top Zip Codes with the Highest Percentage of Population Employed in Security & Protection in New Braunfels, TX?
Top Zip Codes with the Highest Percentage of Population Employed in Security & Protection in New Braunfels, TX are:
What zip code has the Highest Percentage of Population Employed in Security & Protection in New Braunfels, TX?
78132 has the Highest Percentage of Population Employed in Security & Protection in New Braunfels, TX with 3.2%.
What is the Percentage of Population Employed in Security & Protection in New Braunfels, TX?
Percentage of Population Employed in Security & Protection in New Braunfels is 1.8%.
What is the Percentage of Population Employed in Security & Protection in Texas?
Percentage of Population Employed in Security & Protection in Texas is 2.2%.
What is the Percentage of Population Employed in Security & Protection in the United States?
Percentage of Population Employed in Security & Protection in the United States is 2.1%.