Zip Codes with the Highest Percentage of Population Employed in Security & Protection in Paris, TX
RELATED REPORTS & OPTIONS
Security & Protection
Paris
Compare Zip Codes
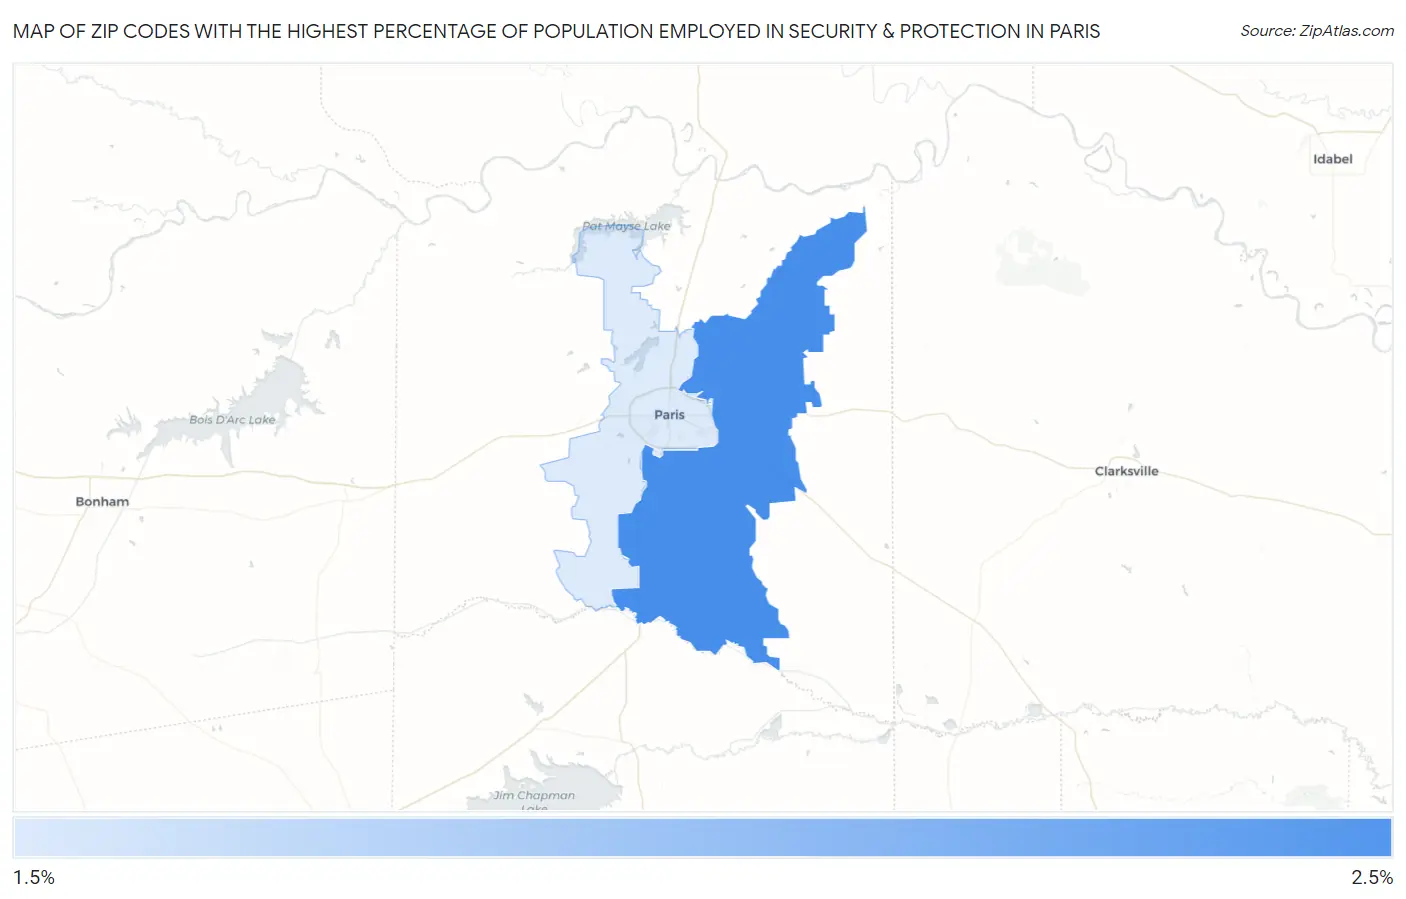
Map of Zip Codes with the Highest Percentage of Population Employed in Security & Protection in Paris
1.9%
2.3%
Zip Codes with the Highest Percentage of Population Employed in Security & Protection in Paris, TX
| Zip Code | % Employed | vs State | vs National | |
| 1. | 75462 | 2.3% | 2.2%(+0.042)#759 | 2.1%(+0.118)#10,847 |
| 2. | 75460 | 1.9% | 2.2%(-0.322)#904 | 2.1%(-0.247)#13,207 |
1
Common Questions
What are the Top Zip Codes with the Highest Percentage of Population Employed in Security & Protection in Paris, TX?
Top Zip Codes with the Highest Percentage of Population Employed in Security & Protection in Paris, TX are:
What zip code has the Highest Percentage of Population Employed in Security & Protection in Paris, TX?
75462 has the Highest Percentage of Population Employed in Security & Protection in Paris, TX with 2.3%.
What is the Percentage of Population Employed in Security & Protection in Paris, TX?
Percentage of Population Employed in Security & Protection in Paris is 2.0%.
What is the Percentage of Population Employed in Security & Protection in Texas?
Percentage of Population Employed in Security & Protection in Texas is 2.2%.
What is the Percentage of Population Employed in Security & Protection in the United States?
Percentage of Population Employed in Security & Protection in the United States is 2.1%.