Zip Codes with the Highest Percentage of Population Employed in Security & Protection in Tomball, TX
RELATED REPORTS & OPTIONS
Security & Protection
Tomball
Compare Zip Codes
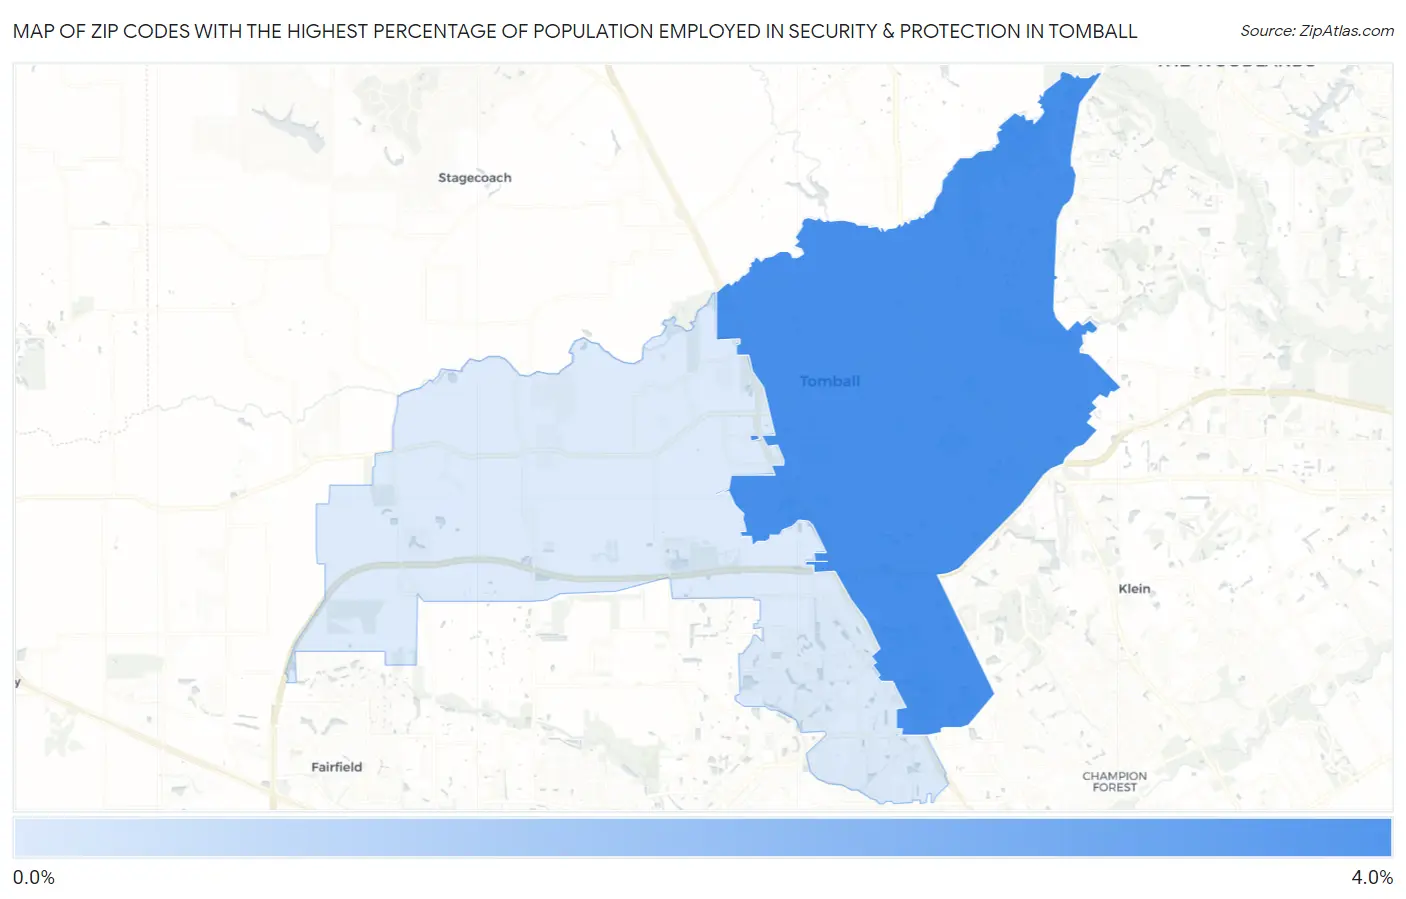
Map of Zip Codes with the Highest Percentage of Population Employed in Security & Protection in Tomball
0.71%
3.2%
Zip Codes with the Highest Percentage of Population Employed in Security & Protection in Tomball, TX
| Zip Code | % Employed | vs State | vs National | |
| 1. | 77375 | 3.2% | 2.2%(+0.949)#476 | 2.1%(+1.02)#6,622 |
| 2. | 77377 | 0.71% | 2.2%(-1.51)#1,403 | 2.1%(-1.43)#21,965 |
1
Common Questions
What are the Top Zip Codes with the Highest Percentage of Population Employed in Security & Protection in Tomball, TX?
Top Zip Codes with the Highest Percentage of Population Employed in Security & Protection in Tomball, TX are:
What zip code has the Highest Percentage of Population Employed in Security & Protection in Tomball, TX?
77375 has the Highest Percentage of Population Employed in Security & Protection in Tomball, TX with 3.2%.
What is the Percentage of Population Employed in Security & Protection in Tomball, TX?
Percentage of Population Employed in Security & Protection in Tomball is 2.5%.
What is the Percentage of Population Employed in Security & Protection in Texas?
Percentage of Population Employed in Security & Protection in Texas is 2.2%.
What is the Percentage of Population Employed in Security & Protection in the United States?
Percentage of Population Employed in Security & Protection in the United States is 2.1%.