Zip Codes with the Highest Percentage of Population Employed in Security & Protection in Baytown, TX
RELATED REPORTS & OPTIONS
Security & Protection
Baytown
Compare Zip Codes
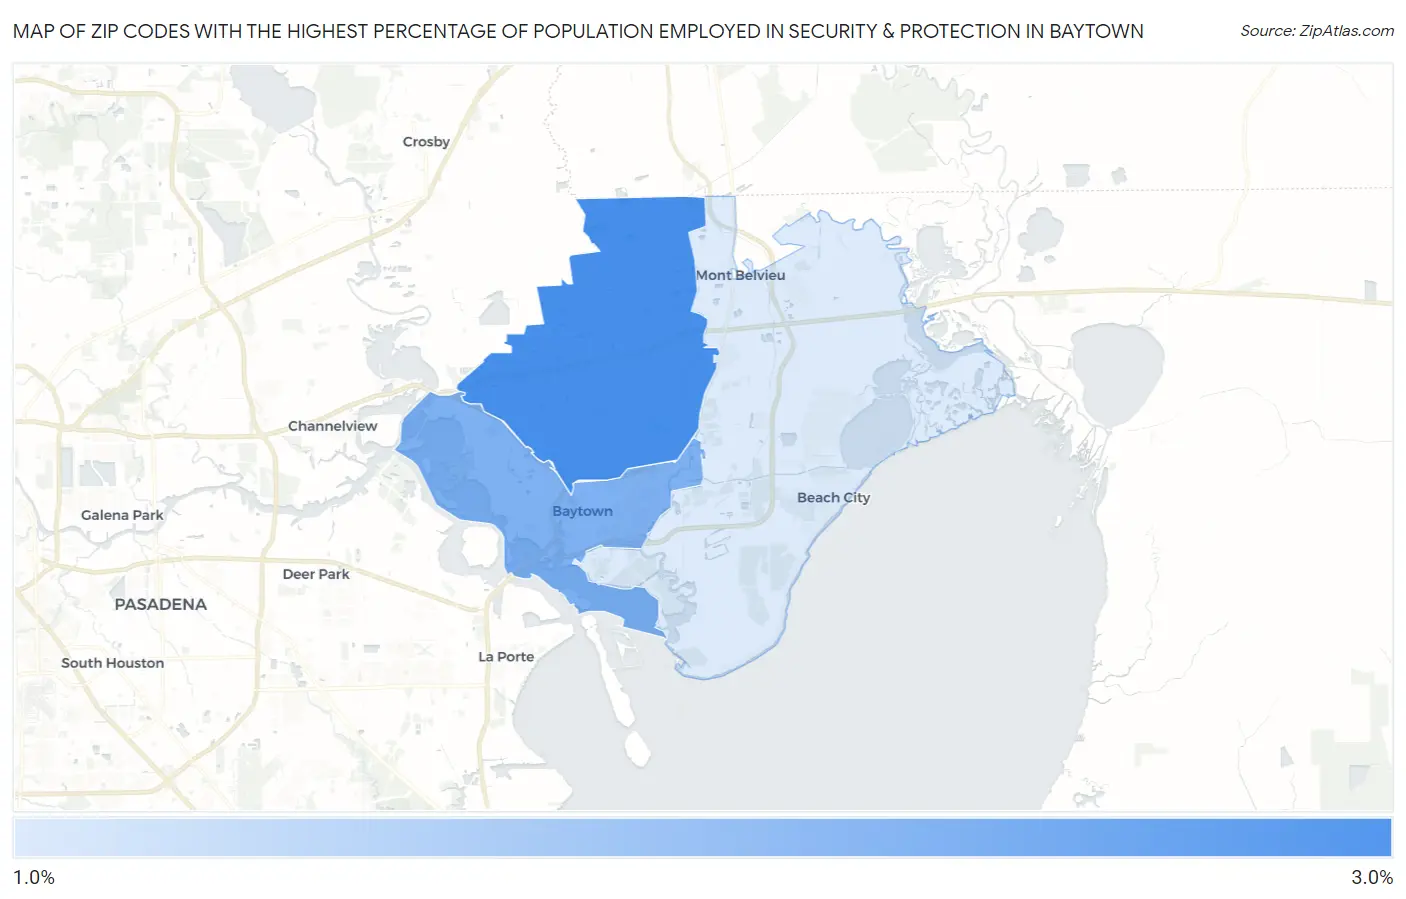
Map of Zip Codes with the Highest Percentage of Population Employed in Security & Protection in Baytown
1.0%
2.6%
Zip Codes with the Highest Percentage of Population Employed in Security & Protection in Baytown, TX
| Zip Code | % Employed | vs State | vs National | |
| 1. | 77521 | 2.6% | 2.2%(+0.415)#620 | 2.1%(+0.491)#8,828 |
| 2. | 77520 | 2.0% | 2.2%(-0.183)#843 | 2.1%(-0.108)#12,304 |
| 3. | 77523 | 1.0% | 2.2%(-1.20)#1,287 | 2.1%(-1.13)#19,870 |
1
Common Questions
What are the Top Zip Codes with the Highest Percentage of Population Employed in Security & Protection in Baytown, TX?
Top Zip Codes with the Highest Percentage of Population Employed in Security & Protection in Baytown, TX are:
What zip code has the Highest Percentage of Population Employed in Security & Protection in Baytown, TX?
77521 has the Highest Percentage of Population Employed in Security & Protection in Baytown, TX with 2.6%.
What is the Percentage of Population Employed in Security & Protection in Baytown, TX?
Percentage of Population Employed in Security & Protection in Baytown is 2.3%.
What is the Percentage of Population Employed in Security & Protection in Texas?
Percentage of Population Employed in Security & Protection in Texas is 2.2%.
What is the Percentage of Population Employed in Security & Protection in the United States?
Percentage of Population Employed in Security & Protection in the United States is 2.1%.