Zip Codes with the Highest Percentage of Population Employed in Security & Protection in Waco, TX
RELATED REPORTS & OPTIONS
Security & Protection
Waco
Compare Zip Codes
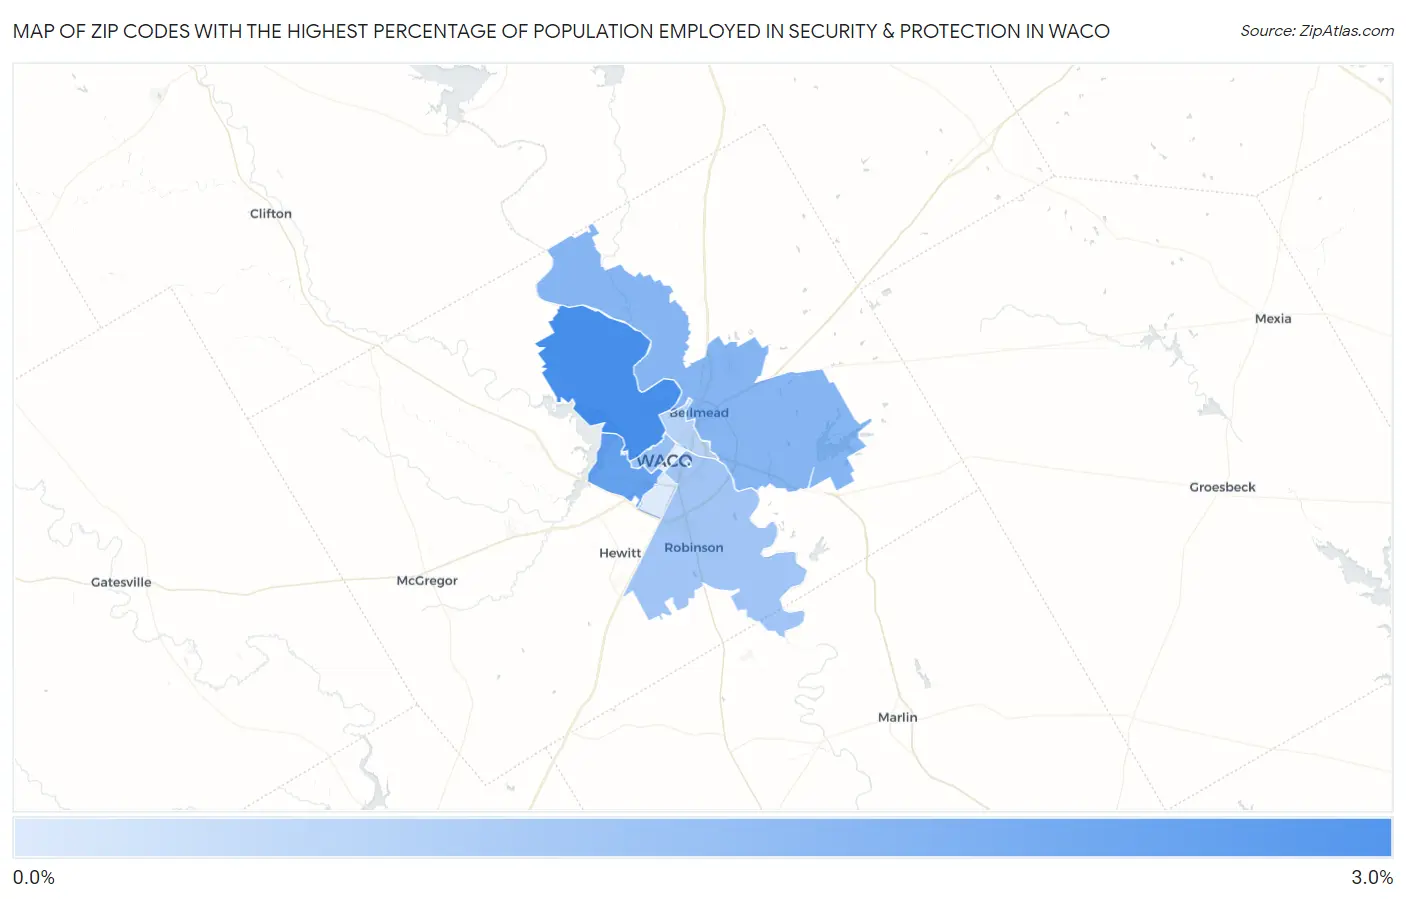
Map of Zip Codes with the Highest Percentage of Population Employed in Security & Protection in Waco
0.041%
2.7%
Zip Codes with the Highest Percentage of Population Employed in Security & Protection in Waco, TX
| Zip Code | % Employed | vs State | vs National | |
| 1. | 76708 | 2.7% | 2.2%(+0.465)#609 | 2.1%(+0.541)#8,589 |
| 2. | 76710 | 2.1% | 2.2%(-0.090)#799 | 2.1%(-0.014)#11,662 |
| 3. | 76705 | 1.6% | 2.2%(-0.643)#1,051 | 2.1%(-0.568)#15,561 |
| 4. | 76707 | 1.3% | 2.2%(-0.970)#1,182 | 2.1%(-0.895)#18,110 |
| 5. | 76706 | 1.1% | 2.2%(-1.15)#1,259 | 2.1%(-1.07)#19,475 |
| 6. | 76798 | 1.0% | 2.2%(-1.20)#1,284 | 2.1%(-1.12)#19,826 |
| 7. | 76704 | 0.73% | 2.2%(-1.50)#1,398 | 2.1%(-1.42)#21,890 |
| 8. | 76711 | 0.041% | 2.2%(-2.18)#1,534 | 2.1%(-2.11)#24,764 |
1
Common Questions
What are the Top 5 Zip Codes with the Highest Percentage of Population Employed in Security & Protection in Waco, TX?
Top 5 Zip Codes with the Highest Percentage of Population Employed in Security & Protection in Waco, TX are:
What zip code has the Highest Percentage of Population Employed in Security & Protection in Waco, TX?
76708 has the Highest Percentage of Population Employed in Security & Protection in Waco, TX with 2.7%.
What is the Percentage of Population Employed in Security & Protection in Waco, TX?
Percentage of Population Employed in Security & Protection in Waco is 1.9%.
What is the Percentage of Population Employed in Security & Protection in Texas?
Percentage of Population Employed in Security & Protection in Texas is 2.2%.
What is the Percentage of Population Employed in Security & Protection in the United States?
Percentage of Population Employed in Security & Protection in the United States is 2.1%.