Zip Codes with the Highest Percentage of Population with a Degree in Visual and Performing Arts in Bedford, TX
RELATED REPORTS & OPTIONS
Visual and Performing Arts
Bedford
Compare Zip Codes
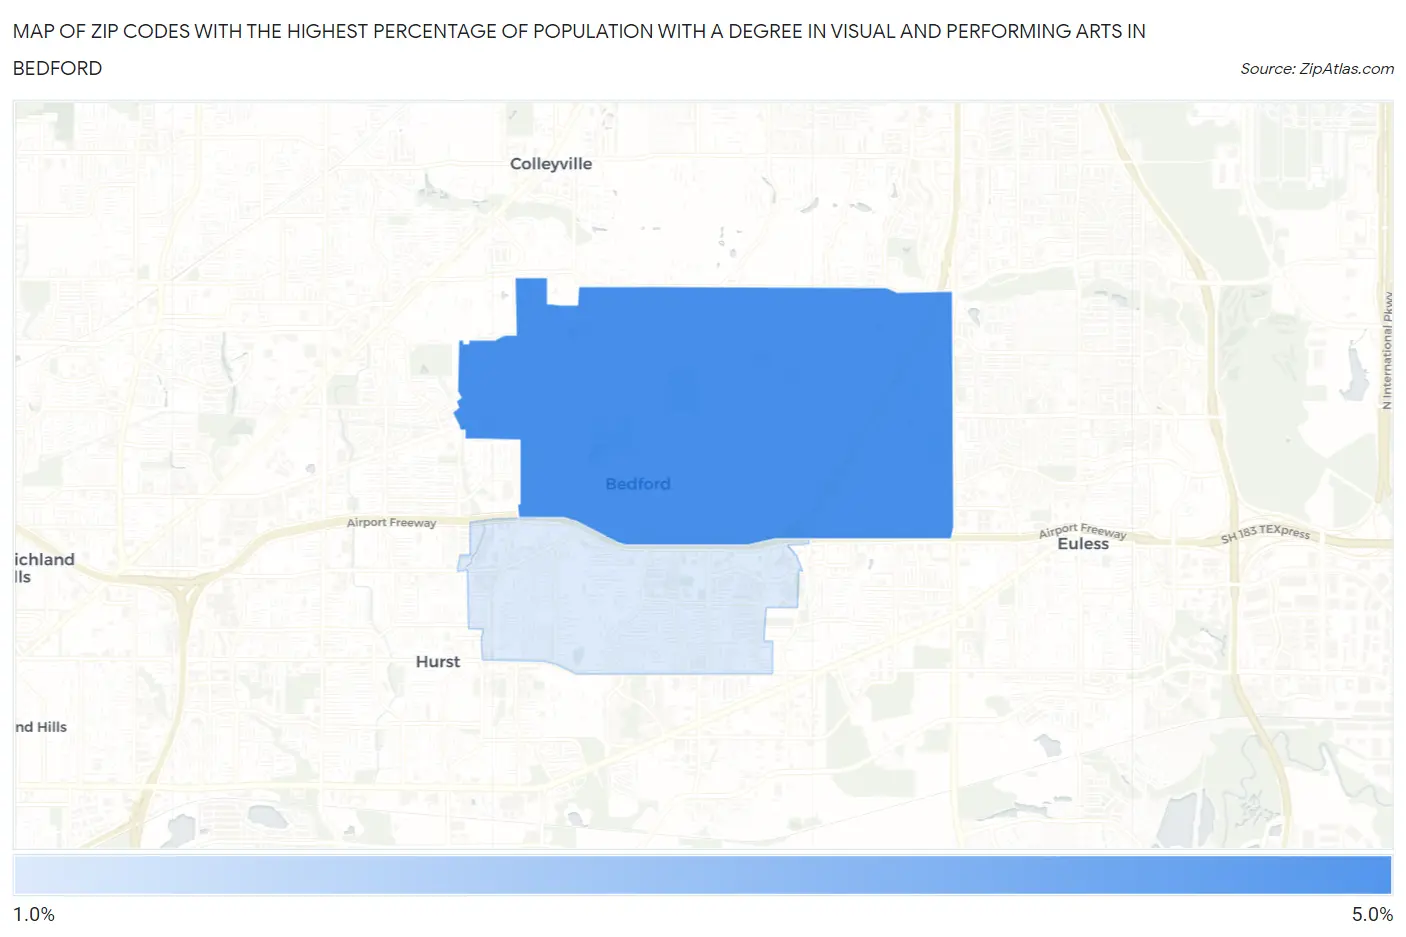
Map of Zip Codes with the Highest Percentage of Population with a Degree in Visual and Performing Arts in Bedford
1.0%
4.0%
Zip Codes with the Highest Percentage of Population with a Degree in Visual and Performing Arts in Bedford, TX
| Zip Code | % Graduates | vs State | vs National | |
| 1. | 76021 | 4.0% | 3.2%(+0.810)#415 | 4.3%(-0.233)#9,198 |
| 2. | 76022 | 1.0% | 3.2%(-2.19)#1,096 | 4.3%(-3.23)#19,608 |
1
Common Questions
What are the Top Zip Codes with the Highest Percentage of Population with a Degree in Visual and Performing Arts in Bedford, TX?
Top Zip Codes with the Highest Percentage of Population with a Degree in Visual and Performing Arts in Bedford, TX are:
What zip code has the Highest Percentage of Population with a Degree in Visual and Performing Arts in Bedford, TX?
76021 has the Highest Percentage of Population with a Degree in Visual and Performing Arts in Bedford, TX with 4.0%.
What is the Percentage of Population with a Degree in Visual and Performing Arts in Bedford, TX?
Percentage of Population with a Degree in Visual and Performing Arts in Bedford is 3.4%.
What is the Percentage of Population with a Degree in Visual and Performing Arts in Texas?
Percentage of Population with a Degree in Visual and Performing Arts in Texas is 3.2%.
What is the Percentage of Population with a Degree in Visual and Performing Arts in the United States?
Percentage of Population with a Degree in Visual and Performing Arts in the United States is 4.3%.