Zip Codes with the Highest Percentage of Population Employed in Installation, Maintenance & Repair in Bedford, TX
RELATED REPORTS & OPTIONS
Installation, Maintenance & Repair
Bedford
Compare Zip Codes
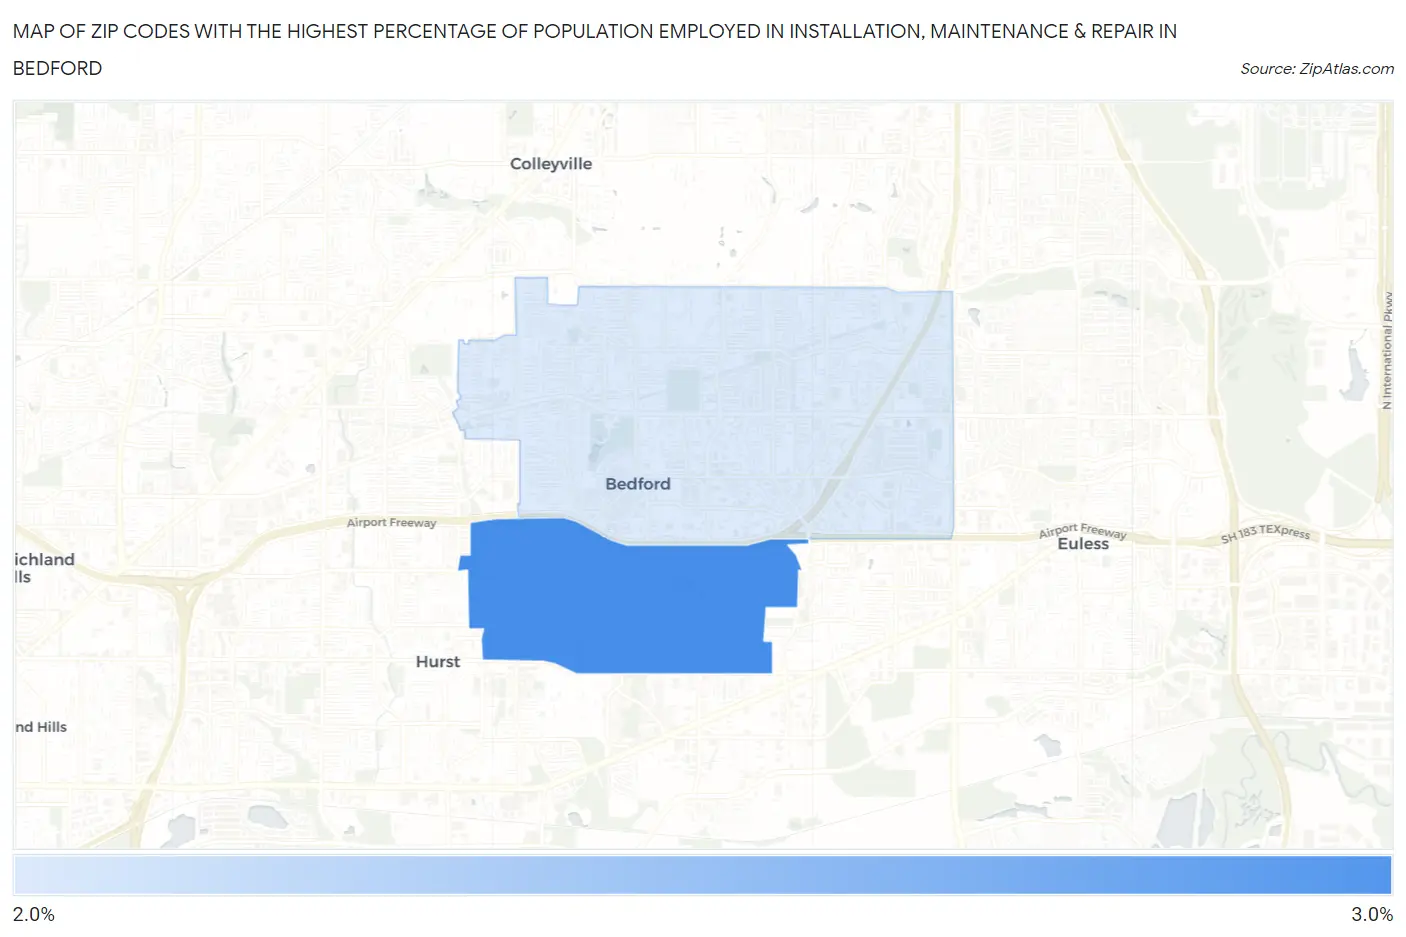
Map of Zip Codes with the Highest Percentage of Population Employed in Installation, Maintenance & Repair in Bedford
2.3%
2.9%
Zip Codes with the Highest Percentage of Population Employed in Installation, Maintenance & Repair in Bedford, TX
| Zip Code | % Employed | vs State | vs National | |
| 1. | 76022 | 2.9% | 3.4%(-0.467)#1,079 | 3.1%(-0.131)#17,315 |
| 2. | 76021 | 2.3% | 3.4%(-1.15)#1,269 | 3.1%(-0.816)#20,820 |
1
Common Questions
What are the Top Zip Codes with the Highest Percentage of Population Employed in Installation, Maintenance & Repair in Bedford, TX?
Top Zip Codes with the Highest Percentage of Population Employed in Installation, Maintenance & Repair in Bedford, TX are:
What zip code has the Highest Percentage of Population Employed in Installation, Maintenance & Repair in Bedford, TX?
76022 has the Highest Percentage of Population Employed in Installation, Maintenance & Repair in Bedford, TX with 2.9%.
What is the Percentage of Population Employed in Installation, Maintenance & Repair in Bedford, TX?
Percentage of Population Employed in Installation, Maintenance & Repair in Bedford is 2.4%.
What is the Percentage of Population Employed in Installation, Maintenance & Repair in Texas?
Percentage of Population Employed in Installation, Maintenance & Repair in Texas is 3.4%.
What is the Percentage of Population Employed in Installation, Maintenance & Repair in the United States?
Percentage of Population Employed in Installation, Maintenance & Repair in the United States is 3.1%.