Zip Codes with the Highest Percentage of Households Without a Vehicle in Kingsport, TN
RELATED REPORTS & OPTIONS
Households without a Cars
Kingsport
Compare Zip Codes
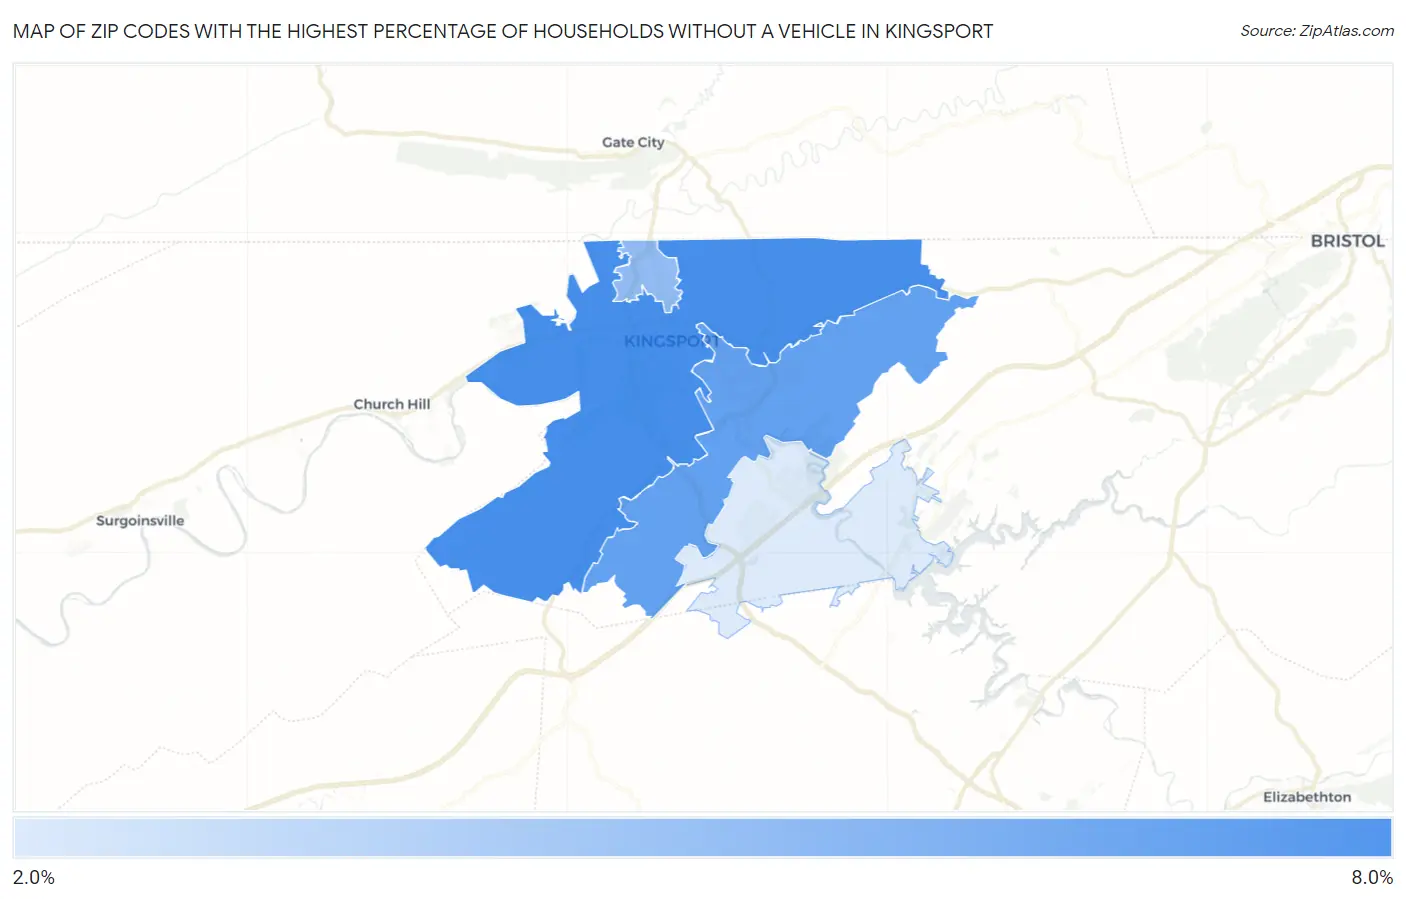
Map of Zip Codes with the Highest Percentage of Households Without a Vehicle in Kingsport
2.1%
7.7%
Zip Codes with the Highest Percentage of Households Without a Vehicle in Kingsport, TN
| Zip Code | Housholds Without a Car | vs State | vs National | |
| 1. | 37660 | 7.7% | 5.3%(+2.40)#118 | 8.3%(-0.600)#7,361 |
| 2. | 37664 | 6.6% | 5.3%(+1.30)#157 | 8.3%(-1.70)#9,203 |
| 3. | 37665 | 4.9% | 5.3%(-0.400)#241 | 8.3%(-3.40)#13,182 |
| 4. | 37663 | 2.1% | 5.3%(-3.20)#439 | 8.3%(-6.20)#22,120 |
1
Common Questions
What are the Top 3 Zip Codes with the Highest Percentage of Households Without a Vehicle in Kingsport, TN?
Top 3 Zip Codes with the Highest Percentage of Households Without a Vehicle in Kingsport, TN are:
What zip code has the Highest Percentage of Households Without a Vehicle in Kingsport, TN?
37660 has the Highest Percentage of Households Without a Vehicle in Kingsport, TN with 7.7%.
What is the Percentage of Households Without a Vehicle in Kingsport, TN?
Percentage of Households Without a Vehicle in Kingsport is 7.6%.
What is the Percentage of Households Without a Vehicle in Tennessee?
Percentage of Households Without a Vehicle in Tennessee is 5.3%.
What is the Percentage of Households Without a Vehicle in the United States?
Percentage of Households Without a Vehicle in the United States is 8.3%.