Zip Codes with the Highest Percentage of Population Employed in Health Diagnosing & Treating in Kingsport, TN
RELATED REPORTS & OPTIONS
Health Diagnosing & Treating
Kingsport
Compare Zip Codes
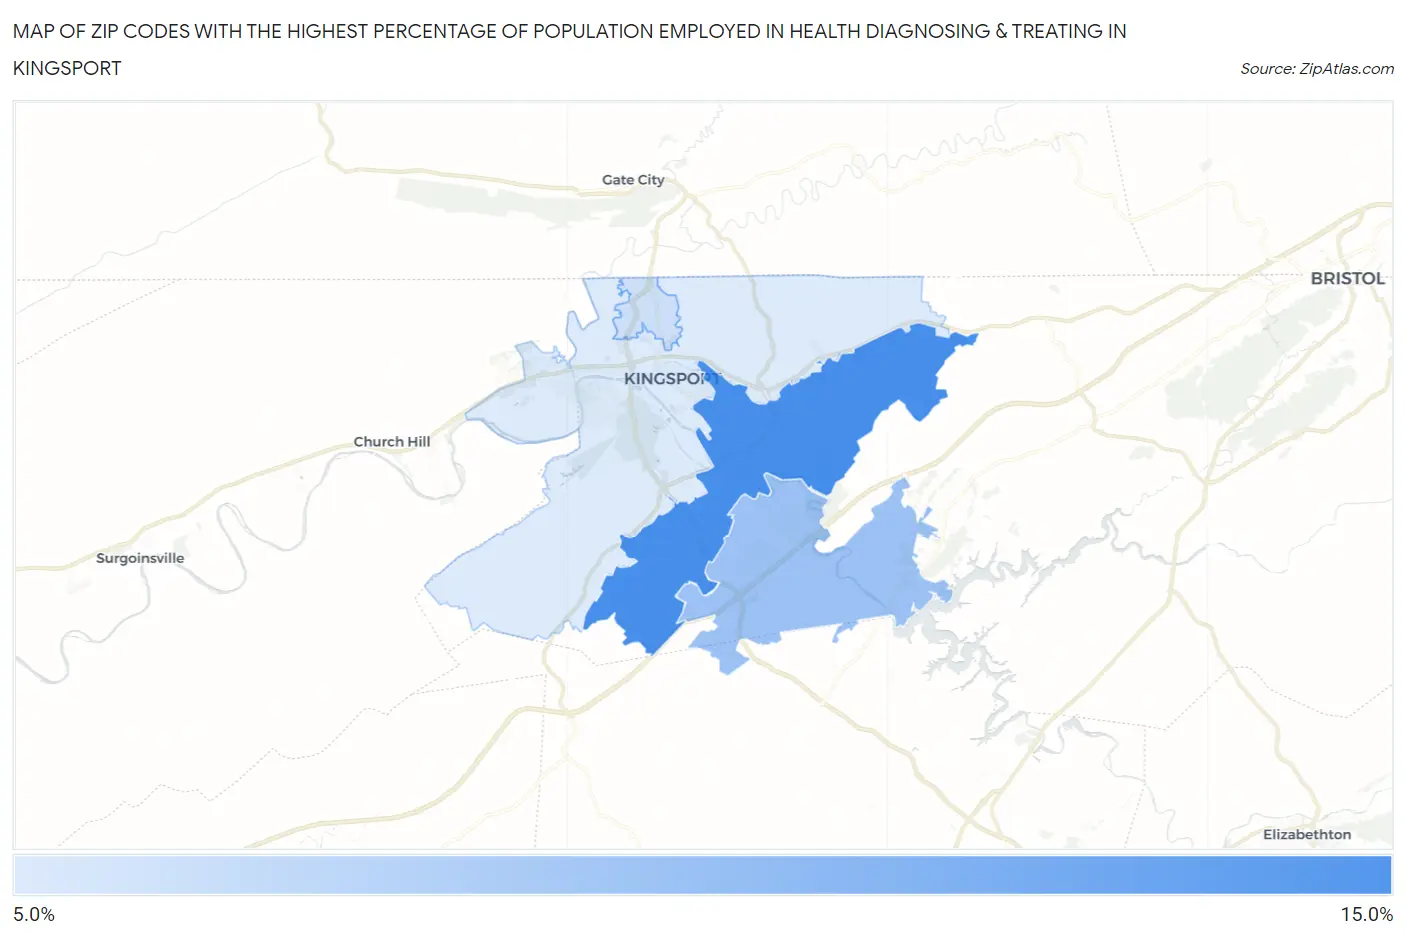
Map of Zip Codes with the Highest Percentage of Population Employed in Health Diagnosing & Treating in Kingsport
7.4%
10.6%
Zip Codes with the Highest Percentage of Population Employed in Health Diagnosing & Treating in Kingsport, TN
| Zip Code | % Employed | vs State | vs National | |
| 1. | 37664 | 10.6% | 6.9%(+3.73)#65 | 6.2%(+4.35)#3,230 |
| 2. | 37663 | 8.8% | 6.9%(+1.97)#136 | 6.2%(+2.59)#5,662 |
| 3. | 37665 | 7.8% | 6.9%(+0.922)#194 | 6.2%(+1.54)#8,039 |
| 4. | 37660 | 7.4% | 6.9%(+0.575)#222 | 6.2%(+1.19)#9,008 |
1
Common Questions
What are the Top 3 Zip Codes with the Highest Percentage of Population Employed in Health Diagnosing & Treating in Kingsport, TN?
Top 3 Zip Codes with the Highest Percentage of Population Employed in Health Diagnosing & Treating in Kingsport, TN are:
What zip code has the Highest Percentage of Population Employed in Health Diagnosing & Treating in Kingsport, TN?
37664 has the Highest Percentage of Population Employed in Health Diagnosing & Treating in Kingsport, TN with 10.6%.
What is the Percentage of Population Employed in Health Diagnosing & Treating in Kingsport, TN?
Percentage of Population Employed in Health Diagnosing & Treating in Kingsport is 7.7%.
What is the Percentage of Population Employed in Health Diagnosing & Treating in Tennessee?
Percentage of Population Employed in Health Diagnosing & Treating in Tennessee is 6.9%.
What is the Percentage of Population Employed in Health Diagnosing & Treating in the United States?
Percentage of Population Employed in Health Diagnosing & Treating in the United States is 6.2%.