Zip Codes with the Highest Percentage of Population Employed in Food Preparation & Serving in Kingsport, TN
RELATED REPORTS & OPTIONS
Food Preparation & Serving
Kingsport
Compare Zip Codes
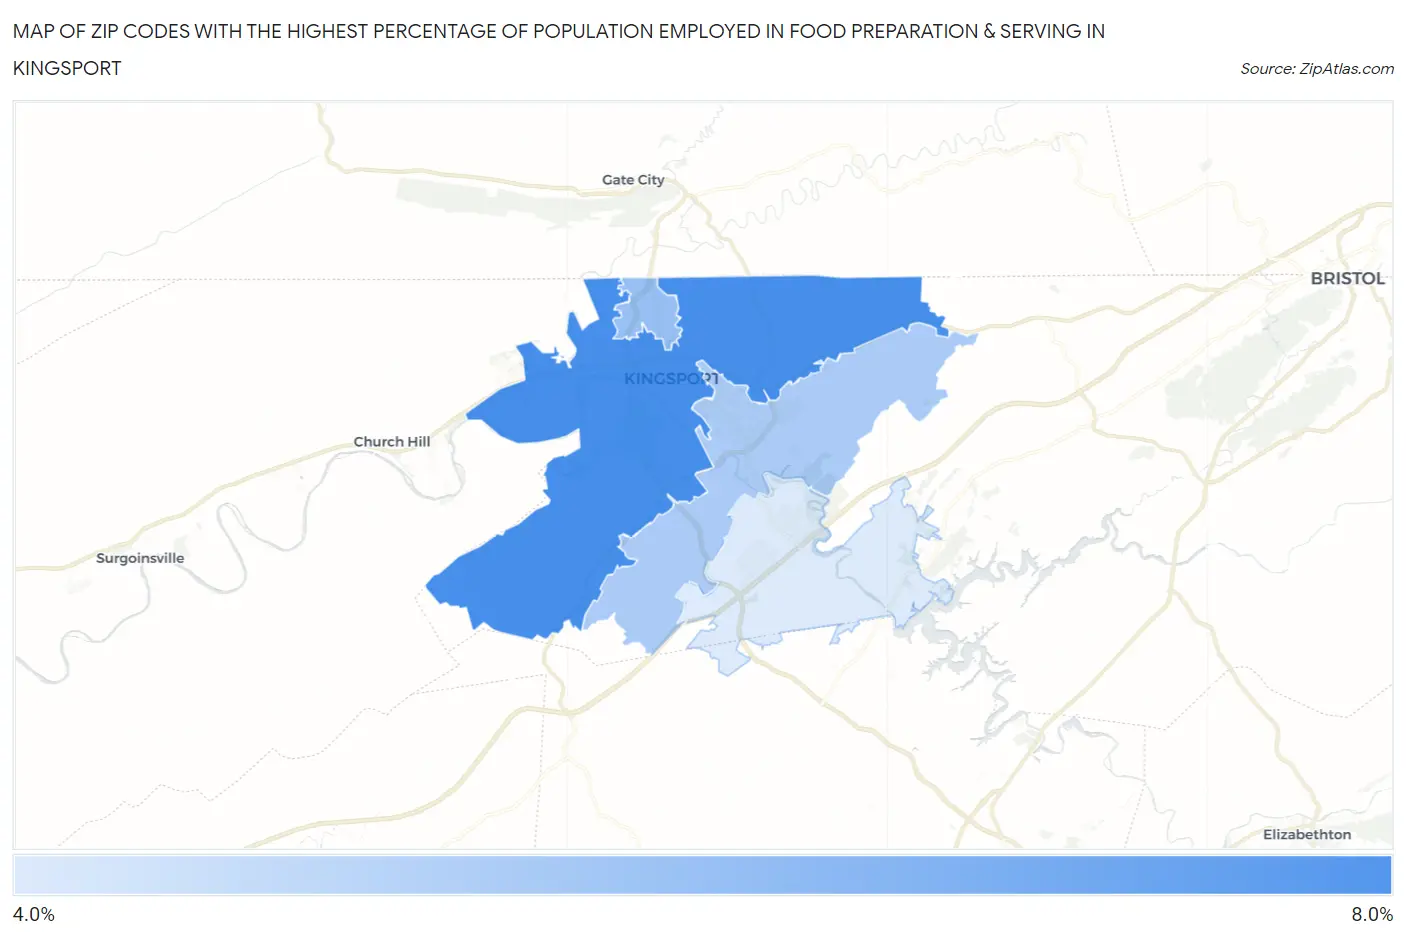
Map of Zip Codes with the Highest Percentage of Population Employed in Food Preparation & Serving in Kingsport
4.5%
7.6%
Zip Codes with the Highest Percentage of Population Employed in Food Preparation & Serving in Kingsport, TN
| Zip Code | % Employed | vs State | vs National | |
| 1. | 37660 | 7.6% | 5.4%(+2.22)#117 | 5.3%(+2.35)#5,324 |
| 2. | 37665 | 5.9% | 5.4%(+0.498)#195 | 5.3%(+0.631)#9,612 |
| 3. | 37664 | 5.6% | 5.4%(+0.133)#221 | 5.3%(+0.265)#10,887 |
| 4. | 37663 | 4.5% | 5.4%(-0.911)#300 | 5.3%(-0.778)#14,997 |
1
Common Questions
What are the Top 3 Zip Codes with the Highest Percentage of Population Employed in Food Preparation & Serving in Kingsport, TN?
Top 3 Zip Codes with the Highest Percentage of Population Employed in Food Preparation & Serving in Kingsport, TN are:
What zip code has the Highest Percentage of Population Employed in Food Preparation & Serving in Kingsport, TN?
37660 has the Highest Percentage of Population Employed in Food Preparation & Serving in Kingsport, TN with 7.6%.
What is the Percentage of Population Employed in Food Preparation & Serving in Kingsport, TN?
Percentage of Population Employed in Food Preparation & Serving in Kingsport is 7.1%.
What is the Percentage of Population Employed in Food Preparation & Serving in Tennessee?
Percentage of Population Employed in Food Preparation & Serving in Tennessee is 5.4%.
What is the Percentage of Population Employed in Food Preparation & Serving in the United States?
Percentage of Population Employed in Food Preparation & Serving in the United States is 5.3%.