Zip Codes with the Highest Percentage of Population with a Degree in Visual and Performing Arts in Kingsport, TN
RELATED REPORTS & OPTIONS
Visual and Performing Arts
Kingsport
Compare Zip Codes
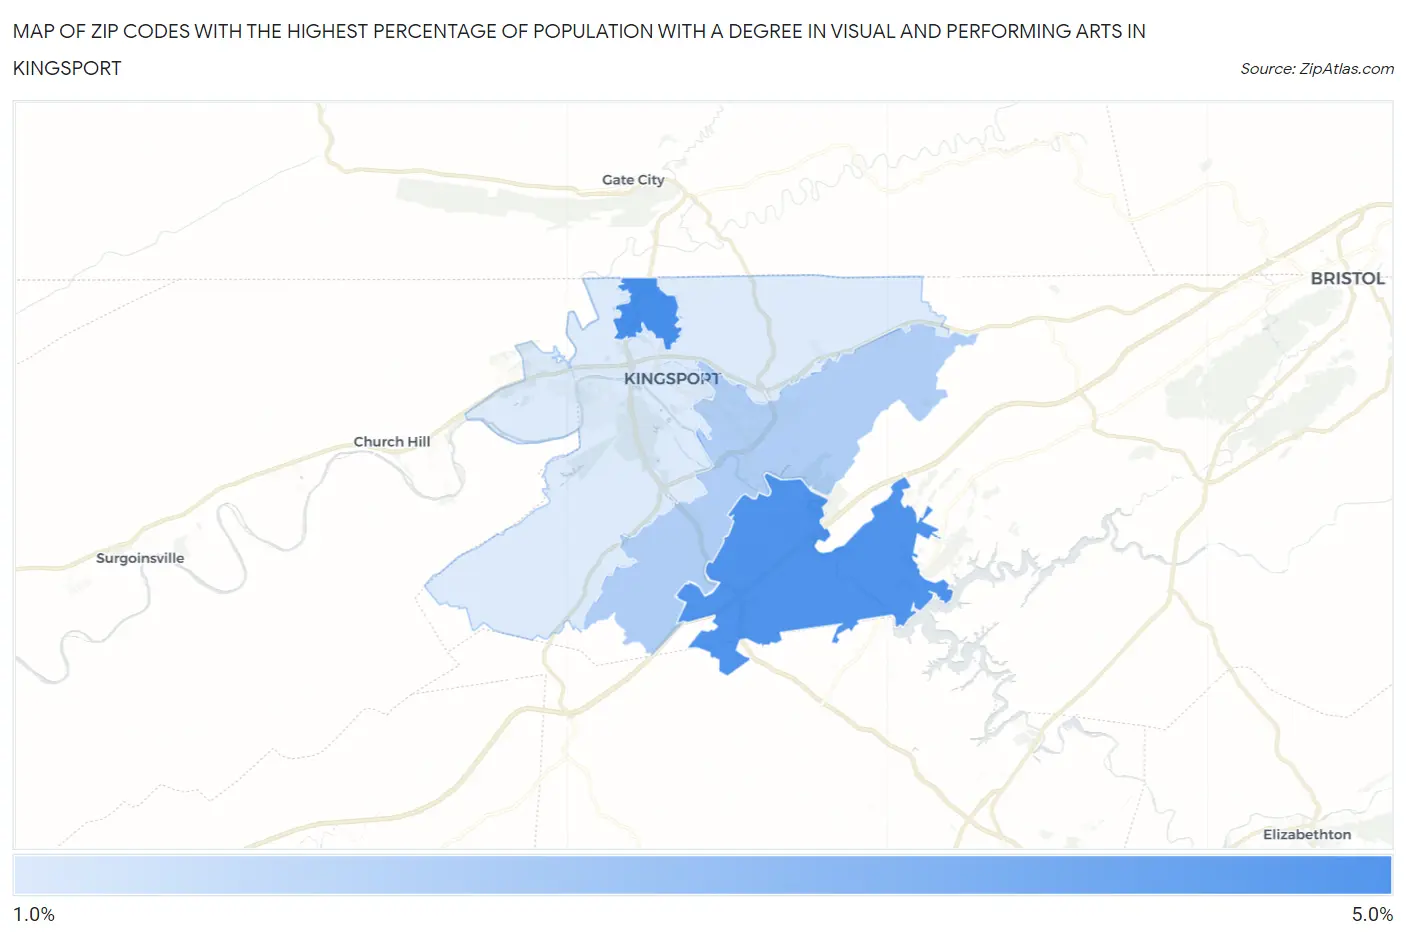
Map of Zip Codes with the Highest Percentage of Population with a Degree in Visual and Performing Arts in Kingsport
1.9%
4.7%
Zip Codes with the Highest Percentage of Population with a Degree in Visual and Performing Arts in Kingsport, TN
| Zip Code | % Graduates | vs State | vs National | |
| 1. | 37665 | 4.7% | 4.1%(+0.681)#151 | 4.3%(+0.494)#7,198 |
| 2. | 37663 | 4.6% | 4.1%(+0.563)#157 | 4.3%(+0.376)#7,482 |
| 3. | 37664 | 2.8% | 4.1%(-1.29)#243 | 4.3%(-1.48)#13,591 |
| 4. | 37660 | 1.9% | 4.1%(-2.15)#304 | 4.3%(-2.34)#16,736 |
1
Common Questions
What are the Top 3 Zip Codes with the Highest Percentage of Population with a Degree in Visual and Performing Arts in Kingsport, TN?
Top 3 Zip Codes with the Highest Percentage of Population with a Degree in Visual and Performing Arts in Kingsport, TN are:
What zip code has the Highest Percentage of Population with a Degree in Visual and Performing Arts in Kingsport, TN?
37665 has the Highest Percentage of Population with a Degree in Visual and Performing Arts in Kingsport, TN with 4.7%.
What is the Percentage of Population with a Degree in Visual and Performing Arts in Kingsport, TN?
Percentage of Population with a Degree in Visual and Performing Arts in Kingsport is 2.4%.
What is the Percentage of Population with a Degree in Visual and Performing Arts in Tennessee?
Percentage of Population with a Degree in Visual and Performing Arts in Tennessee is 4.1%.
What is the Percentage of Population with a Degree in Visual and Performing Arts in the United States?
Percentage of Population with a Degree in Visual and Performing Arts in the United States is 4.3%.