Zip Codes with the Highest Percentage of Population Employed in Security & Protection in Kingsport, TN
RELATED REPORTS & OPTIONS
Security & Protection
Kingsport
Compare Zip Codes
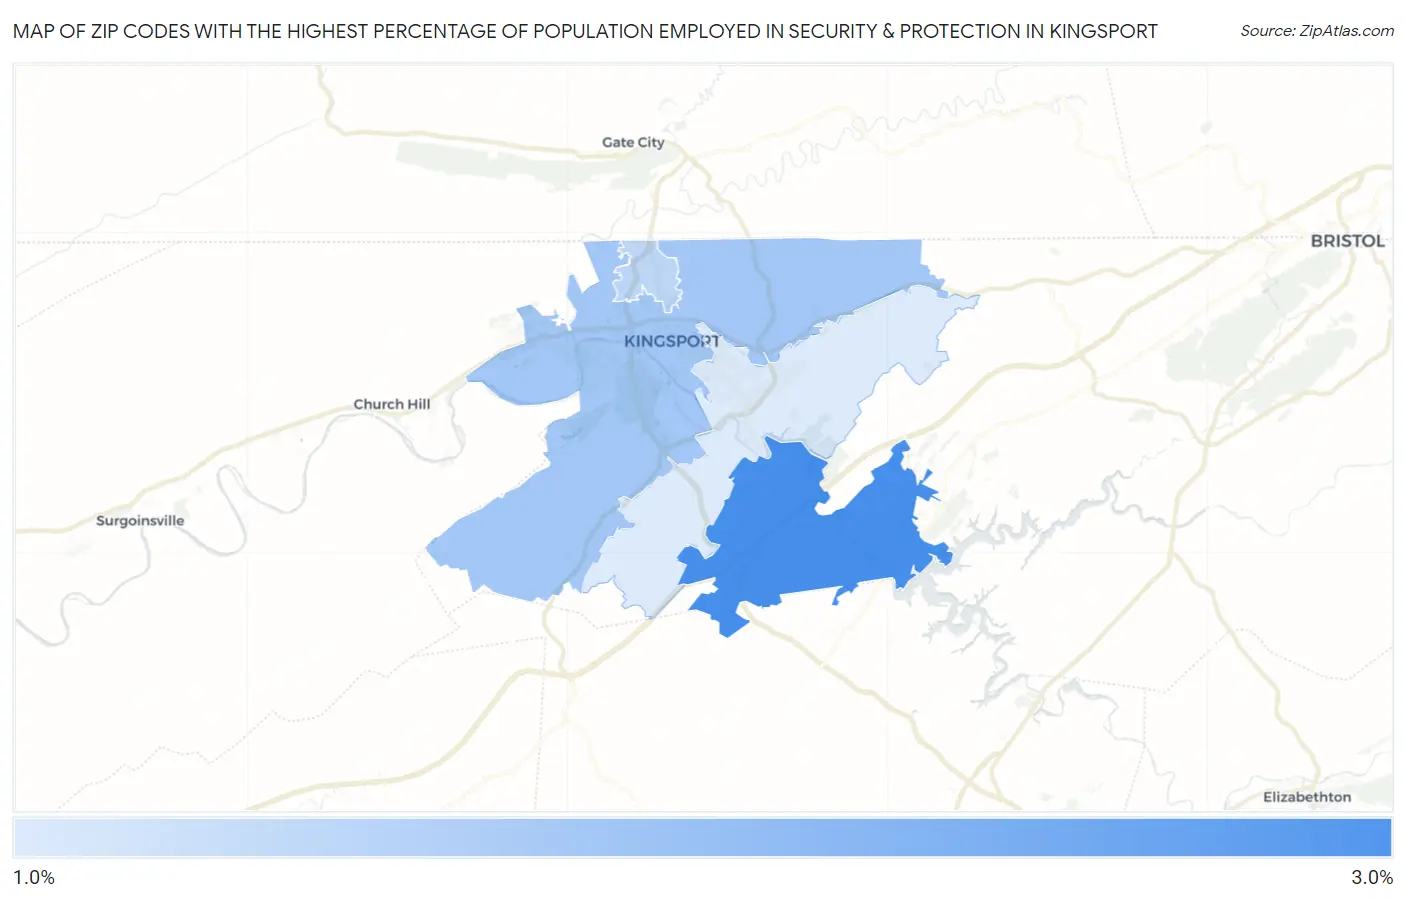
Map of Zip Codes with the Highest Percentage of Population Employed in Security & Protection in Kingsport
1.0%
2.6%
Zip Codes with the Highest Percentage of Population Employed in Security & Protection in Kingsport, TN
| Zip Code | % Employed | vs State | vs National | |
| 1. | 37663 | 2.6% | 2.1%(+0.495)#179 | 2.1%(+0.441)#9,054 |
| 2. | 37660 | 1.6% | 2.1%(-0.479)#314 | 2.1%(-0.534)#15,298 |
| 3. | 37665 | 1.4% | 2.1%(-0.728)#351 | 2.1%(-0.783)#17,210 |
| 4. | 37664 | 1.0% | 2.1%(-1.08)#392 | 2.1%(-1.13)#19,896 |
1
Common Questions
What are the Top 3 Zip Codes with the Highest Percentage of Population Employed in Security & Protection in Kingsport, TN?
Top 3 Zip Codes with the Highest Percentage of Population Employed in Security & Protection in Kingsport, TN are:
What zip code has the Highest Percentage of Population Employed in Security & Protection in Kingsport, TN?
37663 has the Highest Percentage of Population Employed in Security & Protection in Kingsport, TN with 2.6%.
What is the Percentage of Population Employed in Security & Protection in Kingsport, TN?
Percentage of Population Employed in Security & Protection in Kingsport is 1.3%.
What is the Percentage of Population Employed in Security & Protection in Tennessee?
Percentage of Population Employed in Security & Protection in Tennessee is 2.1%.
What is the Percentage of Population Employed in Security & Protection in the United States?
Percentage of Population Employed in Security & Protection in the United States is 2.1%.