Zip Codes with the Highest Percentage of Population Employed in Accommodation & Food Services in Philadelphia, PA

RELATED REPORTS & OPTIONS

Accommodation & Food Services
Population
Families and Households
Female Fertility
Female Fertility (Unmarried)
Race (Community Size)
Race (Percentage)
Ancestry (Community Size)
AfghanAfricanAlaska NativeAlaskan AthabascanAlbanianAmericanApacheArabArgentineanArmenianAustralianAustrianBahamianBangladeshiBarbadianBasqueBelgianBelizeanBermudanBhutaneseBlackfeetBolivianBrazilianBritishBritish West IndianBulgarianBurmeseCajunCambodianCanadianCape VerdeanCarpatho RusynCelticCentral AmericanCentral American IndianCherokeeChickasawChileanChippewaChoctawColombianCosta RicanCreekCroatianCubanCypriotCzechCzechoslovakianDanishDelawareDominicanDutchEastern EuropeanEcuadorianEgyptianEnglishEstonianEthiopianEuropeanFilipinoFinnishFrenchFrench American IndianFrench CanadianGermanGerman RussianGhanaianGreekGuamanian / ChamorroGuatemalanGuyaneseHaitianHonduranHungarianIcelanderIndian (Asian)IndonesianInupiatIranianIraqiIrishIroquoisIsraeliItalianJamaicanJapaneseJordanianKenyanKoreanLaotianLatvianLebaneseLiberianLithuanianLumbeeMacedonianMalaysianMexicanMexican American IndianMongolianMoroccanNative HawaiianNavajoNew ZealanderNicaraguanNigerianNorthern EuropeanNorwegianOkinawanPakistaniPalestinianPanamanianParaguayanPennsylvania GermanPeruvianPolishPortuguesePotawatomiPuerto RicanRomanianRussianSalvadoranSamoanScandinavianScotch-IrishScottishSeminoleSenegaleseSerbianShoshoneSierra LeoneanSiouxSlavicSlovakSloveneSomaliSouth AfricanSouth AmericanSouth American IndianSpaniardSpanishSpanish AmericanSri LankanSubsaharan AfricanSudaneseSwedishSwissSyrianThaiTrinidadian and TobagonianTurkishU.S. Virgin IslanderUgandanUkrainianUruguayanVenezuelanVietnameseWelshWest IndianYugoslavian
Ancestry (Percentage)
AfghanAfricanAlaska NativeAlaskan AthabascanAlbanianAmericanApacheArabArgentineanArmenianAustralianAustrianBahamianBangladeshiBarbadianBasqueBelgianBelizeanBermudanBhutaneseBlackfeetBolivianBrazilianBritishBritish West IndianBulgarianBurmeseCajunCambodianCanadianCape VerdeanCarpatho RusynCelticCentral AmericanCentral American IndianCherokeeChickasawChileanChippewaChoctawColombianCosta RicanCreekCroatianCubanCypriotCzechCzechoslovakianDanishDelawareDominicanDutchEastern EuropeanEcuadorianEgyptianEnglishEstonianEthiopianEuropeanFilipinoFinnishFrenchFrench American IndianFrench CanadianGermanGerman RussianGhanaianGreekGuamanian / ChamorroGuatemalanGuyaneseHaitianHonduranHungarianIcelanderIndian (Asian)IndonesianInupiatIranianIraqiIrishIroquoisIsraeliItalianJamaicanJapaneseJordanianKenyanKoreanLaotianLatvianLebaneseLiberianLithuanianLumbeeMacedonianMalaysianMexicanMexican American IndianMongolianMoroccanNative HawaiianNavajoNew ZealanderNicaraguanNigerianNorthern EuropeanNorwegianOkinawanPakistaniPalestinianPanamanianParaguayanPennsylvania GermanPeruvianPolishPortuguesePotawatomiPuerto RicanRomanianRussianSalvadoranSamoanScandinavianScotch-IrishScottishSeminoleSenegaleseSerbianShoshoneSierra LeoneanSiouxSlavicSlovakSloveneSomaliSouth AfricanSouth AmericanSouth American IndianSpaniardSpanishSpanish AmericanSri LankanSubsaharan AfricanSudaneseSwedishSwissSyrianThaiTrinidadian and TobagonianTurkishU.S. Virgin IslanderUgandanUkrainianUruguayanVenezuelanVietnameseWelshWest IndianYugoslavian
Immigrant Origin (Total)
AfghanistanAfricaAlbaniaArgentinaArmeniaAsiaAustraliaAustriaBangladeshBarbadosBelarusBelgiumBelizeBoliviaBosnia and HerzegovinaBrazilBulgariaBurma / MyanmarCambodiaCameroonCanadaCaribbeanCentral AmericaChileChinaColombiaCongoCosta RicaCroatiaCubaCzechoslovakiaDenmarkDominicaDominican RepublicEastern AfricaEastern AsiaEastern EuropeEcuadorEgyptEl SalvadorEnglandEritreaEthiopiaEuropeFranceGermanyGhanaGreeceGrenadaGuatemalaGuyanaHaitiHondurasHong KongHungaryIndiaIndonesiaIranIraqIrelandIsraelItalyJamaicaJapanJordanKazakhstanKenyaKoreaKuwaitLaosLatin AmericaLatviaLebanonLiberiaLithuaniaMalaysiaMexicoMiddle AfricaMoldovaMoroccoNepalNetherlandsNicaraguaNigeriaNorth MacedoniaNorthern AfricaNorthern EuropeNorwayOceaniaPakistanPanamaPeruPhilippinesPolandPortugalRomaniaRussiaSaudi ArabiaScotlandSenegalSerbiaSierra LeoneSingaporeSouth AfricaSouth AmericaSouth Central AsiaSouth Eastern AsiaSouthern EuropeSpainSri LankaSt. Vincent and the GrenadinesSudanSwedenSwitzerlandSyriaTaiwanThailandTrinidad and TobagoTurkeyUkraineUruguayUzbekistanVenezuelaVietnamWest IndiesWestern AfricaWestern AsiaWestern EuropeZaireZimbabwe
Immigrant Origin (Percentage)
AfghanistanAfricaAlbaniaArgentinaArmeniaAsiaAustraliaAustriaBangladeshBarbadosBelarusBelgiumBelizeBoliviaBosnia and HerzegovinaBrazilBulgariaBurma / MyanmarCambodiaCameroonCanadaCaribbeanCentral AmericaChileChinaColombiaCongoCosta RicaCroatiaCubaCzechoslovakiaDenmarkDominicaDominican RepublicEastern AfricaEastern AsiaEastern EuropeEcuadorEgyptEl SalvadorEnglandEritreaEthiopiaEuropeFranceGermanyGhanaGreeceGrenadaGuatemalaGuyanaHaitiHondurasHong KongHungaryIndiaIndonesiaIranIraqIrelandIsraelItalyJamaicaJapanJordanKazakhstanKenyaKoreaKuwaitLaosLatin AmericaLatviaLebanonLiberiaLithuaniaMalaysiaMexicoMiddle AfricaMoldovaMoroccoNepalNetherlandsNicaraguaNigeriaNorth MacedoniaNorthern AfricaNorthern EuropeNorwayOceaniaPakistanPanamaPeruPhilippinesPolandPortugalRomaniaRussiaSaudi ArabiaScotlandSenegalSerbiaSierra LeoneSingaporeSouth AfricaSouth AmericaSouth Central AsiaSouth Eastern AsiaSouthern EuropeSpainSri LankaSt. Vincent and the GrenadinesSudanSwedenSwitzerlandSyriaTaiwanThailandTrinidad and TobagoTurkeyUkraineUruguayUzbekistanVenezuelaVietnamWest IndiesWestern AfricaWestern AsiaWestern EuropeZaireZimbabwe
Income
Income (Families)
Income (Households)
Poverty
Poverty (Families)
Unemployment
Employment Occupations
Employment Industries
Employer Class
Commute Time
Commute Means
School Enrollment
Education by Degree Field
Occupancy
Finances
Physical Characteristics
Philadelphia
Compare Zip Codes
Comparison Subject

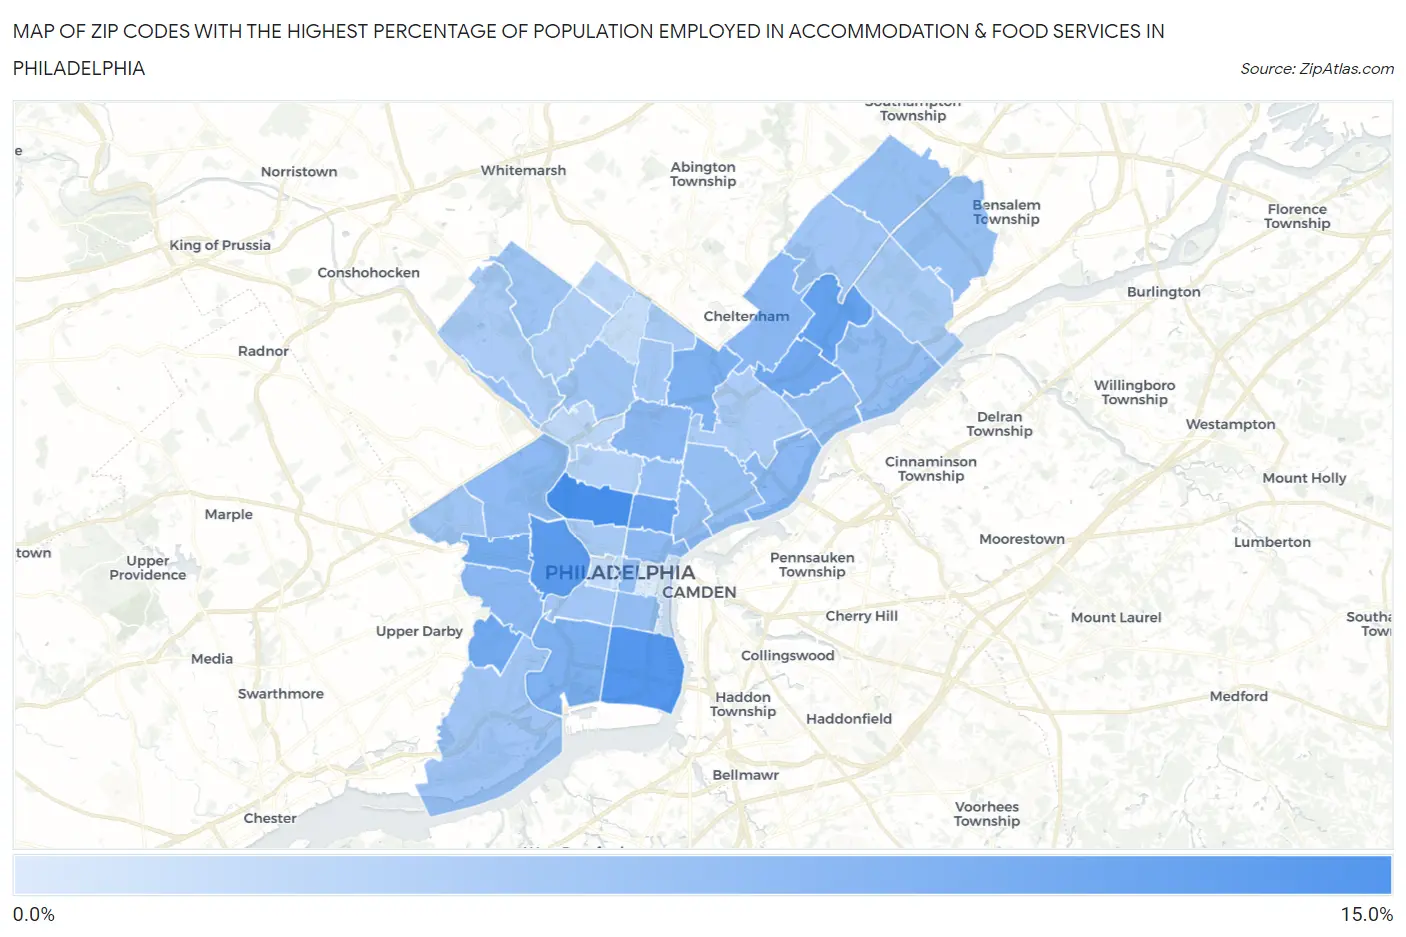
Map of Zip Codes with the Highest Percentage of Population Employed in Accommodation & Food Services in Philadelphia

0.0%
15.0%
Zip Codes with the Highest Percentage of Population Employed in Accommodation & Food Services in Philadelphia Map

Zip Codes with the Highest Percentage of Population Employed in Accommodation & Food Services in Philadelphia, PA

Zip Code % Employed vs State vs National
1.1912112.0%5.9%(+6.16)#1396.9%(+5.16)#2,808
2.1914810.9%5.9%(+5.02)#1766.9%(+4.03)#3,625
3.1910410.6%5.9%(+4.73)#1856.9%(+3.74)#3,862
4.191529.6%5.9%(+3.71)#2286.9%(+2.72)#5,072
5.191229.4%5.9%(+3.55)#2336.9%(+2.55)#5,299
6.191498.8%5.9%(+2.88)#2726.9%(+1.89)#6,338
7.191428.5%5.9%(+2.62)#2896.9%(+1.63)#6,810
8.191398.4%5.9%(+2.54)#2976.9%(+1.55)#6,946
9.191207.7%5.9%(+1.82)#3756.9%(+0.829)#8,472
10.191457.7%5.9%(+1.78)#3826.9%(+0.788)#8,581
11.191406.8%5.9%(+0.910)#4916.9%(-0.082)#10,890
12.191116.7%5.9%(+0.831)#5126.9%(-0.161)#11,143
13.191436.7%5.9%(+0.787)#5196.9%(-0.205)#11,271
14.191376.7%5.9%(+0.781)#5216.9%(-0.210)#11,281
15.191316.4%5.9%(+0.510)#5746.9%(-0.482)#12,163
16.191236.3%5.9%(+0.441)#5876.9%(-0.551)#12,376
17.191356.1%5.9%(+0.236)#6226.9%(-0.756)#13,047
18.191366.1%5.9%(+0.206)#6266.9%(-0.786)#13,149
19.191256.1%5.9%(+0.187)#6396.9%(-0.804)#13,221
20.191076.1%5.9%(+0.186)#6406.9%(-0.806)#13,228
21.191476.0%5.9%(+0.065)#6636.9%(-0.927)#13,594
22.191345.9%5.9%(+0.058)#6646.9%(-0.934)#13,614
23.191545.9%5.9%(+0.010)#6706.9%(-0.982)#13,774
24.191165.9%5.9%(-0.020)#6796.9%(-1.01)#13,880
25.191335.8%5.9%(-0.117)#7016.9%(-1.11)#14,152
26.191275.3%5.9%(-0.630)#8166.9%(-1.62)#15,926
27.191185.2%5.9%(-0.672)#8276.9%(-1.66)#16,050
28.191445.2%5.9%(-0.718)#8436.9%(-1.71)#16,201
29.191515.0%5.9%(-0.859)#8676.9%(-1.85)#16,720
30.191155.0%5.9%(-0.882)#8686.9%(-1.87)#16,798
31.191534.9%5.9%(-0.975)#8846.9%(-1.97)#17,119
32.191464.9%5.9%(-1.02)#8936.9%(-2.01)#17,240
33.191414.7%5.9%(-1.16)#9296.9%(-2.16)#17,737
34.191264.5%5.9%(-1.35)#9656.9%(-2.34)#18,373
35.191304.5%5.9%(-1.36)#9676.9%(-2.35)#18,392
36.191144.5%5.9%(-1.38)#9736.9%(-2.37)#18,459
37.191284.4%5.9%(-1.53)#1,0116.9%(-2.53)#18,980
38.191244.3%5.9%(-1.55)#1,0156.9%(-2.54)#19,038
39.191193.8%5.9%(-2.13)#1,1456.9%(-3.12)#20,911
40.191323.6%5.9%(-2.24)#1,1786.9%(-3.23)#21,297
41.191503.1%5.9%(-2.80)#1,2746.9%(-3.79)#22,956
42.191292.8%5.9%(-3.07)#1,3246.9%(-4.06)#23,675
43.191032.5%5.9%(-3.37)#1,3646.9%(-4.36)#24,440
44.191382.3%5.9%(-3.60)#1,3986.9%(-4.59)#24,965
45.191022.0%5.9%(-3.84)#1,4316.9%(-4.83)#25,458
46.191060.52%5.9%(-5.37)#1,5206.9%(-6.36)#27,846

Common Questions

What are the Top 10 Zip Codes with the Highest Percentage of Population Employed in Accommodation & Food Services in Philadelphia, PA?
Top 10 Zip Codes with the Highest Percentage of Population Employed in Accommodation & Food Services in Philadelphia, PA are:
#1
12.0%
#2
10.9%
#3
10.6%
#4
9.6%
#5
9.4%
#6
8.8%
#7
8.5%
#8
8.4%
#9
7.7%
#10
7.7%
What zip code has the Highest Percentage of Population Employed in Accommodation & Food Services in Philadelphia, PA?
19121 has the Highest Percentage of Population Employed in Accommodation & Food Services in Philadelphia, PA with 12.0%.
What is the Percentage of Population Employed in Accommodation & Food Services in Philadelphia, PA?
Percentage of Population Employed in Accommodation & Food Services in Philadelphia is 6.3%.
What is the Percentage of Population Employed in Accommodation & Food Services in Pennsylvania?
Percentage of Population Employed in Accommodation & Food Services in Pennsylvania is 5.9%.
What is the Percentage of Population Employed in Accommodation & Food Services in the United States?
Percentage of Population Employed in Accommodation & Food Services in the United States is 6.9%.