Zip Codes with the Highest Percentage of Population Employed in Education Instruction & Library in Philadelphia, PA

RELATED REPORTS & OPTIONS

Education Instruction & Library
Population
Families and Households
Female Fertility
Female Fertility (Unmarried)
Race (Community Size)
Race (Percentage)
Ancestry (Community Size)
AfghanAfricanAlaska NativeAlaskan AthabascanAlbanianAmericanApacheArabArgentineanArmenianAustralianAustrianBahamianBangladeshiBarbadianBasqueBelgianBelizeanBermudanBhutaneseBlackfeetBolivianBrazilianBritishBritish West IndianBulgarianBurmeseCajunCambodianCanadianCape VerdeanCarpatho RusynCelticCentral AmericanCentral American IndianCherokeeChickasawChileanChippewaChoctawColombianCosta RicanCreekCroatianCubanCypriotCzechCzechoslovakianDanishDelawareDominicanDutchEastern EuropeanEcuadorianEgyptianEnglishEstonianEthiopianEuropeanFilipinoFinnishFrenchFrench American IndianFrench CanadianGermanGerman RussianGhanaianGreekGuamanian / ChamorroGuatemalanGuyaneseHaitianHonduranHungarianIcelanderIndian (Asian)IndonesianInupiatIranianIraqiIrishIroquoisIsraeliItalianJamaicanJapaneseJordanianKenyanKoreanLaotianLatvianLebaneseLiberianLithuanianLumbeeMacedonianMalaysianMexicanMexican American IndianMongolianMoroccanNative HawaiianNavajoNew ZealanderNicaraguanNigerianNorthern EuropeanNorwegianOkinawanPakistaniPalestinianPanamanianParaguayanPennsylvania GermanPeruvianPolishPortuguesePotawatomiPuerto RicanRomanianRussianSalvadoranSamoanScandinavianScotch-IrishScottishSeminoleSenegaleseSerbianShoshoneSierra LeoneanSiouxSlavicSlovakSloveneSomaliSouth AfricanSouth AmericanSouth American IndianSpaniardSpanishSpanish AmericanSri LankanSubsaharan AfricanSudaneseSwedishSwissSyrianThaiTrinidadian and TobagonianTurkishU.S. Virgin IslanderUgandanUkrainianUruguayanVenezuelanVietnameseWelshWest IndianYugoslavian
Ancestry (Percentage)
AfghanAfricanAlaska NativeAlaskan AthabascanAlbanianAmericanApacheArabArgentineanArmenianAustralianAustrianBahamianBangladeshiBarbadianBasqueBelgianBelizeanBermudanBhutaneseBlackfeetBolivianBrazilianBritishBritish West IndianBulgarianBurmeseCajunCambodianCanadianCape VerdeanCarpatho RusynCelticCentral AmericanCentral American IndianCherokeeChickasawChileanChippewaChoctawColombianCosta RicanCreekCroatianCubanCypriotCzechCzechoslovakianDanishDelawareDominicanDutchEastern EuropeanEcuadorianEgyptianEnglishEstonianEthiopianEuropeanFilipinoFinnishFrenchFrench American IndianFrench CanadianGermanGerman RussianGhanaianGreekGuamanian / ChamorroGuatemalanGuyaneseHaitianHonduranHungarianIcelanderIndian (Asian)IndonesianInupiatIranianIraqiIrishIroquoisIsraeliItalianJamaicanJapaneseJordanianKenyanKoreanLaotianLatvianLebaneseLiberianLithuanianLumbeeMacedonianMalaysianMexicanMexican American IndianMongolianMoroccanNative HawaiianNavajoNew ZealanderNicaraguanNigerianNorthern EuropeanNorwegianOkinawanPakistaniPalestinianPanamanianParaguayanPennsylvania GermanPeruvianPolishPortuguesePotawatomiPuerto RicanRomanianRussianSalvadoranSamoanScandinavianScotch-IrishScottishSeminoleSenegaleseSerbianShoshoneSierra LeoneanSiouxSlavicSlovakSloveneSomaliSouth AfricanSouth AmericanSouth American IndianSpaniardSpanishSpanish AmericanSri LankanSubsaharan AfricanSudaneseSwedishSwissSyrianThaiTrinidadian and TobagonianTurkishU.S. Virgin IslanderUgandanUkrainianUruguayanVenezuelanVietnameseWelshWest IndianYugoslavian
Immigrant Origin (Total)
AfghanistanAfricaAlbaniaArgentinaArmeniaAsiaAustraliaAustriaBangladeshBarbadosBelarusBelgiumBelizeBoliviaBosnia and HerzegovinaBrazilBulgariaBurma / MyanmarCambodiaCameroonCanadaCaribbeanCentral AmericaChileChinaColombiaCongoCosta RicaCroatiaCubaCzechoslovakiaDenmarkDominicaDominican RepublicEastern AfricaEastern AsiaEastern EuropeEcuadorEgyptEl SalvadorEnglandEritreaEthiopiaEuropeFranceGermanyGhanaGreeceGrenadaGuatemalaGuyanaHaitiHondurasHong KongHungaryIndiaIndonesiaIranIraqIrelandIsraelItalyJamaicaJapanJordanKazakhstanKenyaKoreaKuwaitLaosLatin AmericaLatviaLebanonLiberiaLithuaniaMalaysiaMexicoMiddle AfricaMoldovaMoroccoNepalNetherlandsNicaraguaNigeriaNorth MacedoniaNorthern AfricaNorthern EuropeNorwayOceaniaPakistanPanamaPeruPhilippinesPolandPortugalRomaniaRussiaSaudi ArabiaScotlandSenegalSerbiaSierra LeoneSingaporeSouth AfricaSouth AmericaSouth Central AsiaSouth Eastern AsiaSouthern EuropeSpainSri LankaSt. Vincent and the GrenadinesSudanSwedenSwitzerlandSyriaTaiwanThailandTrinidad and TobagoTurkeyUkraineUruguayUzbekistanVenezuelaVietnamWest IndiesWestern AfricaWestern AsiaWestern EuropeZaireZimbabwe
Immigrant Origin (Percentage)
AfghanistanAfricaAlbaniaArgentinaArmeniaAsiaAustraliaAustriaBangladeshBarbadosBelarusBelgiumBelizeBoliviaBosnia and HerzegovinaBrazilBulgariaBurma / MyanmarCambodiaCameroonCanadaCaribbeanCentral AmericaChileChinaColombiaCongoCosta RicaCroatiaCubaCzechoslovakiaDenmarkDominicaDominican RepublicEastern AfricaEastern AsiaEastern EuropeEcuadorEgyptEl SalvadorEnglandEritreaEthiopiaEuropeFranceGermanyGhanaGreeceGrenadaGuatemalaGuyanaHaitiHondurasHong KongHungaryIndiaIndonesiaIranIraqIrelandIsraelItalyJamaicaJapanJordanKazakhstanKenyaKoreaKuwaitLaosLatin AmericaLatviaLebanonLiberiaLithuaniaMalaysiaMexicoMiddle AfricaMoldovaMoroccoNepalNetherlandsNicaraguaNigeriaNorth MacedoniaNorthern AfricaNorthern EuropeNorwayOceaniaPakistanPanamaPeruPhilippinesPolandPortugalRomaniaRussiaSaudi ArabiaScotlandSenegalSerbiaSierra LeoneSingaporeSouth AfricaSouth AmericaSouth Central AsiaSouth Eastern AsiaSouthern EuropeSpainSri LankaSt. Vincent and the GrenadinesSudanSwedenSwitzerlandSyriaTaiwanThailandTrinidad and TobagoTurkeyUkraineUruguayUzbekistanVenezuelaVietnamWest IndiesWestern AfricaWestern AsiaWestern EuropeZaireZimbabwe
Income
Income (Families)
Income (Households)
Poverty
Poverty (Families)
Unemployment
Employment Occupations
Employment Industries
Employer Class
Commute Time
Commute Means
School Enrollment
Education by Degree Field
Occupancy
Finances
Physical Characteristics
Philadelphia
Compare Zip Codes
Comparison Subject

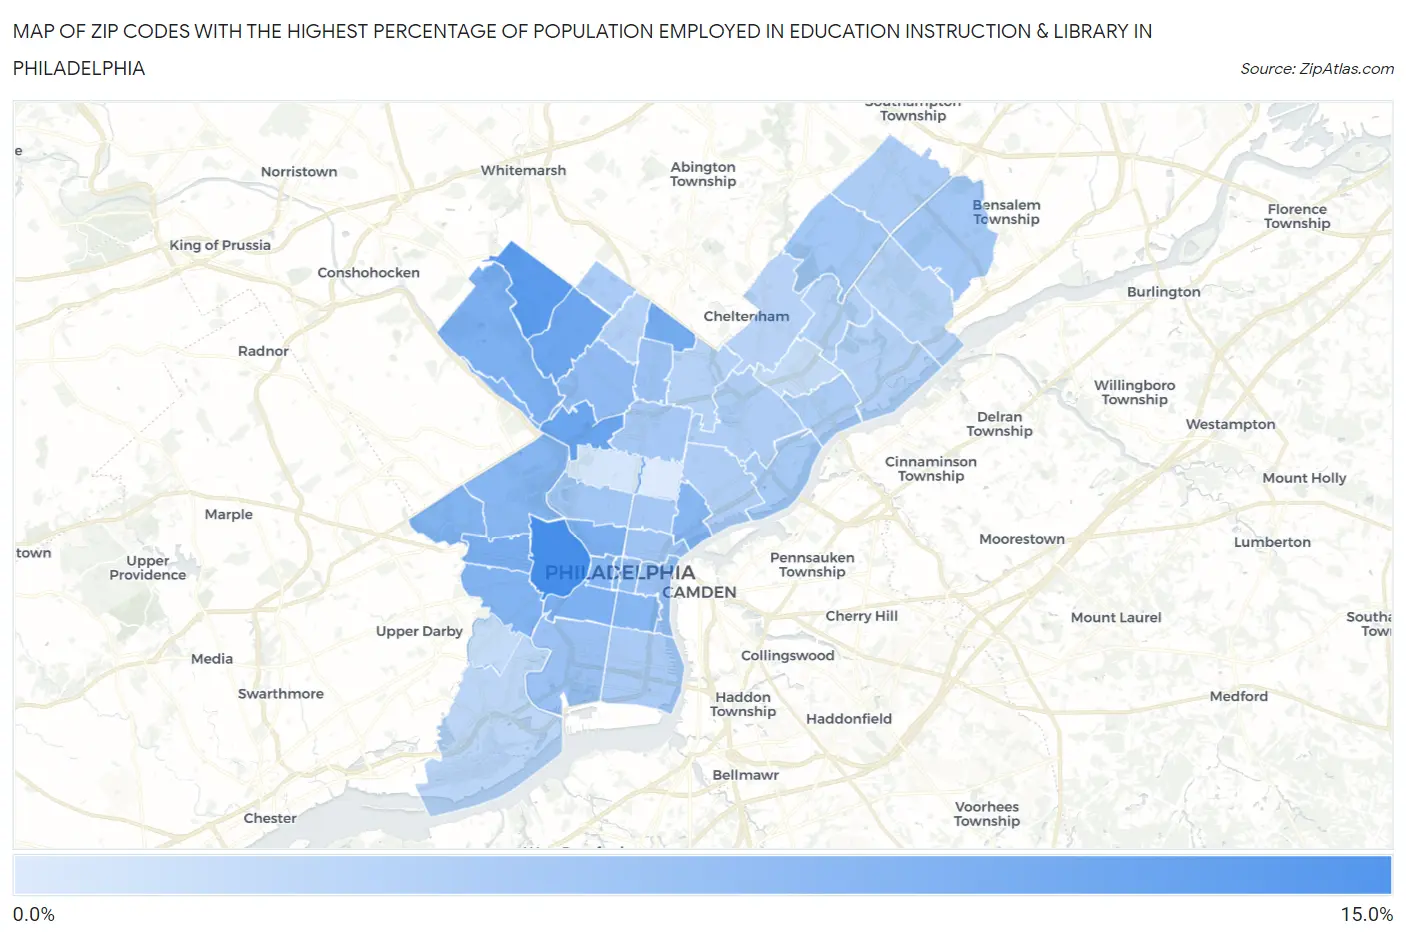
Map of Zip Codes with the Highest Percentage of Population Employed in Education Instruction & Library in Philadelphia

0.0%
15.0%
Zip Codes with the Highest Percentage of Population Employed in Education Instruction & Library in Philadelphia Map

Zip Codes with the Highest Percentage of Population Employed in Education Instruction & Library in Philadelphia, PA

Zip Code % Employed vs State vs National
1.1910413.4%6.2%(+7.20)#686.2%(+7.19)#1,759
2.1911811.7%6.2%(+5.50)#936.2%(+5.49)#2,588
3.1912910.2%6.2%(+4.07)#1426.2%(+4.06)#3,696
4.1911910.1%6.2%(+3.91)#1446.2%(+3.89)#3,847
5.191269.3%6.2%(+3.18)#1696.2%(+3.17)#4,713
6.191399.0%6.2%(+2.80)#1926.2%(+2.79)#5,283
7.191308.9%6.2%(+2.70)#2006.2%(+2.68)#5,447
8.191288.8%6.2%(+2.62)#2096.2%(+2.60)#5,559
9.191468.6%6.2%(+2.48)#2126.2%(+2.46)#5,823
10.191438.3%6.2%(+2.16)#2406.2%(+2.14)#6,473
11.191518.2%6.2%(+2.08)#2466.2%(+2.07)#6,617
12.191278.0%6.2%(+1.79)#2746.2%(+1.77)#7,258
13.191477.9%6.2%(+1.72)#2846.2%(+1.71)#7,399
14.191037.9%6.2%(+1.71)#2856.2%(+1.70)#7,416
15.191257.9%6.2%(+1.70)#2886.2%(+1.68)#7,455
16.191317.8%6.2%(+1.67)#2926.2%(+1.66)#7,535
17.191027.4%6.2%(+1.27)#3476.2%(+1.25)#8,609
18.191447.1%6.2%(+0.891)#3916.2%(+0.878)#9,712
19.191077.0%6.2%(+0.783)#4126.2%(+0.770)#10,070
20.191066.4%6.2%(+0.274)#5026.2%(+0.261)#11,808
21.191456.2%6.2%(+0.055)#5506.2%(+0.042)#12,673
22.191416.2%6.2%(+0.025)#5546.2%(+0.012)#12,771
23.191235.8%6.2%(-0.414)#6286.2%(-0.427)#14,506
24.191155.7%6.2%(-0.473)#6476.2%(-0.486)#14,752
25.191545.7%6.2%(-0.499)#6506.2%(-0.512)#14,867
26.191215.6%6.2%(-0.593)#6686.2%(-0.606)#15,244
27.191225.5%6.2%(-0.714)#6896.2%(-0.727)#15,720
28.191405.4%6.2%(-0.794)#7076.2%(-0.807)#16,087
29.191375.3%6.2%(-0.857)#7206.2%(-0.871)#16,332
30.191485.0%6.2%(-1.16)#7946.2%(-1.17)#17,597
31.191505.0%6.2%(-1.21)#8066.2%(-1.23)#17,836
32.191164.9%6.2%(-1.30)#8236.2%(-1.31)#18,176
33.191354.8%6.2%(-1.38)#8456.2%(-1.39)#18,538
34.191344.7%6.2%(-1.48)#8696.2%(-1.49)#18,944
35.191244.6%6.2%(-1.57)#8986.2%(-1.58)#19,323
36.191364.4%6.2%(-1.82)#9636.2%(-1.83)#20,307
37.191524.3%6.2%(-1.89)#9786.2%(-1.90)#20,581
38.191384.2%6.2%(-1.95)#9916.2%(-1.97)#20,846
39.191144.2%6.2%(-2.01)#1,0006.2%(-2.03)#21,079
40.191204.1%6.2%(-2.08)#1,0136.2%(-2.09)#21,336
41.191114.0%6.2%(-2.21)#1,0416.2%(-2.23)#21,817
42.191533.6%6.2%(-2.55)#1,1186.2%(-2.56)#22,964
43.191493.0%6.2%(-3.22)#1,2456.2%(-3.23)#24,934
44.191422.9%6.2%(-3.26)#1,2516.2%(-3.27)#25,030
45.191321.7%6.2%(-4.50)#1,4066.2%(-4.51)#27,434
46.191331.0%6.2%(-5.15)#1,4616.2%(-5.16)#28,200

Common Questions

What are the Top 10 Zip Codes with the Highest Percentage of Population Employed in Education Instruction & Library in Philadelphia, PA?
Top 10 Zip Codes with the Highest Percentage of Population Employed in Education Instruction & Library in Philadelphia, PA are:
#1
13.4%
#2
11.7%
#3
10.2%
#4
10.1%
#5
9.3%
#6
9.0%
#7
8.9%
#8
8.8%
#9
8.6%
#10
8.3%
What zip code has the Highest Percentage of Population Employed in Education Instruction & Library in Philadelphia, PA?
19104 has the Highest Percentage of Population Employed in Education Instruction & Library in Philadelphia, PA with 13.4%.
What is the Percentage of Population Employed in Education Instruction & Library in Philadelphia, PA?
Percentage of Population Employed in Education Instruction & Library in Philadelphia is 6.3%.
What is the Percentage of Population Employed in Education Instruction & Library in Pennsylvania?
Percentage of Population Employed in Education Instruction & Library in Pennsylvania is 6.2%.
What is the Percentage of Population Employed in Education Instruction & Library in the United States?
Percentage of Population Employed in Education Instruction & Library in the United States is 6.2%.